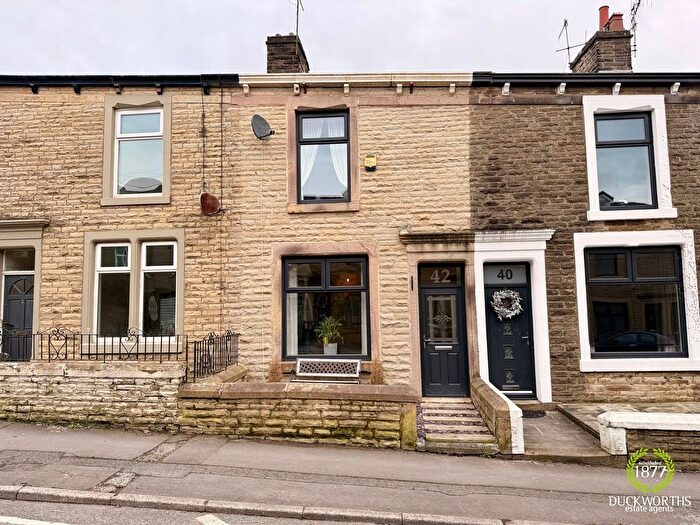
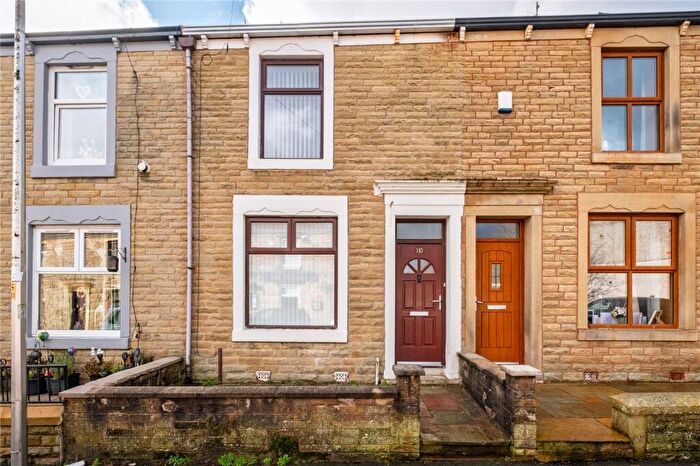
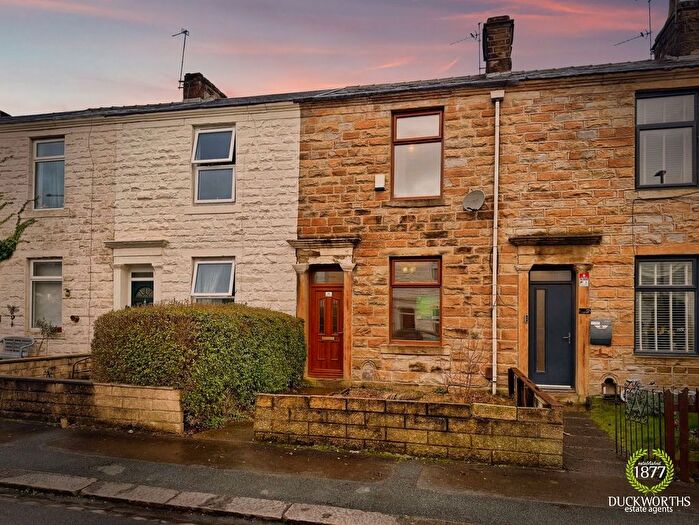
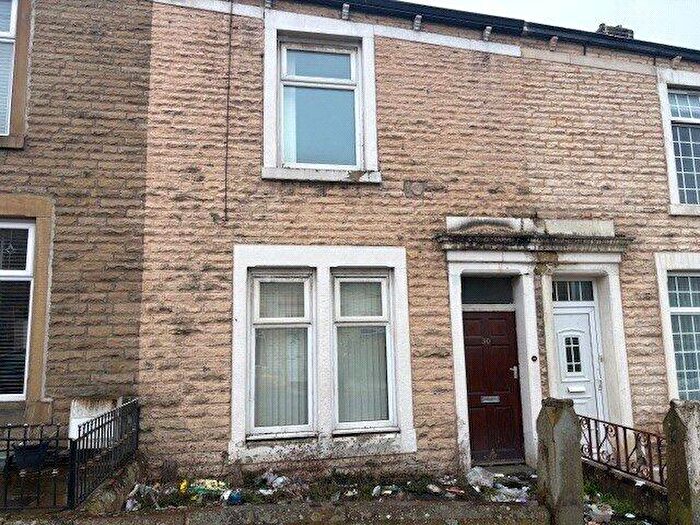
Houses for sale & to rent in St Andrews, Accrington
House Prices in St Andrews
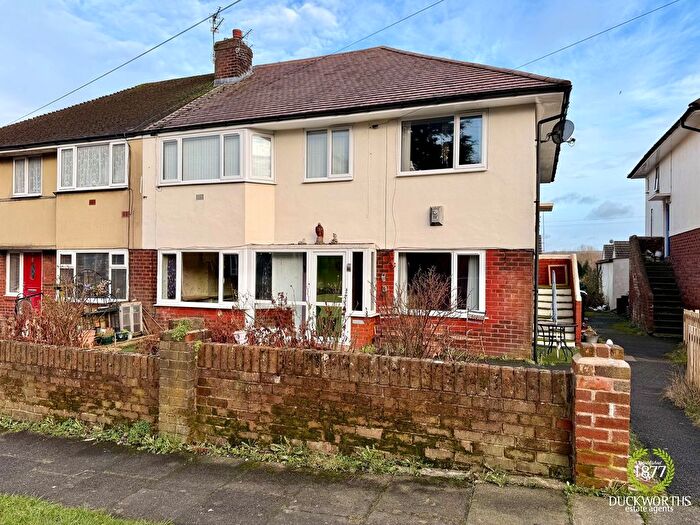
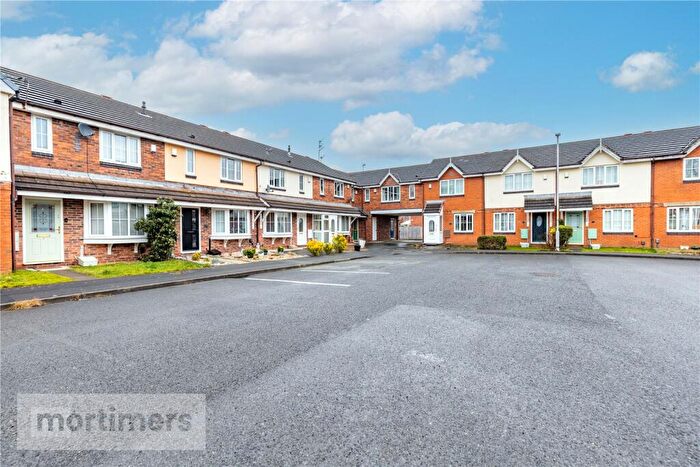
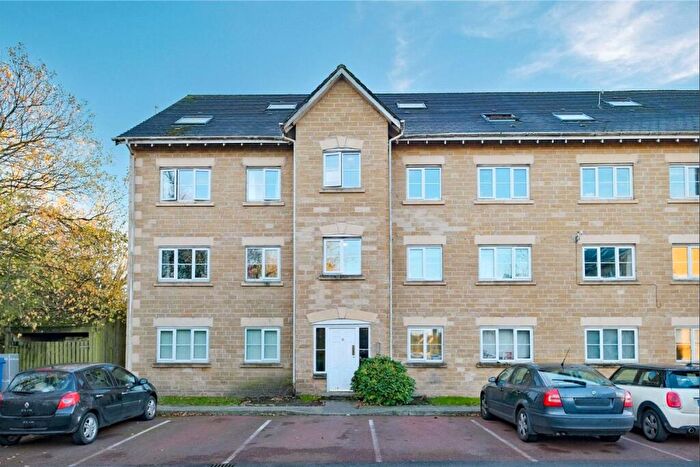
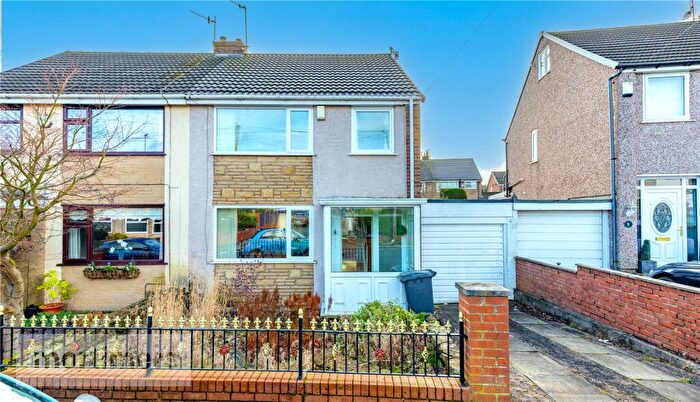
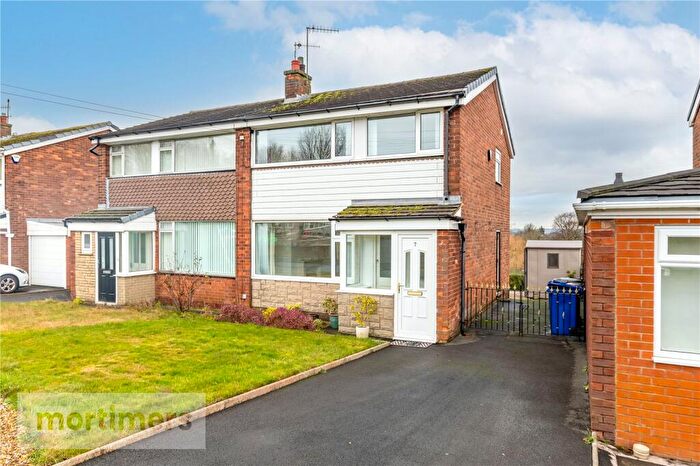
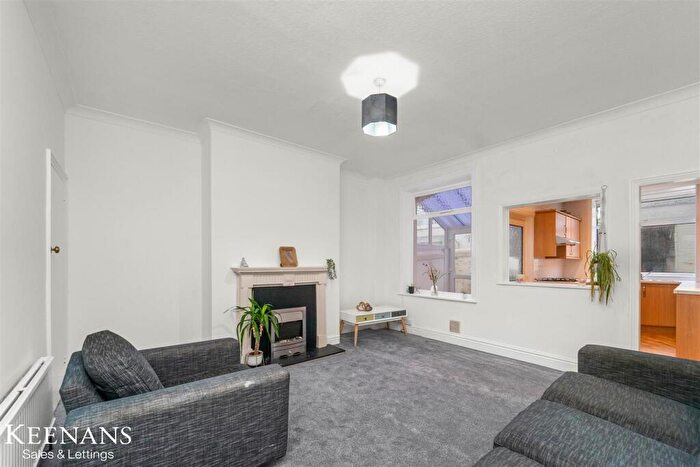
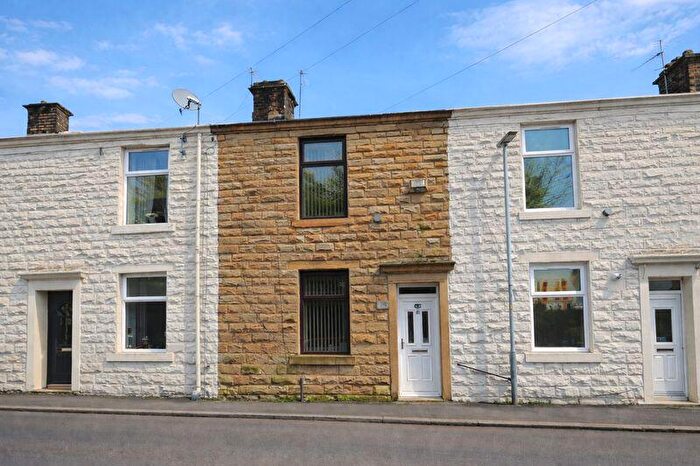
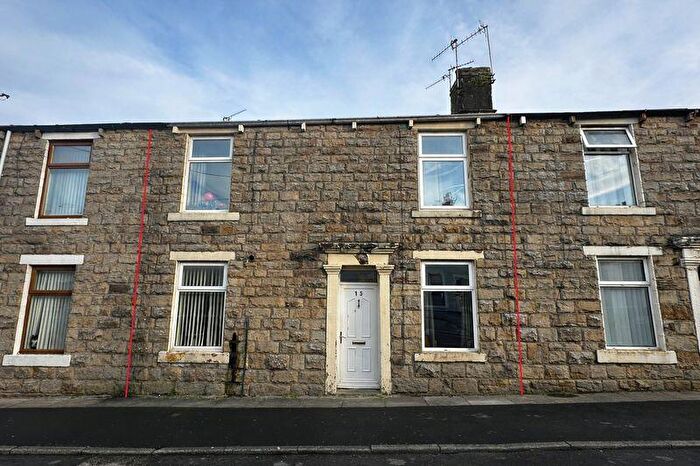
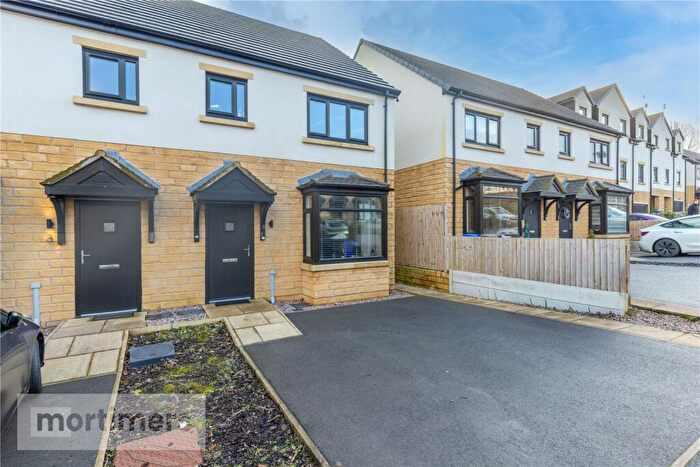
Properties in St Andrews have an average house price of £113,470.90 and had 170 Property Transactions within the last 3 years¹.
St Andrews is an area in Accrington, Lancashire with 2,009 households², where the most expensive property was sold for £300,000.00.
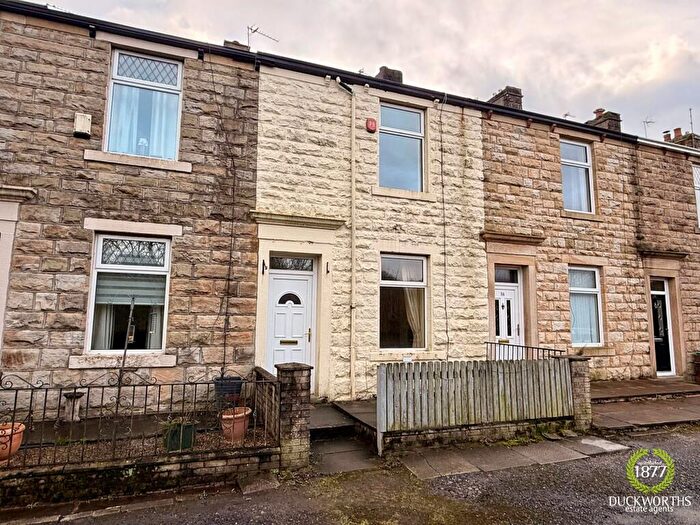
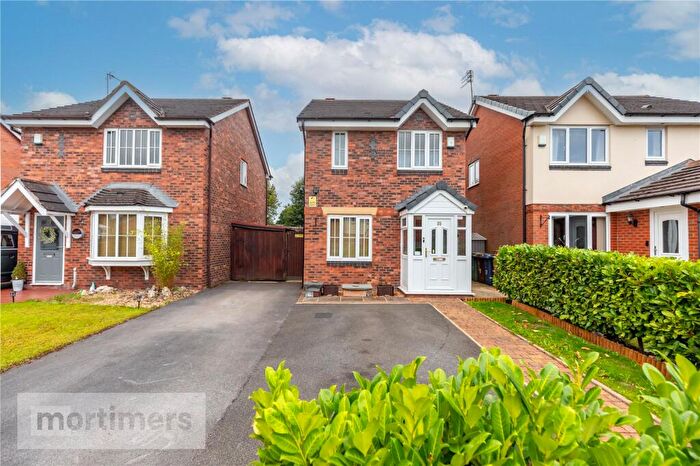
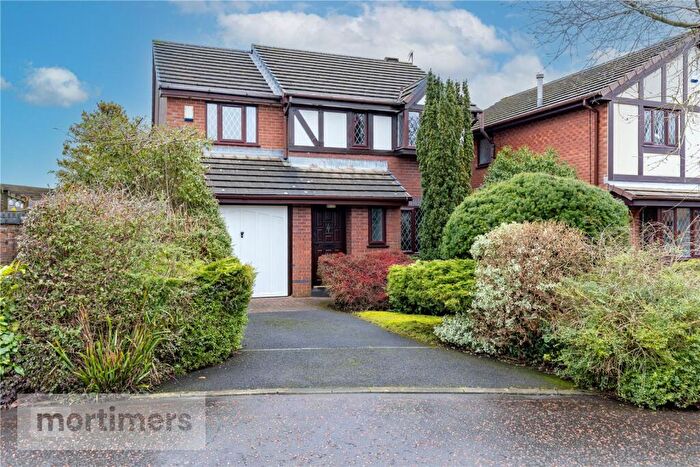
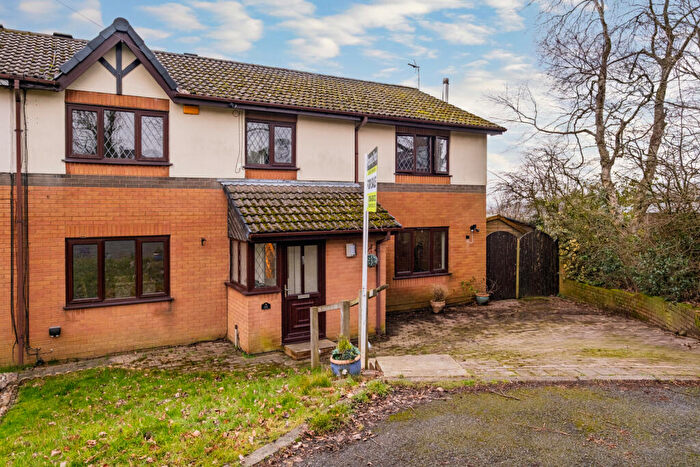
Properties for sale in St Andrews
Roads and Postcodes in St Andrews
Navigate through our locations to find the location of your next house in St Andrews, Accrington for sale or to rent.
| Streets | Postcodes |
|---|---|
| Albert Street | BB5 3NB |
| Apple Tree Way | BB5 0FB |
| Ash Street | BB5 3LN |
| Backhouse Street | BB5 3DW |
| Badge Brow | BB5 3DB |
| Bent Street | BB5 3LF |
| Blackburn Road | BB5 4NZ BB5 4PE |
| Blackpool Street | BB5 0EA |
| Blossom Avenue | BB5 0FD |
| Bramley Close | BB5 0FE |
| Bright Street | BB5 3LD |
| Brook Street | BB5 3JA BB5 3JH |
| Brookfield Grove | BB5 4BN |
| Browning Avenue | BB5 4RQ |
| Burns Avenue | BB5 4RB |
| Bury Street | BB5 3JE |
| Buttermere Drive | BB5 4RE BB5 4PA |
| Byron Close | BB5 4RA |
| Campion Court | BB5 3TG |
| Catlow Hall Street | BB5 3EU BB5 3EZ |
| Cecil Street | BB5 3HF |
| Chapel Street | BB5 3EP |
| Charles Street | BB5 3EX |
| Clayton Street | BB5 0EL |
| Coach Road | BB5 0ED |
| Colliers Street | BB5 3DE BB5 3DF |
| Coopers Close | BB5 3LE |
| Cross Street | BB5 3LL |
| Dale Street | BB5 3EL |
| Dene Bank Road | BB5 3AH |
| Duncan Square | BB5 0EW |
| Ennerdale Close | BB5 4RF |
| Foxfields Close | BB5 3NT |
| Foxhill Bank | BB5 0EQ |
| Foxhill Bank Brow | BB5 0EF |
| Foxhill Terrace | BB5 3NE |
| Frederick Street | BB5 3DH |
| Garden Street | BB5 3LS |
| George Street | BB5 0ET |
| Harrow Street | BB5 3HD |
| Hartley Street | BB5 3NQ |
| Harvey Street | BB5 3LT |
| Haworth Street | BB5 3EA |
| Heys Lane | BB5 3BJ |
| Higher Peel Street | BB5 3JJ |
| Hill Street | BB5 0EH |
| Hodgson Street | BB5 3ND |
| Holly Street | BB5 3LR |
| Hornby Street | BB5 3AG |
| James Street | BB5 3LJ |
| Jubilee Street | BB5 3HE |
| Kay Street | BB5 3JS BB5 3BF BB5 3LH BB5 3LW |
| Lock Street | BB5 3EE |
| Lord Street | BB5 3EF BB5 3HQ |
| Malvern Avenue | BB5 3AQ |
| Marble Street | BB5 3NG |
| Market Street | BB5 0DN |
| Mayfield Avenue | BB5 3AA |
| Mayfield Gardens | BB5 3DL |
| Meadow Court | BB5 3HN |
| Mill Hill | BB5 3LX BB5 3LQ |
| Mill Street | BB5 3HY |
| Miller Close | BB5 4RH |
| Milton Street | BB5 3LZ |
| Monarch Street | BB5 3NA |
| Moon Street | BB5 3DZ |
| Moscow Mill Street | BB5 0EP |
| Moscow Place | BB5 3DN |
| Mount Pleasant Street | BB5 3EN |
| Oakfield Crescent | BB5 3AD |
| Oswald Street | BB5 3JF |
| Packington Brook | BB5 4EX |
| Paddock Street | BB5 3HJ |
| Park Lane | BB5 3AF |
| Parsonage Street | BB5 0HS |
| Patterdale Avenue | BB5 4RG |
| Queen Street | BB5 3DQ |
| Rhyddings Street | BB5 3ER BB5 3EY |
| Ruskin Avenue | BB5 4QY |
| Sadler Street | BB5 0HP |
| Scott Close | BB5 4RD |
| Shed Street | BB5 3JR |
| Simpson Street | BB5 3LP |
| South Shore Street | BB5 0DZ |
| Spring Street | BB5 3EW |
| Spring Terrace | BB5 3LY |
| Springfield Street | BB5 3LG |
| St Andrews Close | BB5 3NH |
| St Annes Close | BB5 0EG |
| St Pauls Court | BB5 3HP |
| Stanhill Lane | BB5 4QF |
| Stone Bridge Lane | BB5 3HX |
| Straits | BB5 3LU |
| Sun Street | BB5 3EB |
| Tennyson Avenue | BB5 4QZ |
| The Cooperage | BB5 3LB |
| The Grove | BB5 0FG |
| The Paddock | BB5 3AB |
| Thomas Street | BB5 3LA |
| Thwaites Road | BB5 4QR BB5 4QU |
| Union Road | BB5 0EJ BB5 3DA BB5 3DD BB5 3DR BB5 3DT BB5 3EG BB5 3HU BB5 3JB BB5 3JD BB5 3NW BB5 3HZ |
| Ward Avenue | BB5 3NP |
| Watson Street | BB5 3HH |
| Wesley Street | BB5 0ES |
| West View | BB5 3NF |
| White Ash Estate | BB5 3JQ |
| White Ash Lane | BB5 3JG |
| Wordsworth Close | BB5 4QP |
| Worsley Court | BB5 3HW |
| BB5 4DP |
Transport near St Andrews
- FAQ
- Price Paid By Year
- Property Type Price
Frequently asked questions about St Andrews
What is the average price for a property for sale in St Andrews?
The average price for a property for sale in St Andrews is £113,471. This amount is 16% lower than the average price in Accrington. There are 747 property listings for sale in St Andrews.
What streets have the most expensive properties for sale in St Andrews?
The streets with the most expensive properties for sale in St Andrews are The Paddock at an average of £276,250, Blossom Avenue at an average of £260,000 and Mayfield Avenue at an average of £242,500.
What streets have the most affordable properties for sale in St Andrews?
The streets with the most affordable properties for sale in St Andrews are Market Street at an average of £33,000, Harvey Street at an average of £42,000 and South Shore Street at an average of £53,000.
Which train stations are available in or near St Andrews?
Some of the train stations available in or near St Andrews are Church and Oswaldtwistle, Accrington and Rishton.
Property Price Paid in St Andrews by Year
The average sold property price by year was:
| Year | Average Sold Price | Price Change |
Sold Properties
|
|---|---|---|---|
| 2025 | £120,804 | 5% |
52 Properties |
| 2024 | £114,631.95 | 8% |
58 Properties |
| 2023 | £105,992 | -13% |
60 Properties |
| 2022 | £119,300 | -72% |
94 Properties |
| 2021 | £204,886.52 | 46% |
95 Properties |
| 2020 | £110,221.9 | 13% |
89 Properties |
| 2019 | £96,244.33 | -7% |
76 Properties |
| 2018 | £102,597.62 | 13% |
63 Properties |
| 2017 | £89,322 | 7% |
70 Properties |
| 2016 | £82,919.71 | -3% |
77 Properties |
| 2015 | £85,297.9 | -1% |
69 Properties |
| 2014 | £86,022 | -13% |
68 Properties |
| 2013 | £97,351 | 11% |
44 Properties |
| 2012 | £87,084 | -1% |
50 Properties |
| 2011 | £88,305 | -1% |
40 Properties |
| 2010 | £88,782 | 10% |
49 Properties |
| 2009 | £80,003 | -15% |
35 Properties |
| 2008 | £92,214 | -6% |
58 Properties |
| 2007 | £97,440 | 6% |
126 Properties |
| 2006 | £91,554 | 11% |
143 Properties |
| 2005 | £81,416 | 17% |
160 Properties |
| 2004 | £67,448 | 29% |
146 Properties |
| 2003 | £47,658 | 2% |
169 Properties |
| 2002 | £46,841 | 11% |
179 Properties |
| 2001 | £41,567 | 1% |
147 Properties |
| 2000 | £40,989 | 2% |
94 Properties |
| 1999 | £40,366 | 10% |
88 Properties |
| 1998 | £36,345 | -4% |
83 Properties |
| 1997 | £37,881 | -2% |
89 Properties |
| 1996 | £38,506 | 19% |
86 Properties |
| 1995 | £31,352 | - |
72 Properties |
Property Price per Property Type in St Andrews
Here you can find historic sold price data in order to help with your property search.
The average Property Paid Price for specific property types in the last three years are:
| Property Type | Average Sold Price | Sold Properties |
|---|---|---|
| Semi Detached House | £161,863.77 | 22 Semi Detached Houses |
| Detached House | £236,000.00 | 5 Detached Houses |
| Terraced House | £101,979.00 | 141 Terraced Houses |
| Flat | £85,000.00 | 2 Flats |

