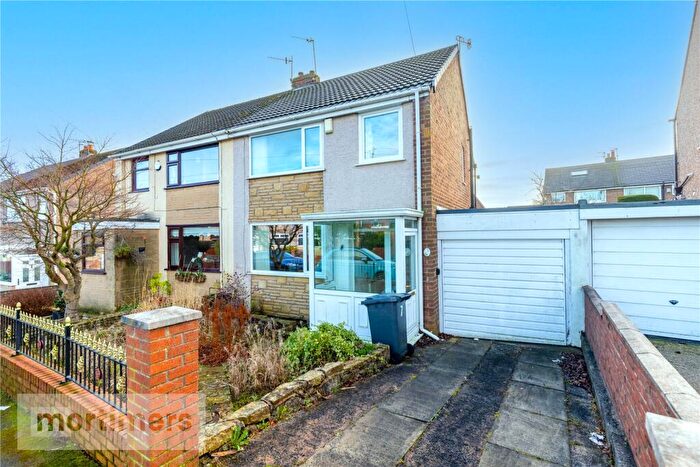
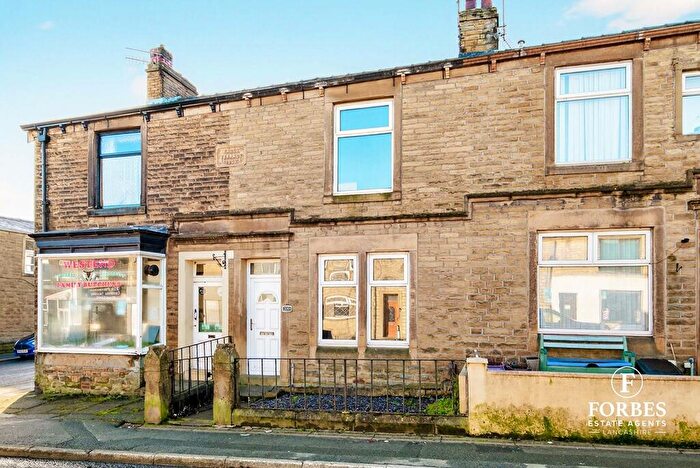
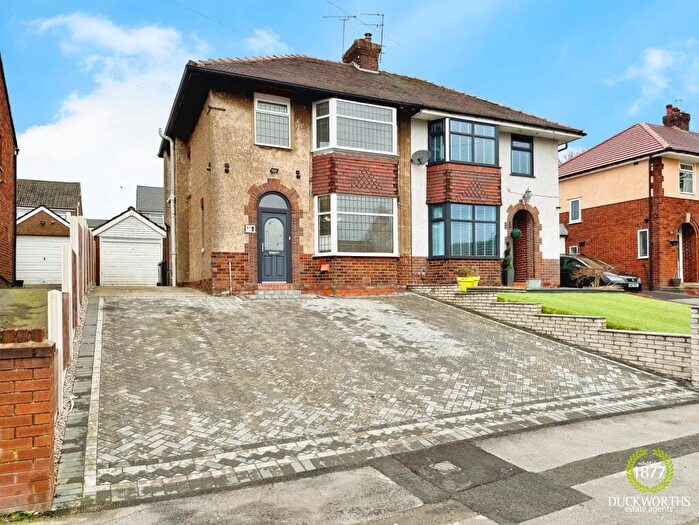
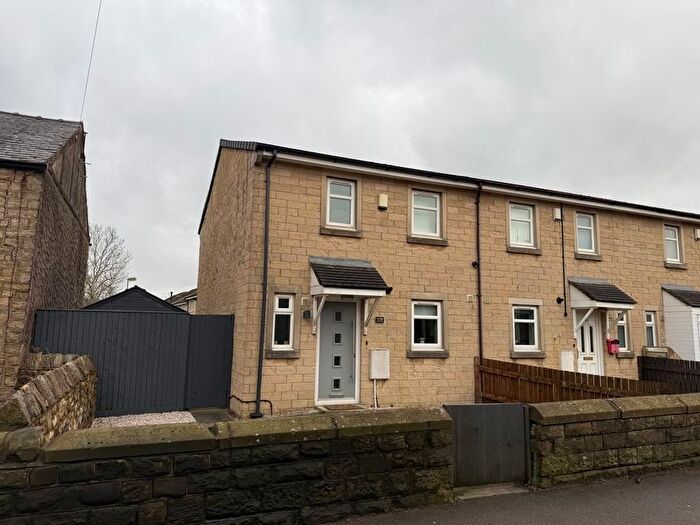
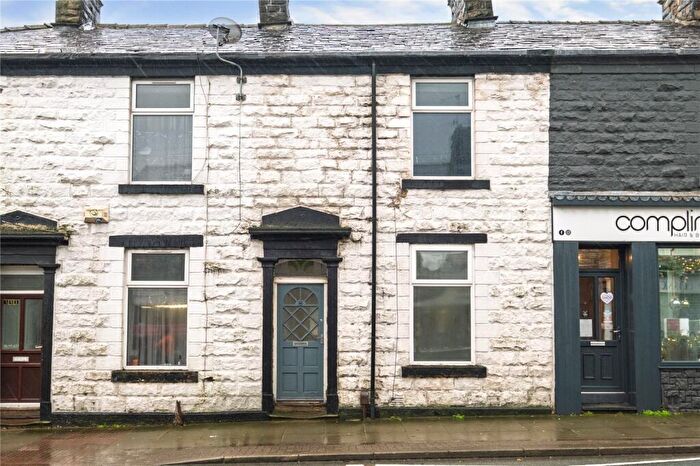
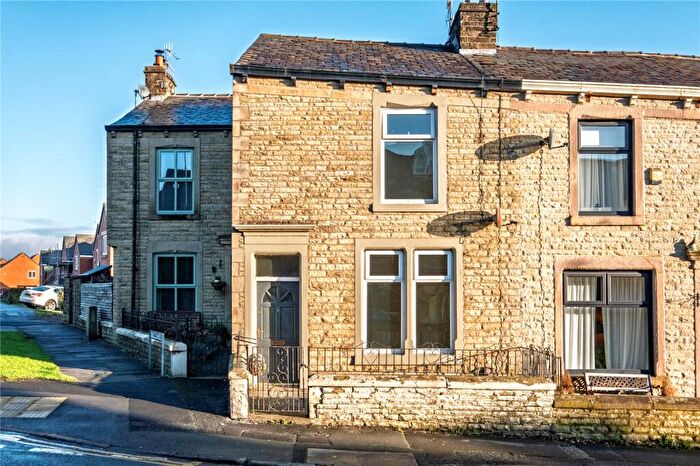
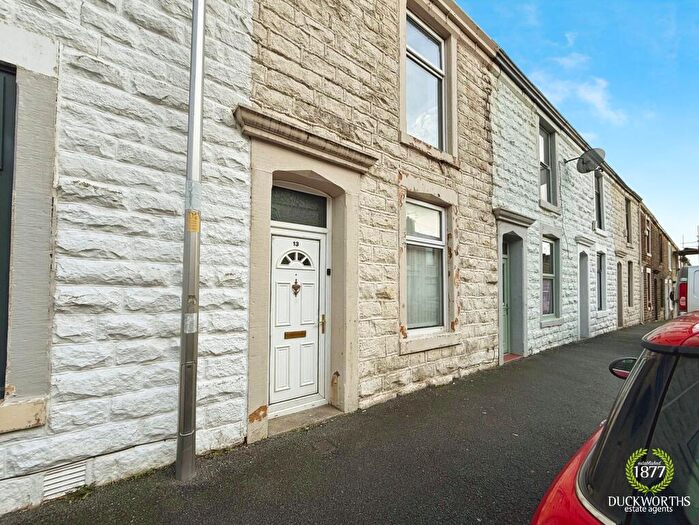
Houses for sale & to rent in St Oswalds, Accrington
House Prices in St Oswalds
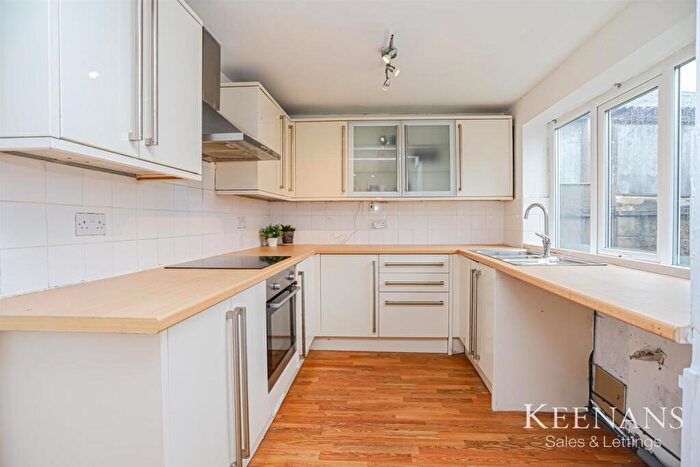
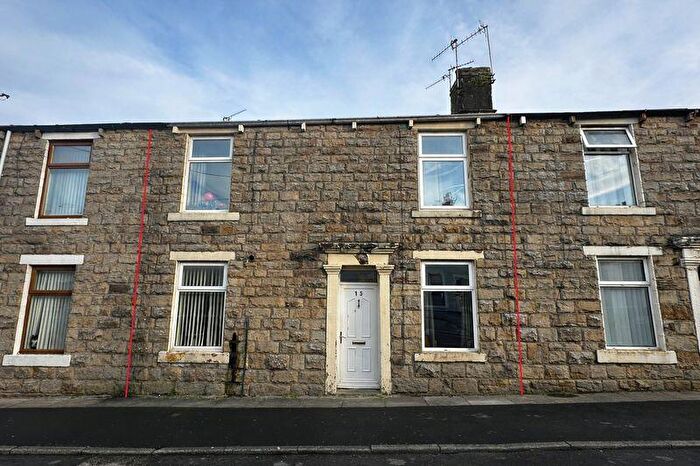
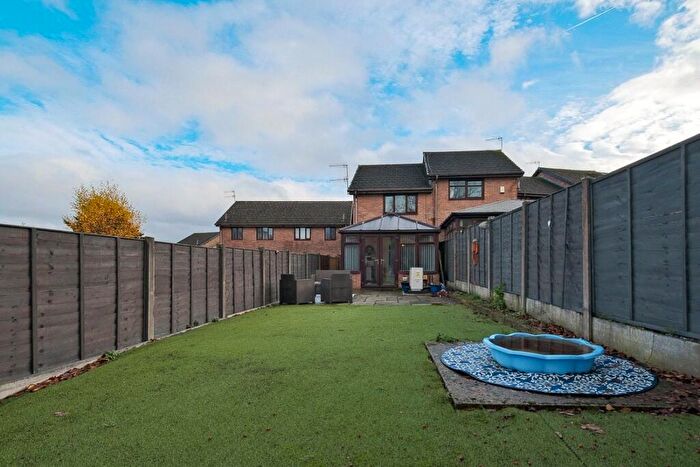
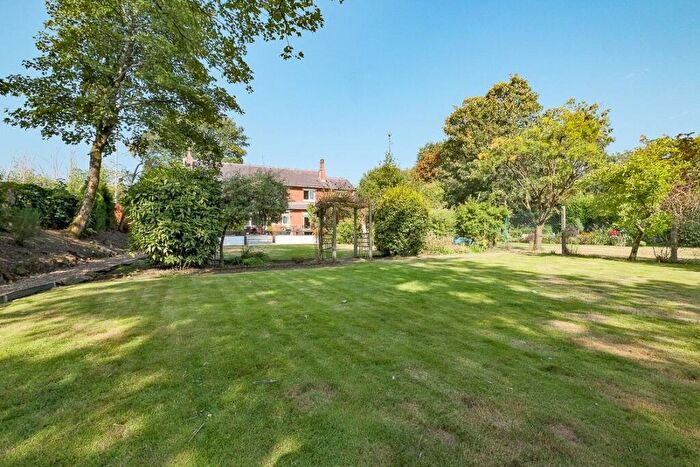
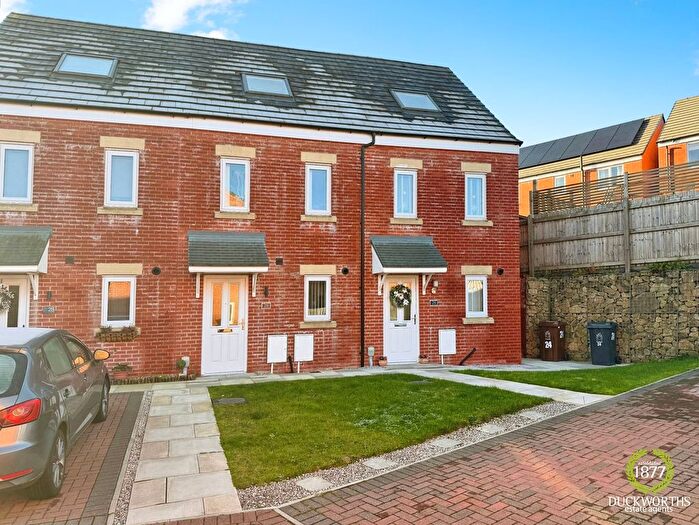
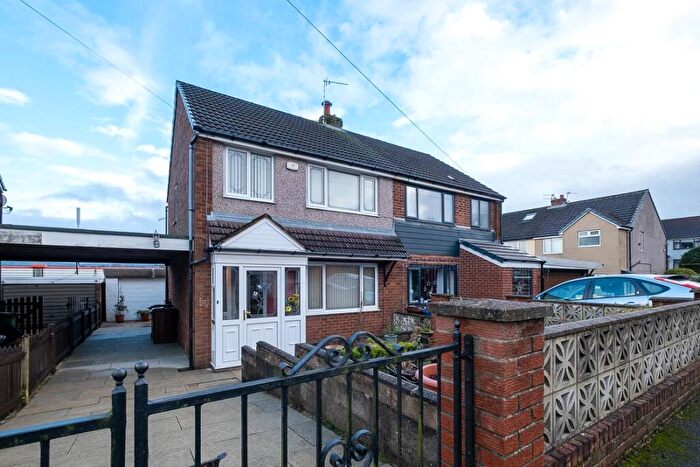
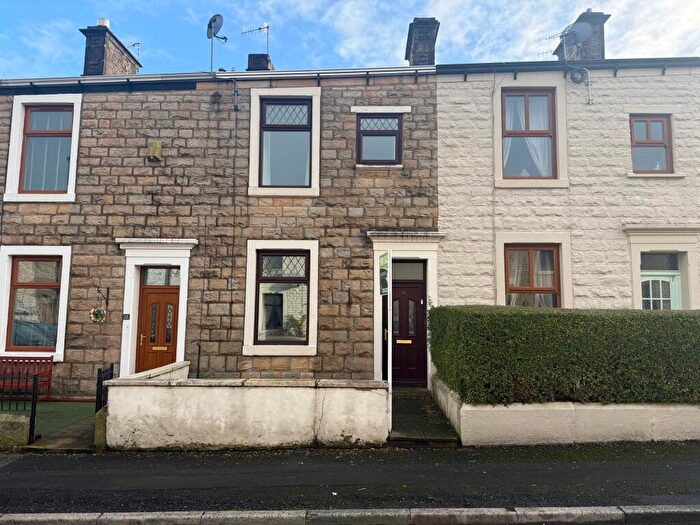
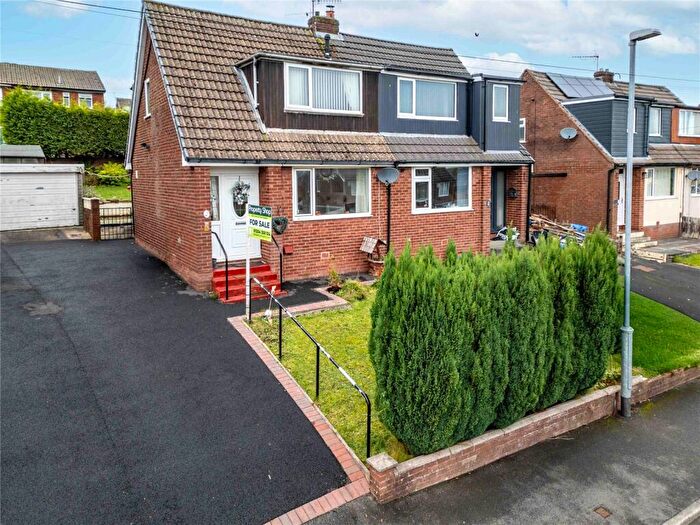
Properties in St Oswalds have an average house price of £171,441.16 and had 164 Property Transactions within the last 3 years¹.
St Oswalds is an area in Accrington, Lancashire with 1,559 households², where the most expensive property was sold for £390,000.00.
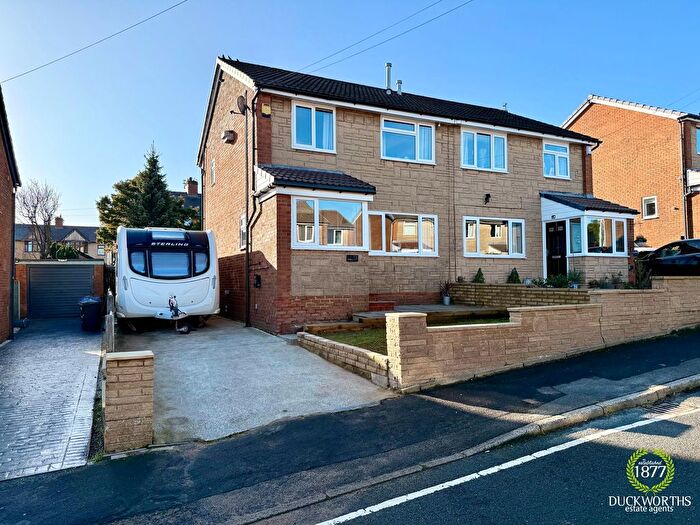
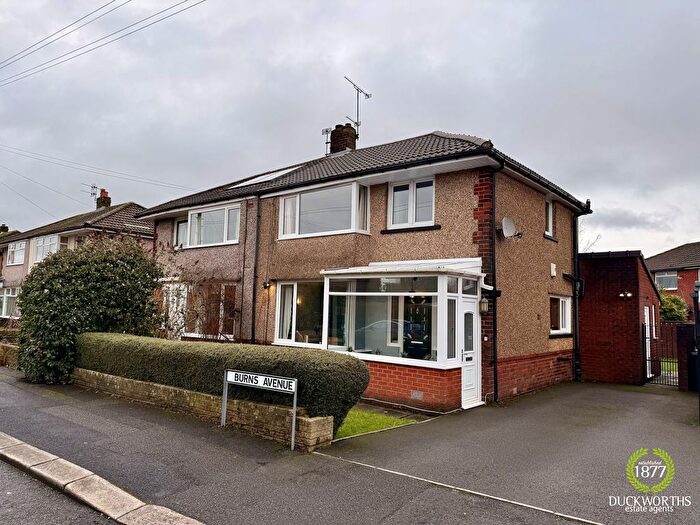
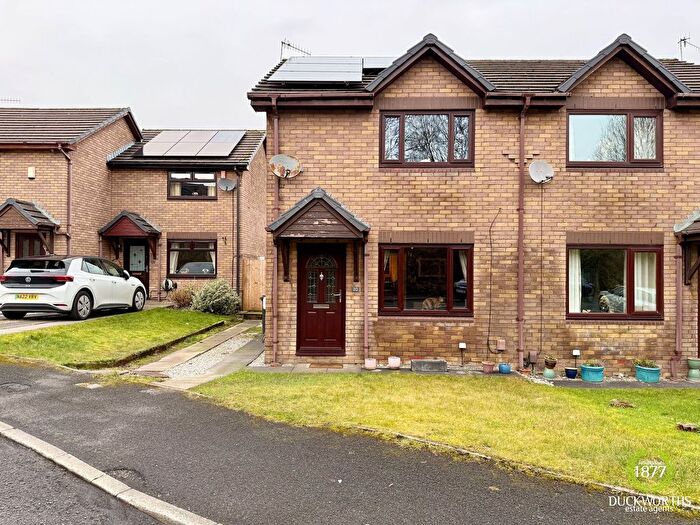
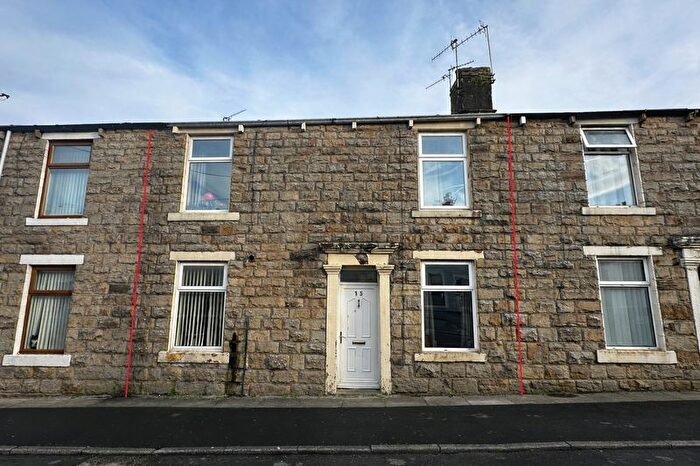
Properties for sale in St Oswalds
Previously listed properties in St Oswalds
Roads and Postcodes in St Oswalds
Navigate through our locations to find the location of your next house in St Oswalds, Accrington for sale or to rent.
| Streets | Postcodes |
|---|---|
| All Saints Close | BB5 4PY |
| Anglian Close | BB5 4ND |
| Aspen Fold | BB5 4PH |
| Aspen Lane | BB5 4NN BB5 4QA |
| Banbury Avenue | BB5 4NP |
| Barnard Close | BB5 4PX |
| Bedford Close | BB5 4QN |
| Blackburn Road | BB5 4LP BB5 4LZ BB5 4NA BB5 4NQ BB5 4LL |
| Bowdler Close | BB5 3DY |
| Brecon Avenue | BB5 4QS |
| Brookside Lane | BB5 3NY |
| Brookside Street | BB5 3PX |
| Brookside View | BB5 4SH |
| Calico Close | BB5 4SG |
| Cardigan Avenue | BB5 4QL |
| Central Avenue | BB5 4QJ |
| Clarence Street | BB5 3PF |
| Cobble Close | BB5 4RT |
| Conway Drive | BB5 4QH |
| Cranbrook Avenue | BB5 4NS |
| Devon Avenue | BB5 4LR |
| Dorchester Avenue | BB5 4NR |
| Duckworth Hill Lane | BB5 3RN |
| Dudley Avenue | BB5 4NU |
| Dunster Avenue | BB5 4NX |
| Eagle Street | BB5 3QT |
| Fountains Way | BB5 4NJ |
| Green Street | BB5 3QS |
| Greenfield Terrace | BB5 3RL |
| Hargreaves Road | BB5 4RN BB5 4RP |
| Harlech Drive | BB5 4NW BB5 4QW |
| Haslingden Old Road | BB5 3RG BB5 3RJ BB5 3DU |
| Lancaster Street | BB5 3PJ |
| London Smoke Cottage | BB5 3RF |
| Lower Aspen Lane | BB5 4NY |
| Margaret Street | BB5 3QU |
| Nab Lane | BB5 4PT |
| New Bury Close | BB5 4RJ |
| New Lane | BB5 3QW |
| Newton Street | BB5 4LX |
| Norman Road | BB5 4NF |
| Peel Bank Road | BB5 4PU |
| Percy Street | BB5 4LY |
| Radnor Close | BB5 4NT |
| Red Shell Lane | BB5 3RW |
| Ripon Road | BB5 4NG |
| Rushes Farm Close | BB5 4RL |
| Saxon Close | BB5 4NH |
| Spinning Mill Close | BB5 4AB |
| Spread Eagle Street | BB5 4NB |
| Springfield Terrace | BB5 3RQ |
| Stanhill Lane | BB5 4PZ BB5 4QB BB5 4QD |
| Stanhill Road | BB5 3RE BB5 4PP BB5 4PS |
| Stanhill Street | BB5 4QE |
| Sunnybank Drive | BB5 3QP |
| Thwaites Road | BB5 4QG BB5 4QT |
| Thwaites Street | BB5 3PL |
| Tower Street | BB5 4LU |
| Turnpike Grove | BB5 4NL |
| Union Road | BB5 3NS |
| Walkden Barn Cottages | BB5 3RH |
| West End Business Park | BB5 4WE BB5 4WZ |
| Wham Brook Close | BB5 4PB |
| Whewell Row | BB5 4NE |
| York Street | BB5 3NU |
Transport near St Oswalds
- FAQ
- Price Paid By Year
- Property Type Price
Frequently asked questions about St Oswalds
What is the average price for a property for sale in St Oswalds?
The average price for a property for sale in St Oswalds is £171,441. This amount is 26% higher than the average price in Accrington. There are 410 property listings for sale in St Oswalds.
What streets have the most expensive properties for sale in St Oswalds?
The streets with the most expensive properties for sale in St Oswalds are Spinning Mill Close at an average of £283,071, Calico Close at an average of £267,500 and Aspen Fold at an average of £236,250.
What streets have the most affordable properties for sale in St Oswalds?
The streets with the most affordable properties for sale in St Oswalds are Lancaster Street at an average of £77,000, Spread Eagle Street at an average of £91,125 and Springfield Terrace at an average of £100,000.
Which train stations are available in or near St Oswalds?
Some of the train stations available in or near St Oswalds are Church and Oswaldtwistle, Rishton and Accrington.
Property Price Paid in St Oswalds by Year
The average sold property price by year was:
| Year | Average Sold Price | Price Change |
Sold Properties
|
|---|---|---|---|
| 2025 | £164,991 | -4% |
48 Properties |
| 2024 | £170,896 | -4% |
60 Properties |
| 2023 | £177,552.68 | -2% |
56 Properties |
| 2022 | £180,668.33 | 11% |
93 Properties |
| 2021 | £161,508.82 | 19% |
85 Properties |
| 2020 | £130,487 | -13% |
56 Properties |
| 2019 | £147,801.45 | 1% |
69 Properties |
| 2018 | £145,610 | 10% |
62 Properties |
| 2017 | £131,716 | 5% |
73 Properties |
| 2016 | £124,709.68 | -10% |
62 Properties |
| 2015 | £137,306 | -8% |
47 Properties |
| 2014 | £148,316 | 14% |
68 Properties |
| 2013 | £127,845 | 9% |
51 Properties |
| 2012 | £116,444 | -11% |
37 Properties |
| 2011 | £129,304 | 5% |
29 Properties |
| 2010 | £123,416 | 3% |
46 Properties |
| 2009 | £119,485 | -7% |
28 Properties |
| 2008 | £128,398 | 1% |
41 Properties |
| 2007 | £126,959 | -16% |
78 Properties |
| 2006 | £147,809 | 23% |
102 Properties |
| 2005 | £114,542 | 8% |
71 Properties |
| 2004 | £105,737 | 26% |
84 Properties |
| 2003 | £78,148 | 7% |
73 Properties |
| 2002 | £72,874 | 23% |
98 Properties |
| 2001 | £55,830 | 15% |
99 Properties |
| 2000 | £47,515 | -0,1% |
83 Properties |
| 1999 | £47,546 | 1% |
74 Properties |
| 1998 | £47,276 | -15% |
71 Properties |
| 1997 | £54,603 | 8% |
104 Properties |
| 1996 | £50,248 | 7% |
108 Properties |
| 1995 | £46,763 | - |
62 Properties |
Property Price per Property Type in St Oswalds
Here you can find historic sold price data in order to help with your property search.
The average Property Paid Price for specific property types in the last three years are:
| Property Type | Average Sold Price | Sold Properties |
|---|---|---|
| Semi Detached House | £181,384.00 | 66 Semi Detached Houses |
| Detached House | £266,078.00 | 19 Detached Houses |
| Terraced House | £140,372.78 | 79 Terraced Houses |

