
Houses for sale in St Oswalds, Blackburn
House Prices in St Oswalds
Properties in St Oswalds have an average house price of £172k and had 128 Property Transactions within the last 3 years¹.
St Oswalds is an area in Blackburn, Lancashire with 1,036 households², where the most expensive property was sold for £600k.
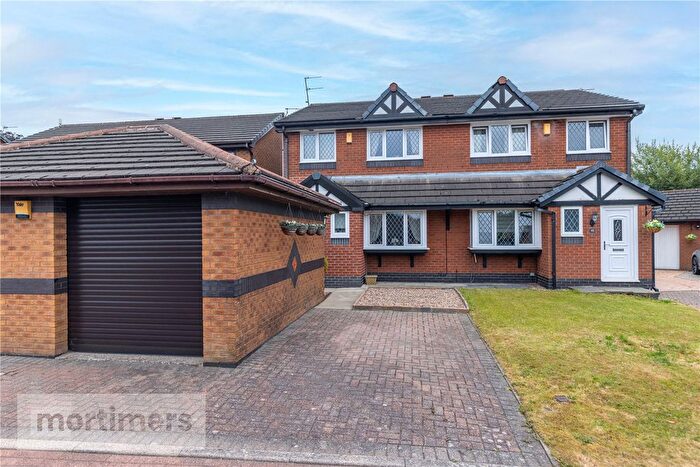
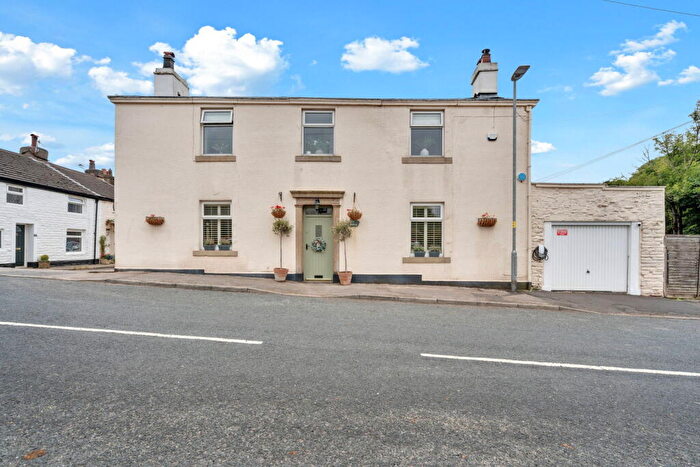
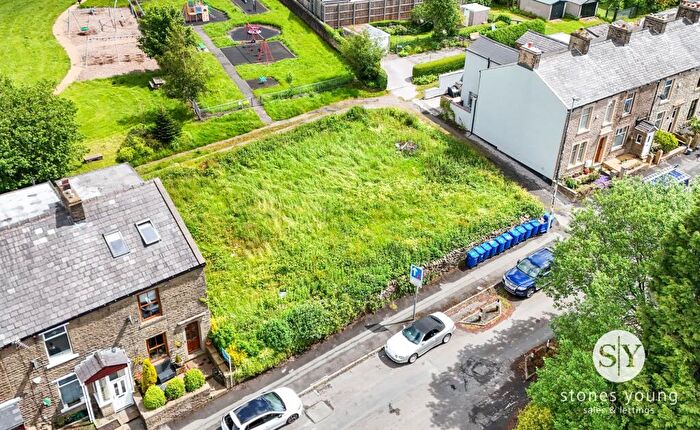
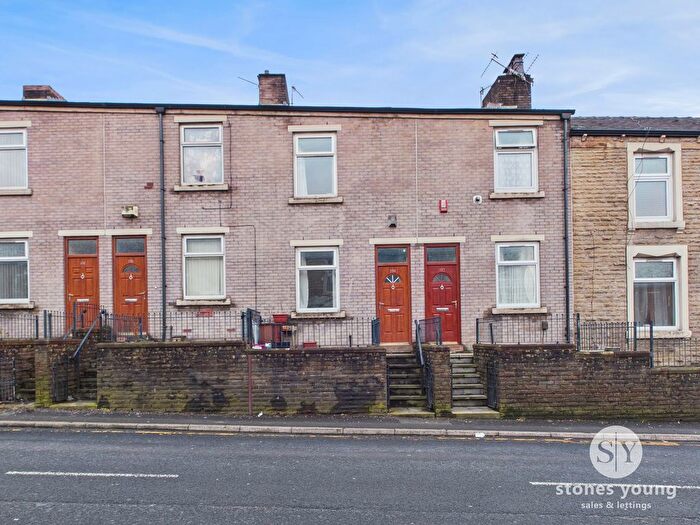
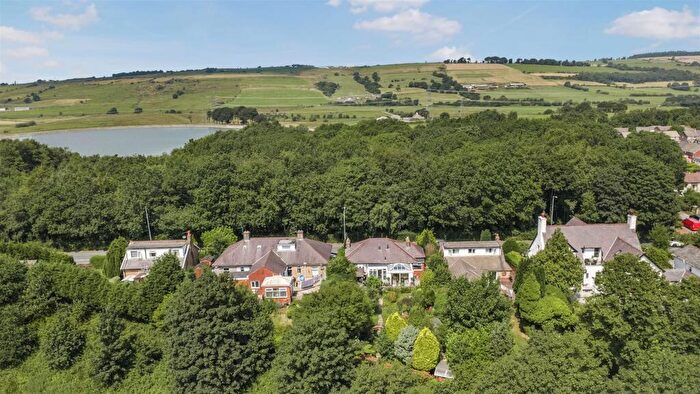
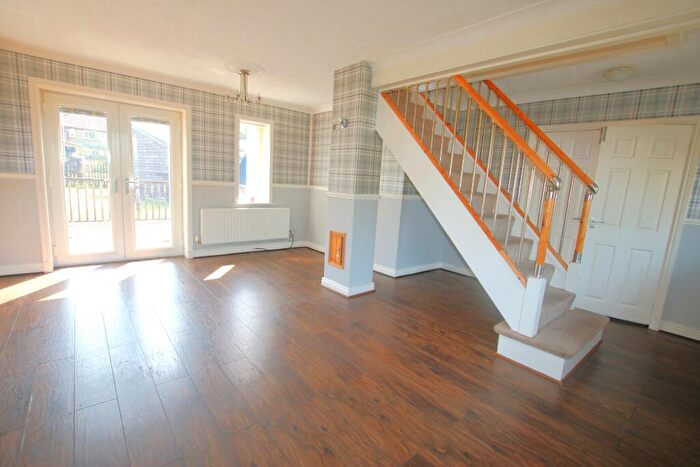
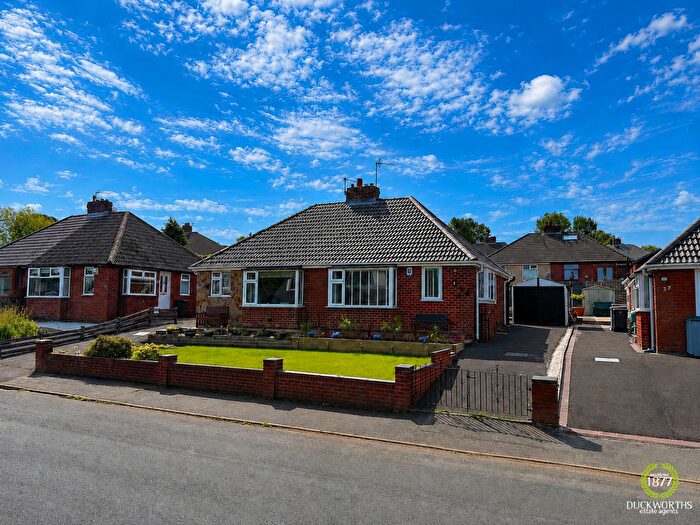
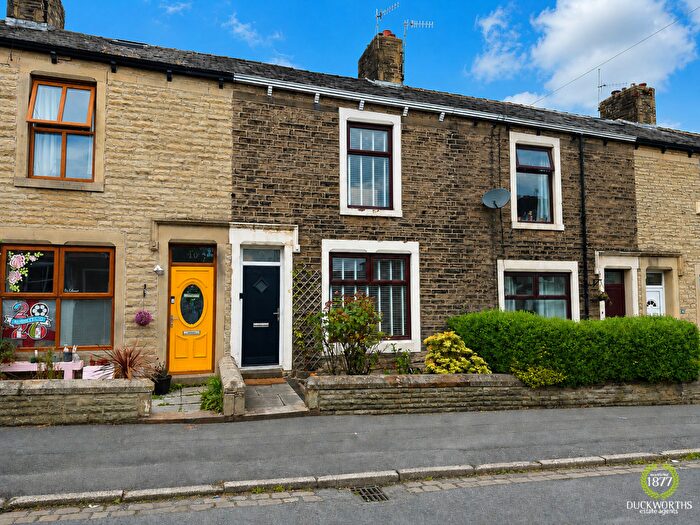
Properties for sale in St Oswalds
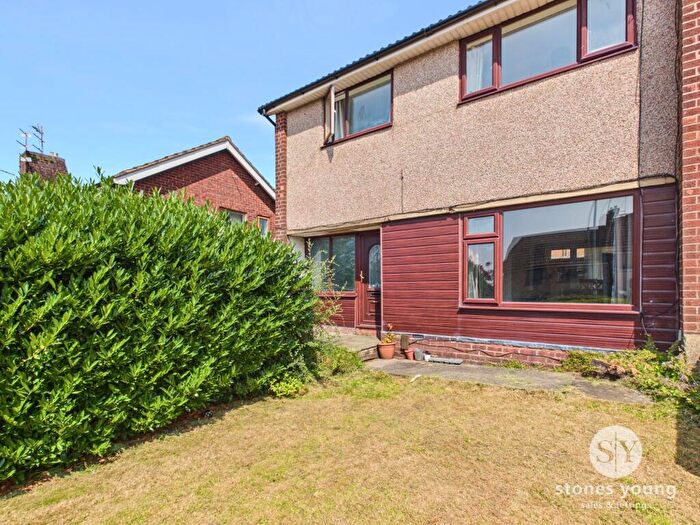


![]()
If you are looking to sell your house, let it out, or receive a property valuation, an expert can help you.
Click the button below to get started.


Roads and Postcodes in St Oswalds
Navigate through our locations to find the location of your next house in St Oswalds, Blackburn for sale or to rent.
| Streets | Postcodes |
|---|---|
| Abbott Clough Avenue | BB1 3LP |
| Abbott Clough Close | BB1 3LR |
| Avondale Avenue | BB1 3NA |
| Balmoral Crescent | BB1 3NG |
| Belthorn Road | BB1 2NN BB1 2PB BB1 2PE BB1 2PF |
| Blackburn Road | BB1 3NJ BB1 3LS |
| Brantwood Avenue | BB1 3LY BB1 3LZ |
| Cabin End Row | BB1 2DP |
| Cambridge Drive | BB1 2DG |
| Chapel Street | BB1 2NZ |
| Colliers Row | BB1 2LP |
| Cornwall Avenue | BB1 2DD |
| Dorset Drive | BB1 2DL |
| Elton Road | BB1 2PL |
| Garsden Avenue | BB1 2DZ |
| Hardman Close | BB1 2DT |
| Haslingden Old Road | BB1 2DY |
| Hazel Grove | BB1 3NB |
| Holden Street | BB1 2NU |
| James Street | BB1 2NX |
| Kendal Row | BB1 2PN |
| Kent Drive | BB1 2DN |
| Knuzden Brook | BB1 2EA |
| Lyndhurst Avenue | BB1 3NH BB1 3NQ |
| Mill Cottages | BB1 2DB |
| Moss Lane | BB1 2DX BB1 2FE |
| Mount St James | BB1 2DR |
| Oxford Drive | BB1 2DW |
| Peel Mount | BB1 2DU |
| Peel Mount Close | BB1 2DJ |
| Priory Close | BB1 3LW |
| Quarry View | BB1 2ED |
| Richmond Crescent | BB1 3LU |
| Rutland Avenue | BB1 2DF |
| Rydal Mount | BB1 2PP |
| Seven Houses | BB1 2DE |
| Sough Lane | BB1 2LR BB1 2PJ |
| St Oswalds Close | BB1 2BY |
| St Oswalds Road | BB1 2DS |
| Tower View | BB1 2PD |
| Waverley Road | BB1 3ND |
| Windsor Road | BB1 2DH BB1 2DQ BB1 3LX |
Property price trends in St Oswalds
According to the latest Land Registry data, the average home in St Oswalds sold for £171,250 in 2026. That figure comes from 1,366 sales logged over the past 31 years.
Prices have moved up over the last three years. Compared with 2023, when the typical sale came in around £164,915, that's a rise of roughly 3.8%.
Looking back five years, average prices are up about 18.6% since 2021, a gain of around £26,804 in cash terms.
Zoom out to the past decade for the fuller picture. Back in 2016, homes here averaged £118,742, so the typical sold price has climbed about 44.2% since then, roughly 3.7% a year. Stretch the view to fifteen years and that annual pace eases back to about 3.3%.
Frequently asked questions about St Oswalds
What is the average price for a property for sale in St Oswalds?
The average price for a property for sale in St Oswalds is £171,576. This amount is 21% lower than the average price in Blackburn. There are 838 property listings for sale in St Oswalds.
What streets have the most expensive properties for sale in St Oswalds?
The streets with the most expensive properties for sale in St Oswalds are Garsden Avenue at an average of £420,000, Haslingden Old Road at an average of £250,000 and Blackburn Road at an average of £246,000.
What streets have the most affordable properties for sale in St Oswalds?
The streets with the most affordable properties for sale in St Oswalds are Knuzden Brook at an average of £75,000, Cabin End Row at an average of £114,625 and Waverley Road at an average of £126,714.
Which train stations are available in or near St Oswalds?
Some of the train stations available in or near St Oswalds are Rishton, Blackburn and Church and Oswaldtwistle.
Property Price Paid in St Oswalds by Year
The average sold property price by year was:
| Year | Average Sold Price | Price Change |
Sold Properties
|
|---|---|---|---|
| 2026 | £171,250 | -3% |
2 Properties |
| 2025 | £176,321 | 1% |
38 Properties |
| 2024 | £173,750 | 5% |
46 Properties |
| 2023 | £164,915 | 10% |
42 Properties |
| 2022 | £148,719 | 3% |
48 Properties |
| 2021 | £144,446 | 9% |
49 Properties |
| 2020 | £130,988 | 6% |
42 Properties |
| 2019 | £122,685 | 5% |
53 Properties |
| 2018 | £116,265 | -5% |
41 Properties |
| 2017 | £121,876 | 3% |
47 Properties |
Property Price per Property Type in St Oswalds
Here you can find historic sold price data in order to help with your property search.
The average Property Paid Price for specific property types in the last three years are:
| Property Type | Average Sold Price | Sold Properties |
|---|---|---|
| Semi Detached House | £165,033.00 | 92 Semi Detached Houses |
| Detached House | £292,166.00 | 9 Detached Houses |
| Terraced House | £153,671.00 | 27 Terraced Houses |
