
Houses for sale in BB2 7JS, Stoops Fold, Mellor, Blackburn
House Prices in BB2 7JS, Stoops Fold, Mellor
Properties in BB2 7JS have no sales history available within the last 3 years. BB2 7JS is a postcode in Stoops Fold located in Mellor, an area in Blackburn, Lancashire, with 4 households².
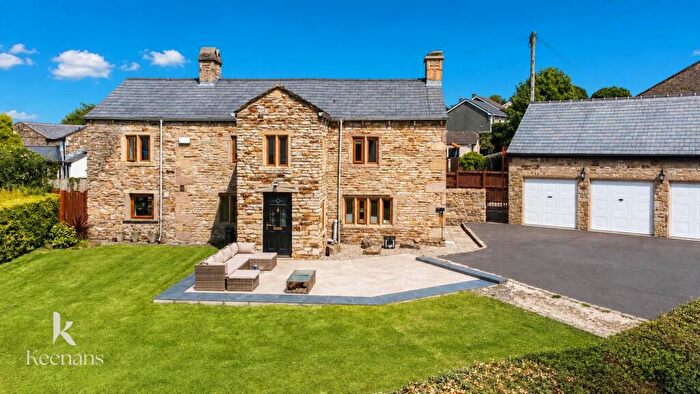
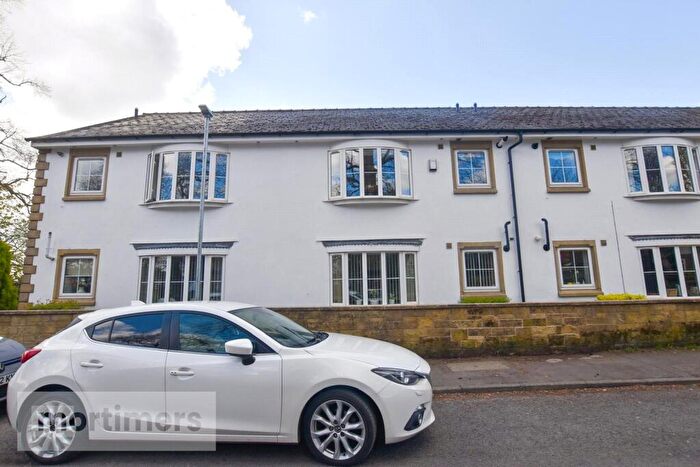
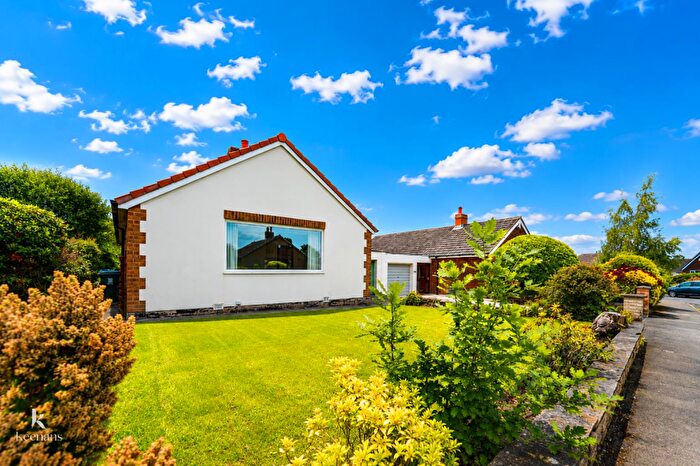
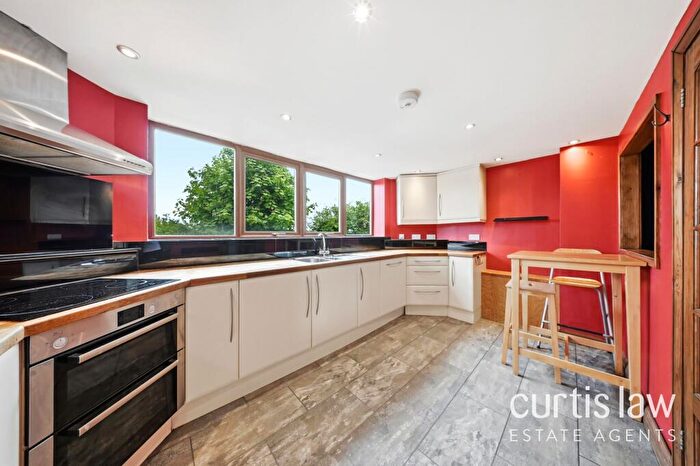
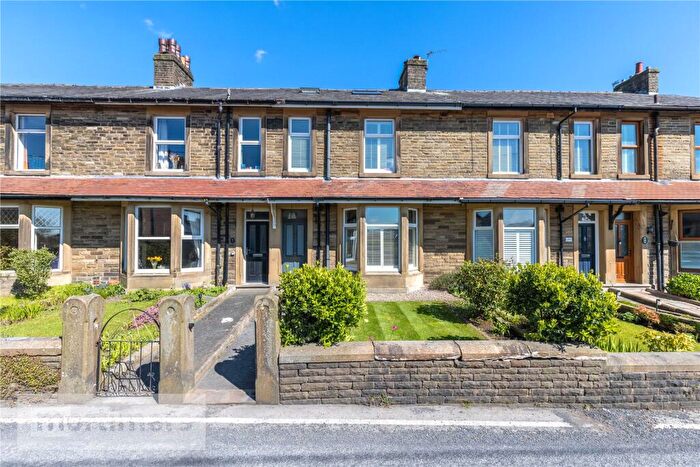
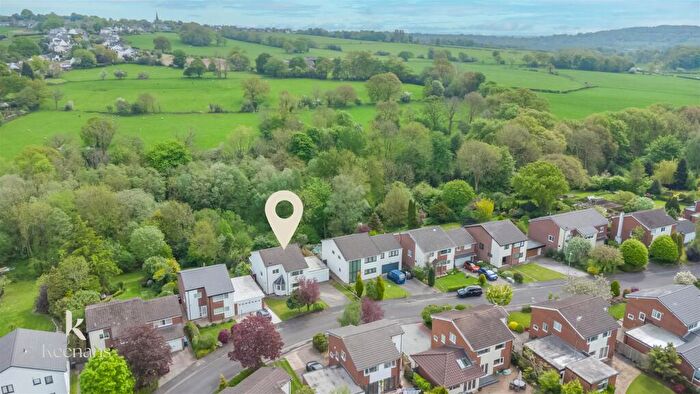
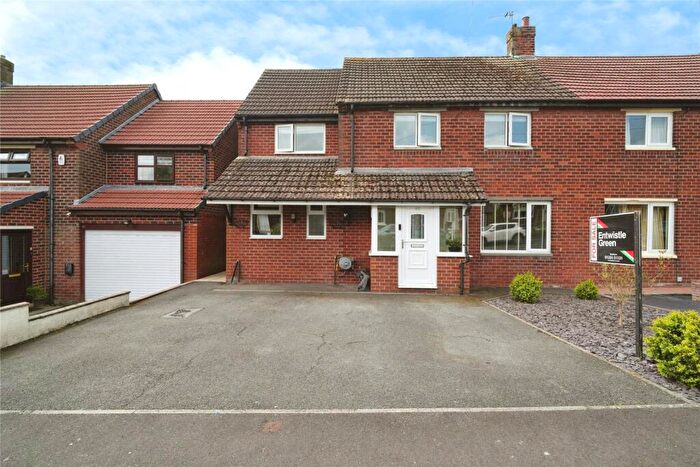
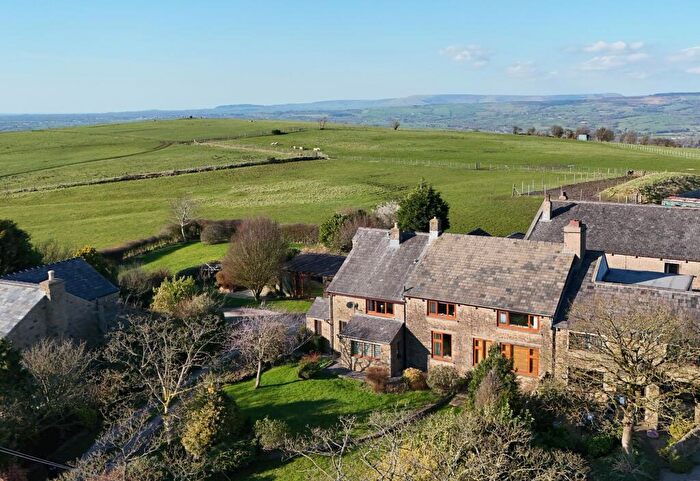
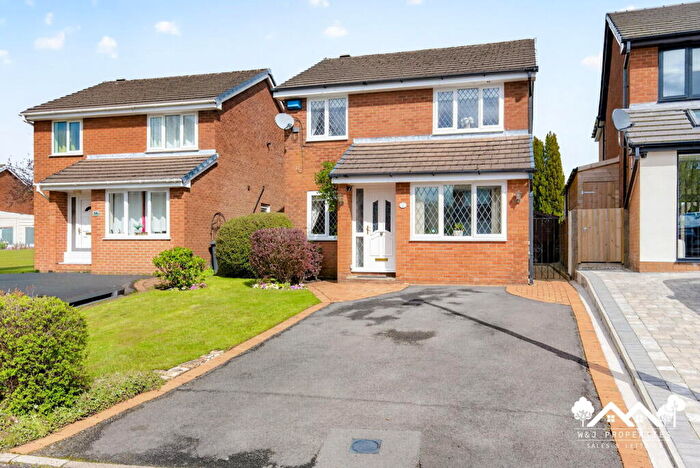
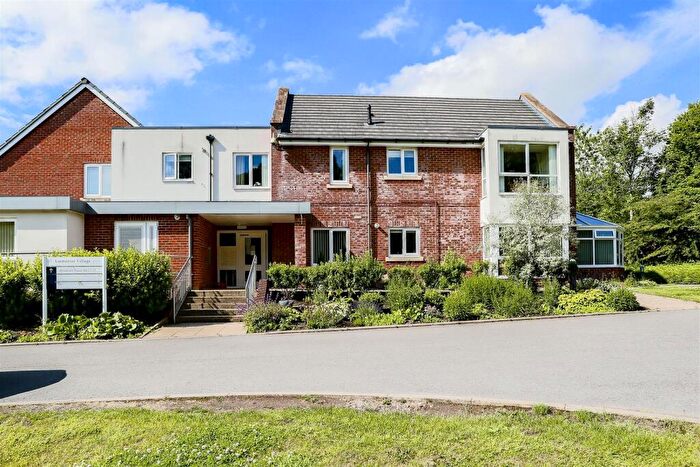
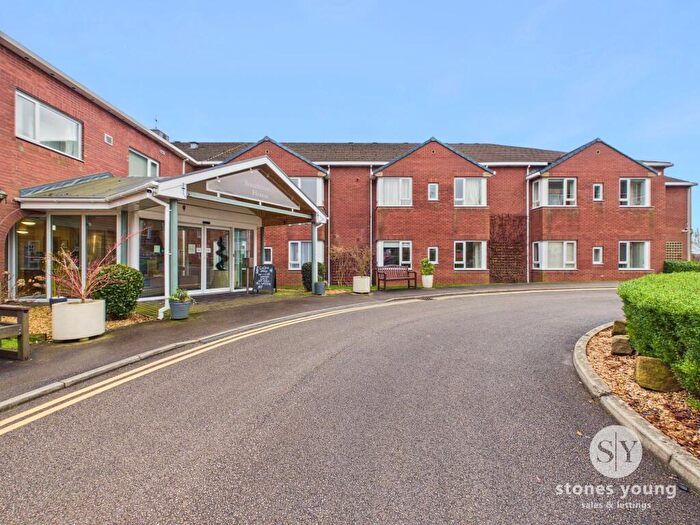
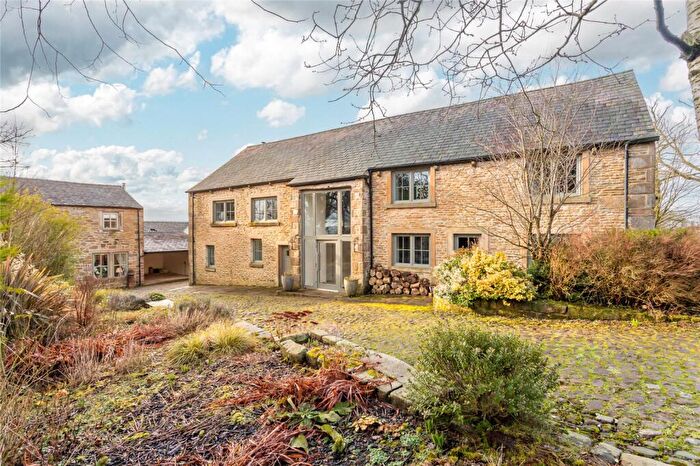
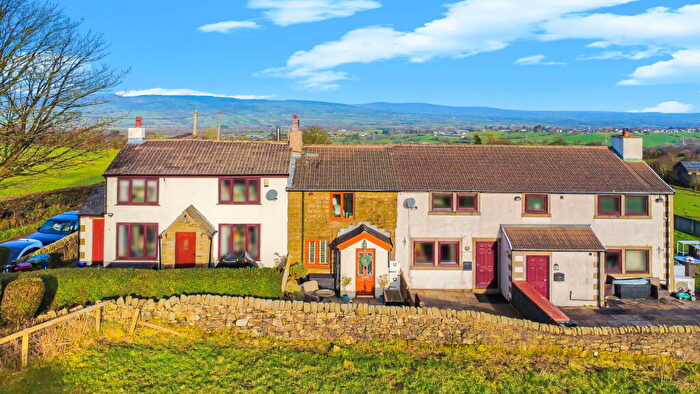
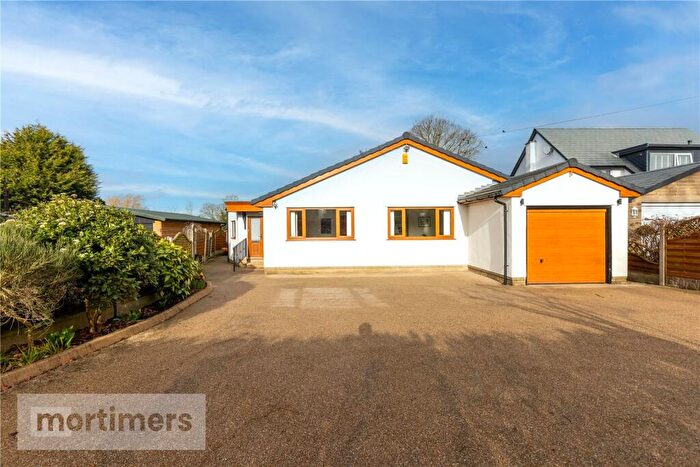
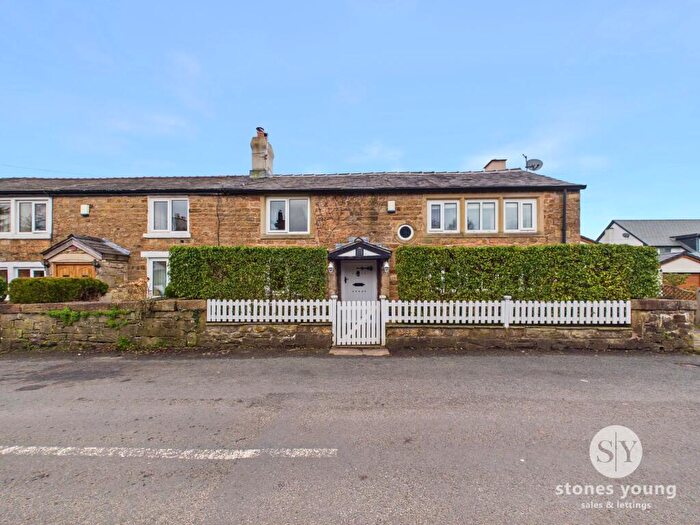
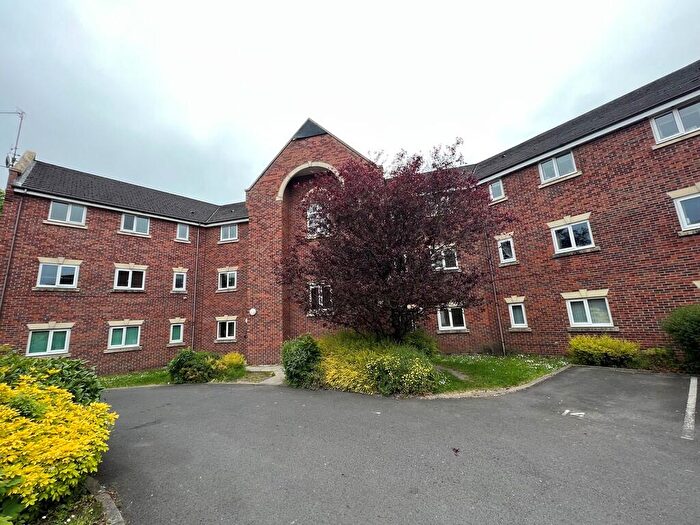
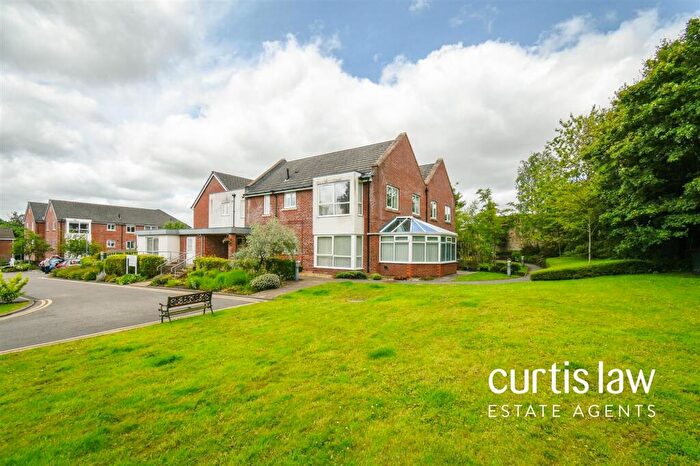
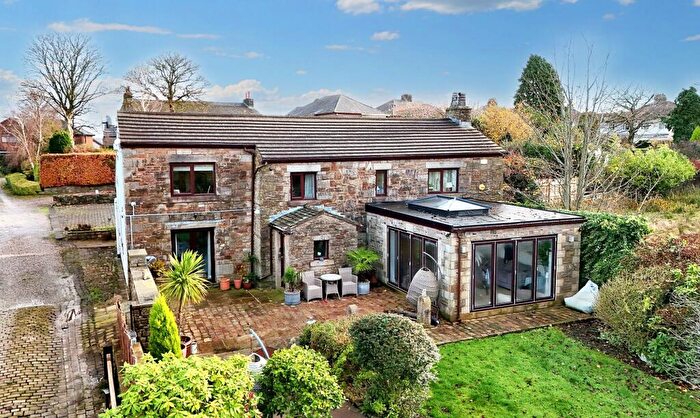
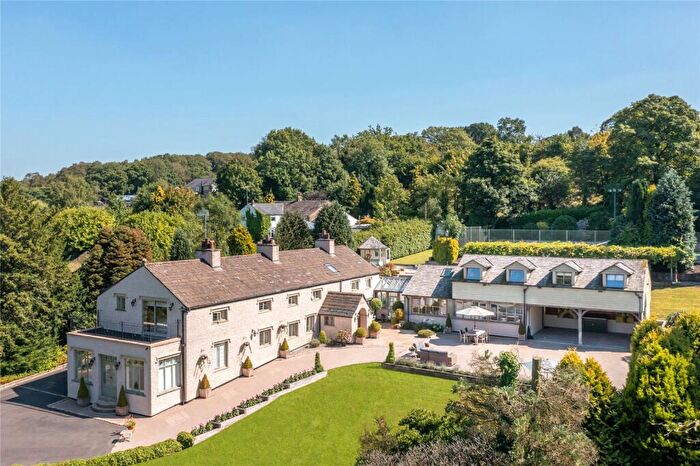
Properties for sale near BB2 7JS, Stoops Fold
![]()
If you are looking to sell your house, let it out, or receive a property valuation, an expert can help you.
Click the button below to get started.

Price Paid in Stoops Fold, BB2 7JS, Mellor
1 Stoops Fold, BB2 7JS, Mellor Blackburn
Property 1 has been sold 3 times. The last time it was sold was in 25/02/2022 and the sold price was £250,000.00.
This semi detached house, sold as a leasehold on 25/02/2022, is a 79 sqm semi-detached house with an EPC rating of D.
| Date | Price | Property Type | Tenure | Classification |
|---|---|---|---|---|
| 25/02/2022 | £250,000.00 | Semi Detached House | leasehold | Established Building |
| 05/07/2001 | £117,000.00 | Semi Detached House | leasehold | Established Building |
| 16/08/1996 | £64,000.00 | Semi Detached House | leasehold | Established Building |
JENNEY SPRING Stoops Fold, BB2 7JS, Mellor Blackburn
Property JENNEY SPRING has been sold 1 time. The last time it was sold was in 12/12/2002 and the sold price was £290,600.00.
This is a Detached House which was sold as a freehold in 12/12/2002
| Date | Price | Property Type | Tenure | Classification |
|---|---|---|---|---|
| 12/12/2002 | £290,600.00 | Detached House | freehold | Established Building |
2 Stoops Fold Mellor, BB2 7JS, Mellor Blackburn
This is a 70 square meter Semi-detached House with an EPC rating of E. Currently, there is no transaction history available for this property.
Property price trends in BB2 7JS, Stoops Fold
According to the latest Land Registry data, the average home in BB2 7JS, Stoops Fold sold for £250,000 in 2022. That figure comes from 4 sales logged over the past 26 years.
Property Price Paid in BB2 7JS, Stoops Fold by Year
The average sold property price by year was:
| Year | Average Sold Price | Price Change |
Sold Properties
|
|---|---|---|---|
| 2022 | £250,000 | -16% |
1 Property |
| 2002 | £290,600 | 60% |
1 Property |
| 2001 | £117,000 | 45% |
1 Property |
| 1996 | £64,000 | - |
1 Property |
