Houses for sale & to rent in Mellor, Blackburn
House Prices in Mellor
Properties in Mellor have an average house price of £358,506.00 and had 118 Property Transactions within the last 3 years¹.
Mellor is an area in Blackburn, Lancashire with 1,231 households², where the most expensive property was sold for £1,540,000.00.
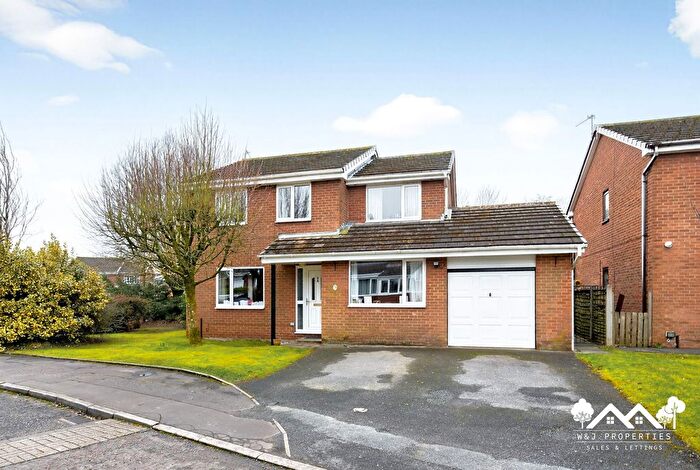
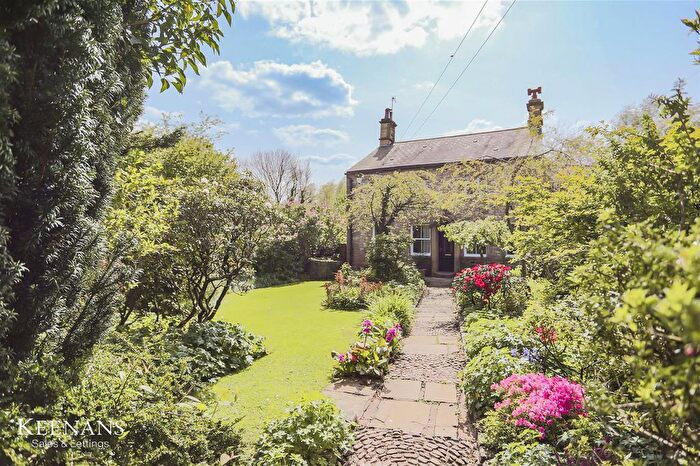
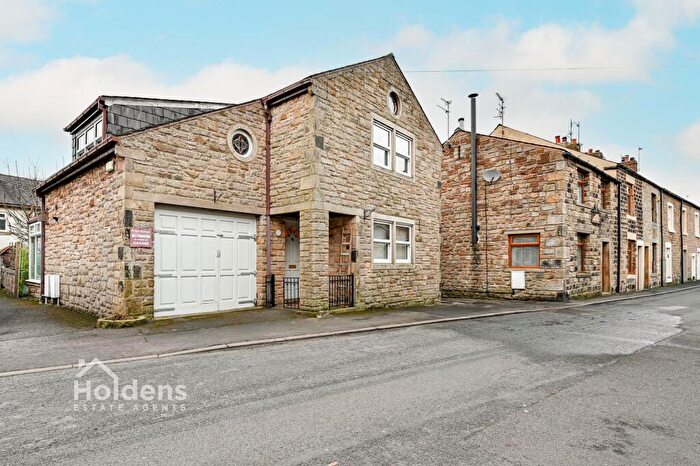
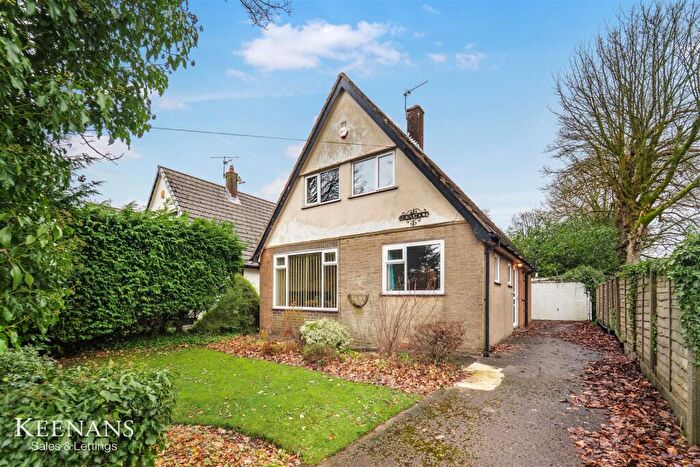
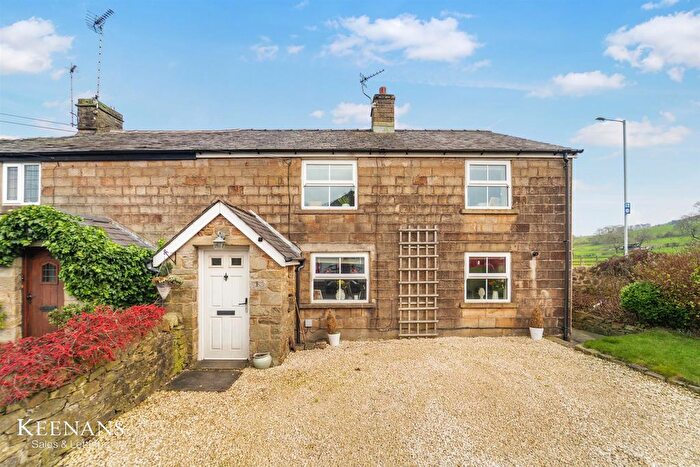
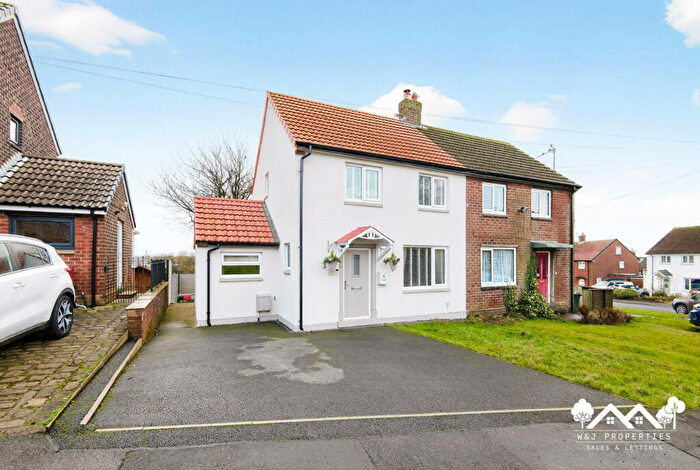
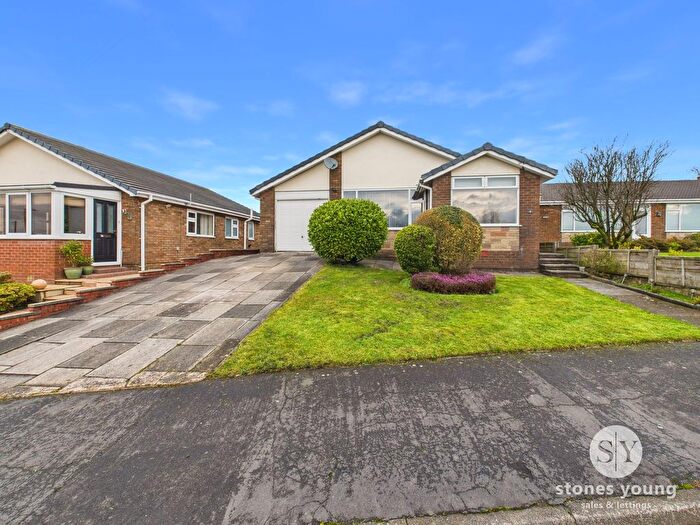
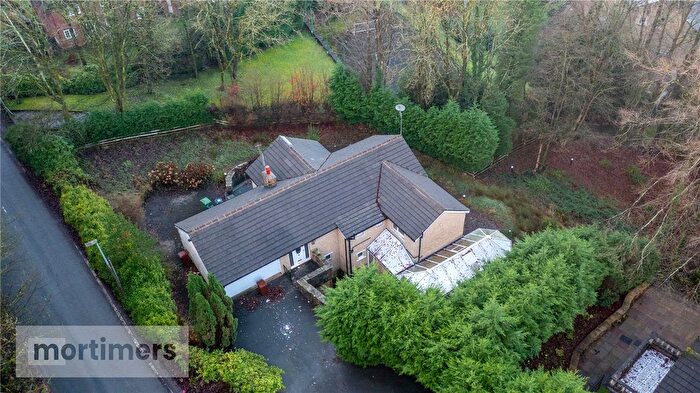
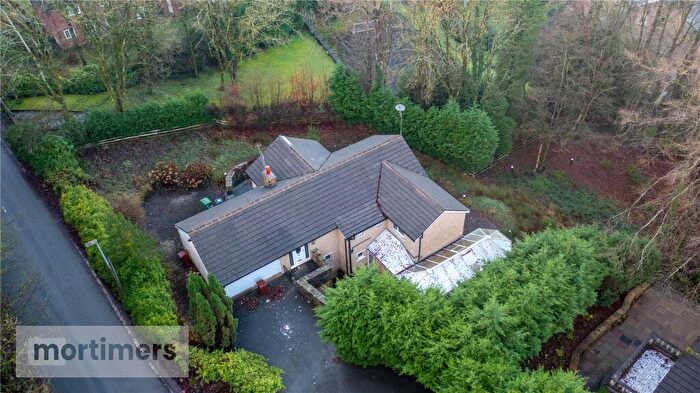
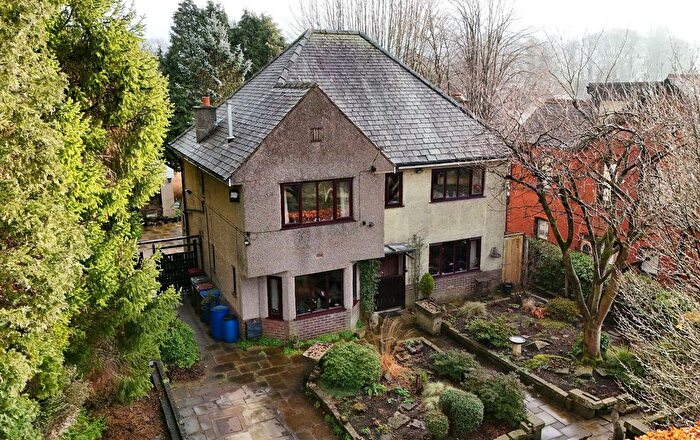
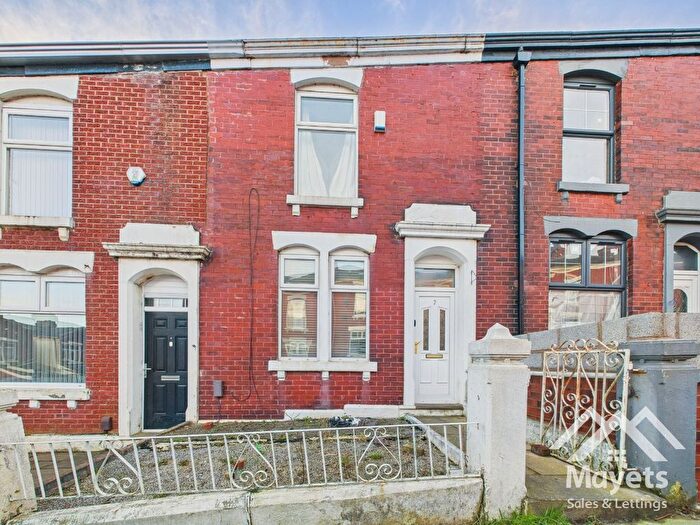
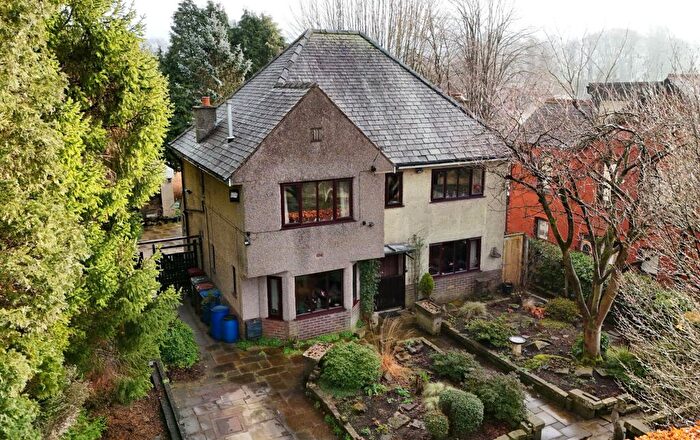
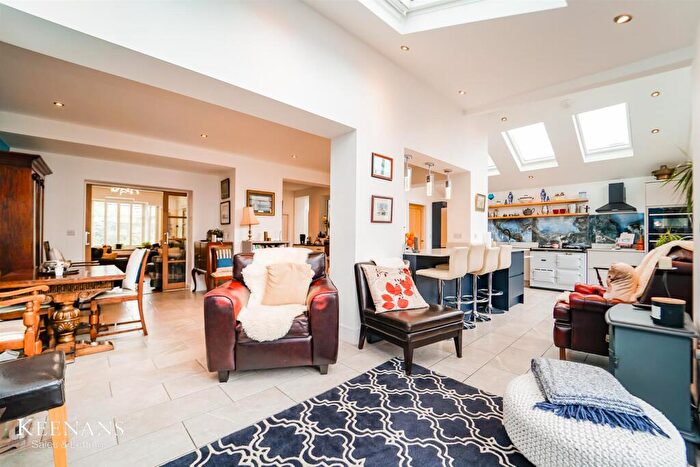
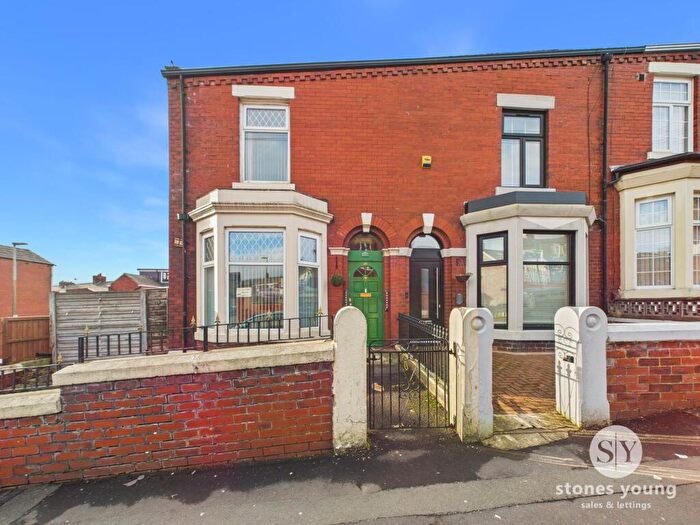
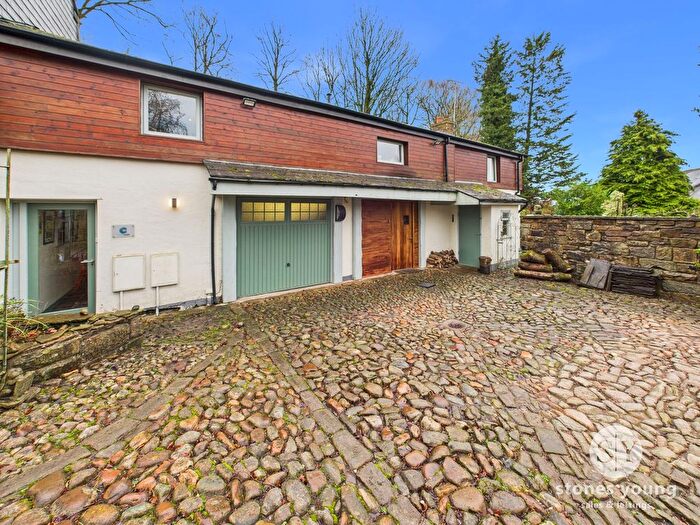
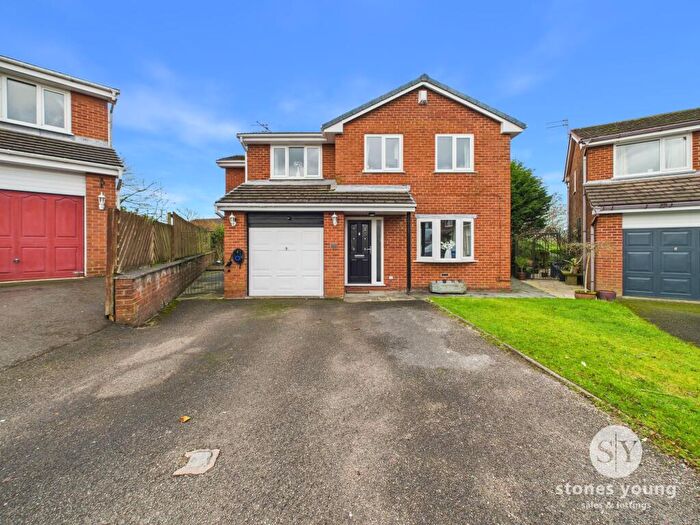
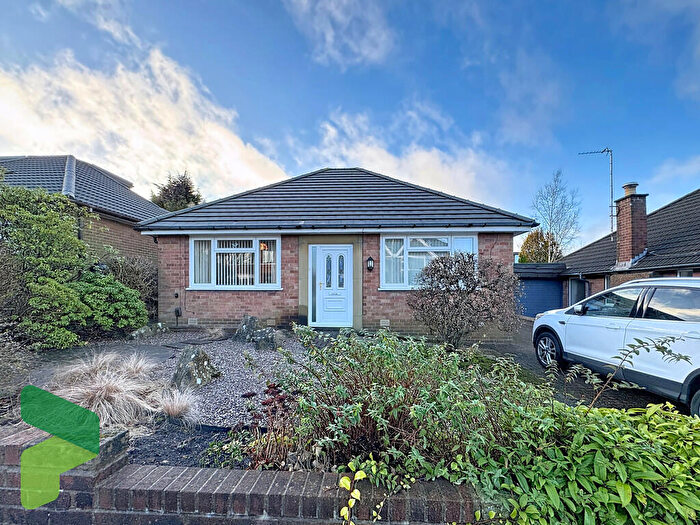
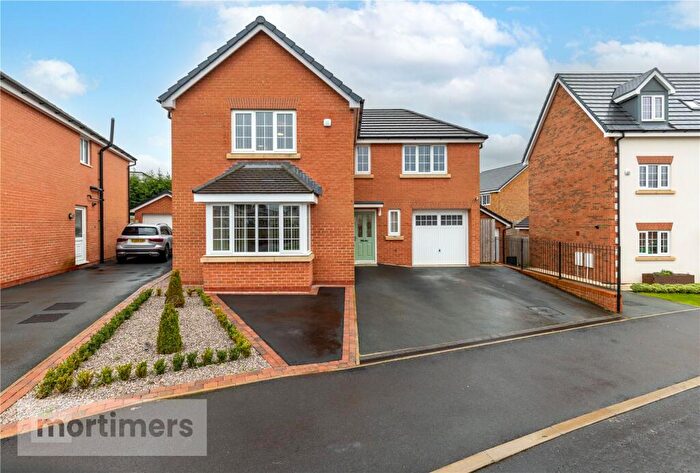
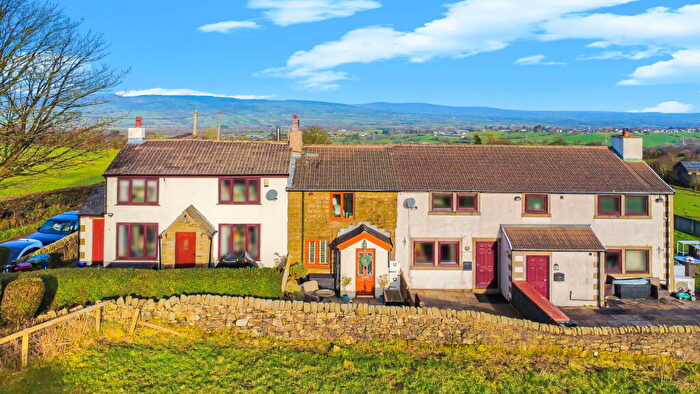
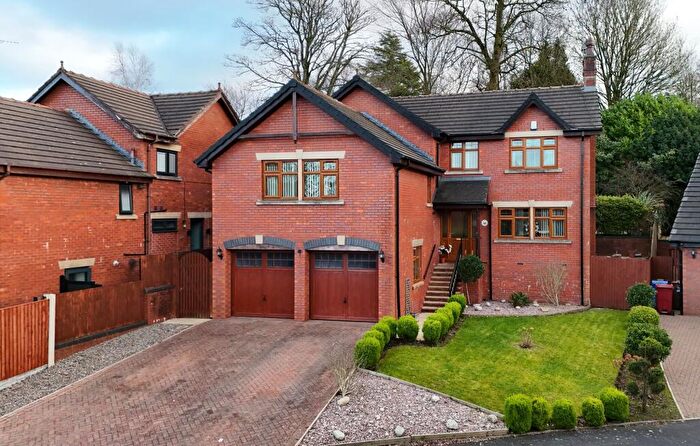
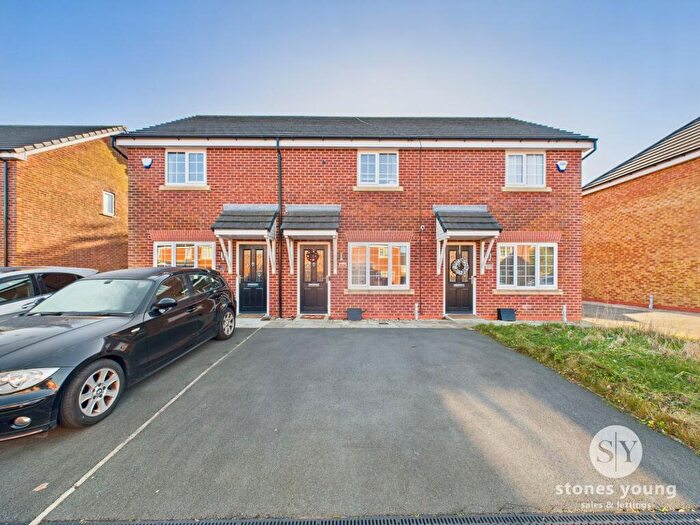
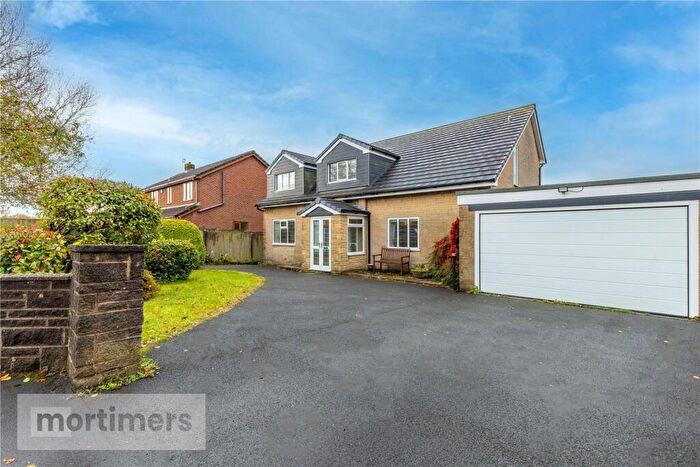
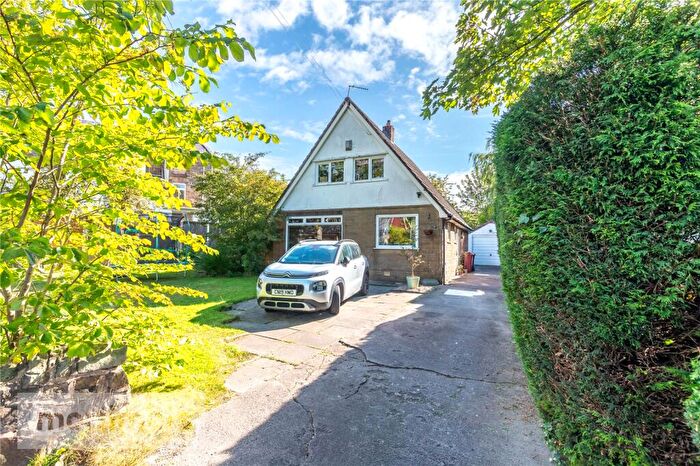
Properties for sale in Mellor
Roads and Postcodes in Mellor
Navigate through our locations to find the location of your next house in Mellor, Blackburn for sale or to rent.
| Streets | Postcodes |
|---|---|
| Abbott Brow | BB2 7HT BB2 7HU BB2 7HL |
| Aintree Cottages | BB2 7PP |
| Arley Rise | BB2 7EU |
| Balderstone Hall Lane | BB2 7LA |
| Barker Lane | BB2 7EE |
| Bezza Lane | BB2 7LQ |
| Bosburn Drive | BB2 7PA |
| Bowfields Lane | BB2 7LD BB2 7LW |
| Branch Road | BB2 7NU BB2 7NY |
| Broadtree Close | BB2 7PW |
| Brookfield | BB2 7JN |
| Brundhurst Fold | BB2 7JT |
| Carr Lane | BB2 7LN |
| Carter Fold | BB2 7ER |
| Church Close | BB2 7JU |
| Church Lane | BB2 7EY BB2 7JL |
| Commons Lane | BB2 7LL BB2 7LP |
| Elswick Gardens | BB2 7JD |
| Elswick Lodge | BB2 7RX |
| Fieldens Farm Lane | BB2 7PD |
| Four Acre | BB2 7ES |
| Further Lane | BB2 7QB BB2 7PZ |
| Glendale Drive | BB2 7HB BB2 7HD |
| Higher Commons Lane | BB2 7LR BB2 7PS |
| Hob Green | BB2 7EP |
| Jacksons Bank Road | BB2 7LH |
| Long Row | BB2 7EF |
| Longsight Road | BB2 7HZ |
| Mellor Brook | BB2 7PH |
| Mellor Brow | BB2 7EX BB2 7PN BB2 7QF |
| Mellor Lane | BB2 7EG BB2 7EN BB2 7EW BB2 7JR |
| Mire Ash Brow | BB2 7EZ |
| Myerscough Road | BB2 7LB BB2 7LF |
| Myerscough Smithy Road | BB2 7LE |
| Nickey Lane | BB2 7HF |
| Nightfield Lane | BB2 7LJ |
| Petter Court | BB2 7FS |
| Preston New Road | BB2 7NP BB2 7NR |
| Primrose Hill | BB2 7EQ |
| Primrose Lane | BB1 9DN |
| Proctor Fold | BB2 7LU |
| Roy Chadwick Way | BB2 7HP |
| Saccary Lane | BB1 9DL BB1 9DW |
| St Marys Court | BB2 7JE |
| St Marys Gardens | BB2 7JP BB2 7JW |
| Stanley Gate | BB2 7ET |
| Stoops Fold | BB2 7JS |
| The Opening | BB2 7PJ |
| The Willows | BB2 7PX |
| Victoria Terrace | BB2 7PL |
| Weavers Fold | BB2 7FR |
| Whalley Road | BB2 7PR BB2 7HY |
| Whinney Lane | BB2 7EH BB2 7EL |
| Whitecroft Lane | BB2 7HA BB2 7HE |
| Woodfold Close | BB2 7NZ |
| Woodfold Park | BB2 7QA |
| Woods Brow | BB2 7LG |
| Yerburgh Road | BB2 7JJ |
Transport near Mellor
-
Ramsgreave and Wilpshire Station
-
Cherry Tree Station
-
Pleasington Station
-
Mill Hill (Lancashire) Station
-
Blackburn Station
-
Langho Station
-
Rishton Station
- FAQ
- Price Paid By Year
- Property Type Price
Frequently asked questions about Mellor
What is the average price for a property for sale in Mellor?
The average price for a property for sale in Mellor is £358,506. This amount is 66% higher than the average price in Blackburn. There are 966 property listings for sale in Mellor.
What streets have the most expensive properties for sale in Mellor?
The streets with the most expensive properties for sale in Mellor are Longsight Road at an average of £1,150,000, Higher Commons Lane at an average of £895,000 and Saccary Lane at an average of £860,000.
What streets have the most affordable properties for sale in Mellor?
The streets with the most affordable properties for sale in Mellor are Weavers Fold at an average of £150,000, St Marys Court at an average of £151,666 and Mellor Brook at an average of £152,375.
Which train stations are available in or near Mellor?
Some of the train stations available in or near Mellor are Ramsgreave and Wilpshire, Cherry Tree and Pleasington.
Property Price Paid in Mellor by Year
The average sold property price by year was:
| Year | Average Sold Price | Price Change |
Sold Properties
|
|---|---|---|---|
| 2025 | £395,541 | 14% |
36 Properties |
| 2024 | £338,508 | -2% |
45 Properties |
| 2023 | £346,793 | 9% |
37 Properties |
| 2022 | £317,023 | -5% |
39 Properties |
| 2021 | £334,100 | 14% |
73 Properties |
| 2020 | £288,664 | 9% |
50 Properties |
| 2019 | £261,898 | -19% |
55 Properties |
| 2018 | £312,483 | 14% |
36 Properties |
| 2017 | £268,334 | 9% |
54 Properties |
| 2016 | £243,661 | -4% |
31 Properties |
| 2015 | £253,985 | 2% |
37 Properties |
| 2014 | £249,514 | 1% |
44 Properties |
| 2013 | £247,551 | 20% |
37 Properties |
| 2012 | £197,307 | -31% |
21 Properties |
| 2011 | £257,518 | 17% |
22 Properties |
| 2010 | £214,250 | 18% |
29 Properties |
| 2009 | £176,717 | -83% |
32 Properties |
| 2008 | £324,113 | 16% |
26 Properties |
| 2007 | £271,618 | -1% |
56 Properties |
| 2006 | £275,471 | 20% |
57 Properties |
| 2005 | £219,064 | -4% |
41 Properties |
| 2004 | £228,632 | 31% |
64 Properties |
| 2003 | £157,022 | 16% |
54 Properties |
| 2002 | £131,480 | 6% |
77 Properties |
| 2001 | £122,970 | 22% |
62 Properties |
| 2000 | £95,782 | -4% |
70 Properties |
| 1999 | £99,947 | 6% |
67 Properties |
| 1998 | £93,937 | 17% |
32 Properties |
| 1997 | £77,552 | -10% |
71 Properties |
| 1996 | £85,451 | 7% |
36 Properties |
| 1995 | £79,312 | - |
32 Properties |
Property Price per Property Type in Mellor
Here you can find historic sold price data in order to help with your property search.
The average Property Paid Price for specific property types in the last three years are:
| Property Type | Average Sold Price | Sold Properties |
|---|---|---|
| Semi Detached House | £267,467.00 | 31 Semi Detached Houses |
| Detached House | £489,272.00 | 53 Detached Houses |
| Terraced House | £246,342.00 | 26 Terraced Houses |
| Flat | £209,493.00 | 8 Flats |

