
Houses for sale in BB6 7UJ, Martholme Lane, Netherton, Blackburn
House Prices in BB6 7UJ, Martholme Lane, Netherton
Properties in BB6 7UJ have no sales history available within the last 3 years. BB6 7UJ is a postcode in Martholme Lane located in Netherton, an area in Blackburn, Lancashire, with 15 households².
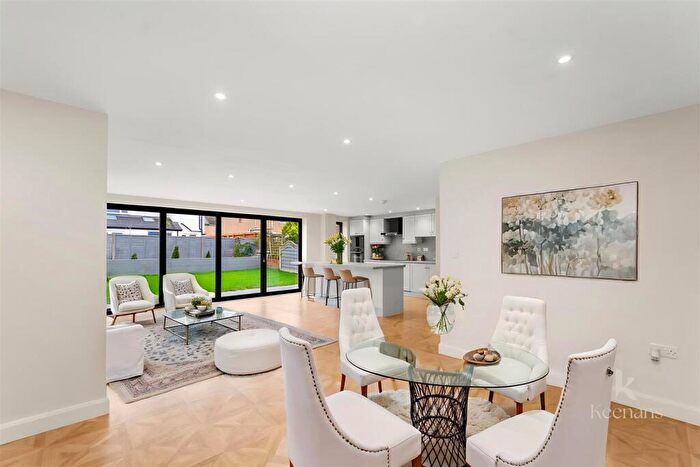
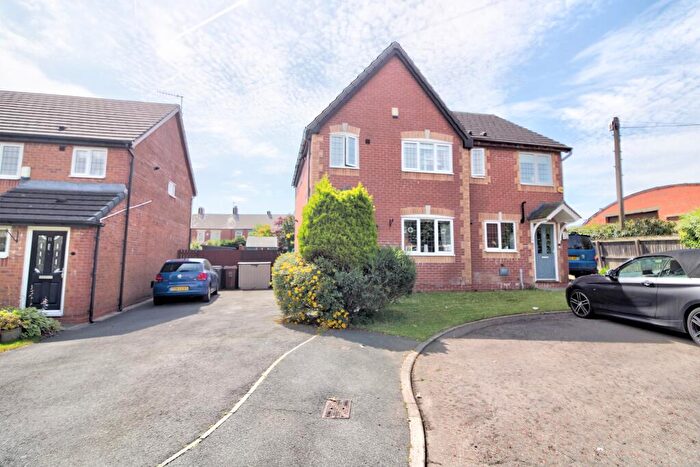
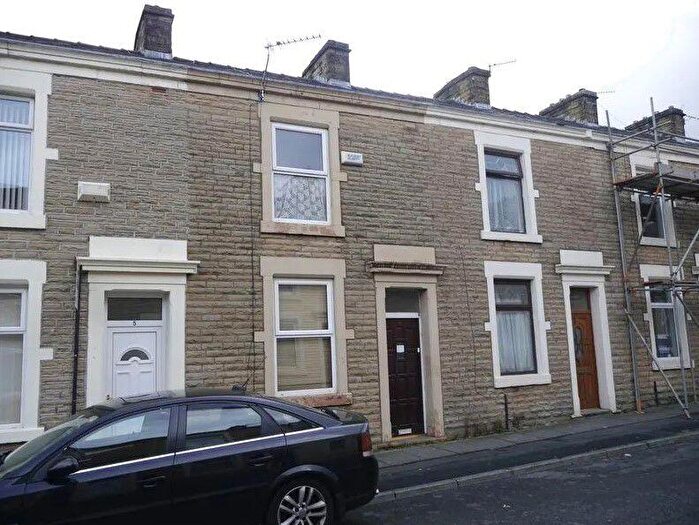
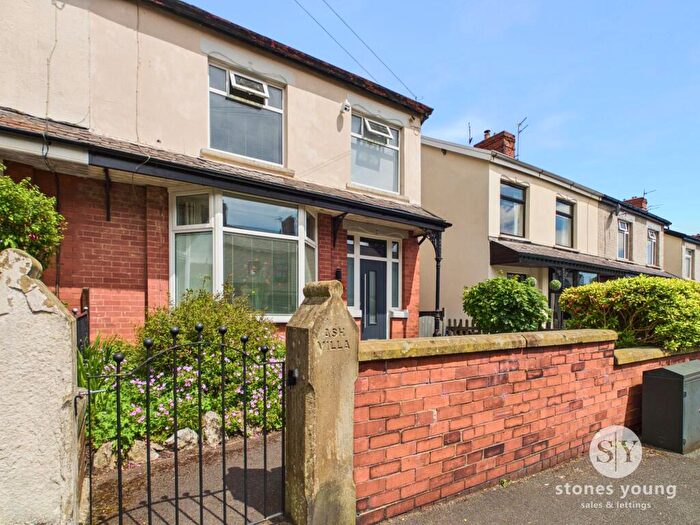
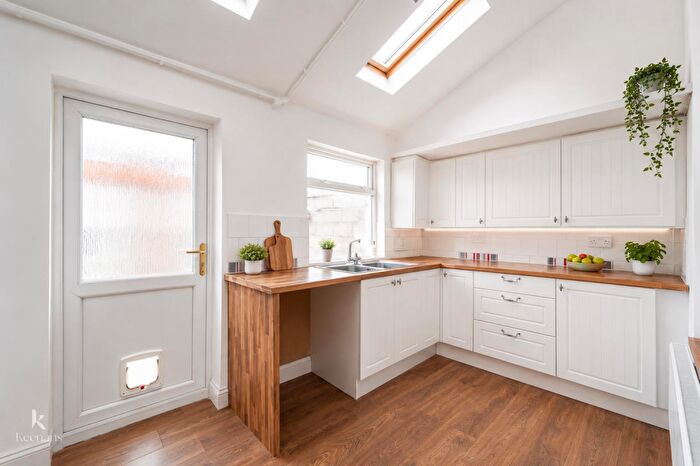
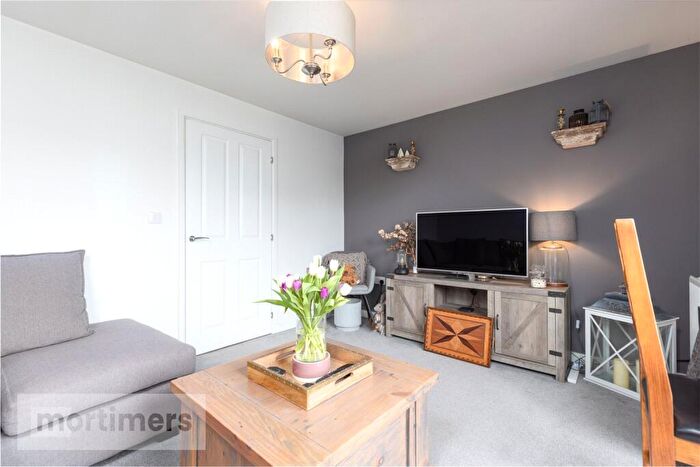
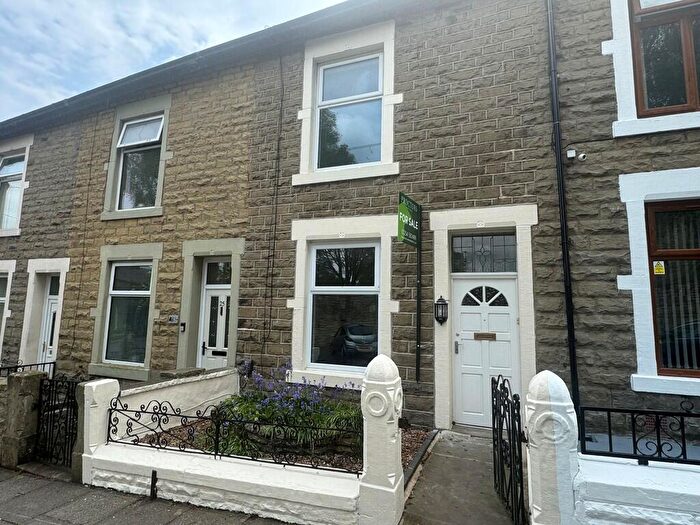
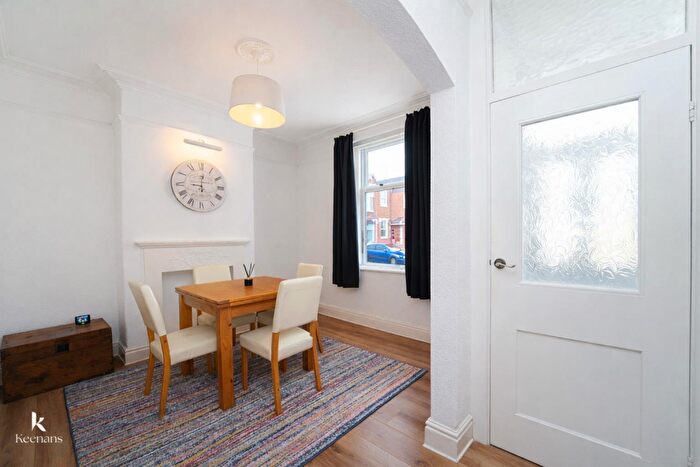
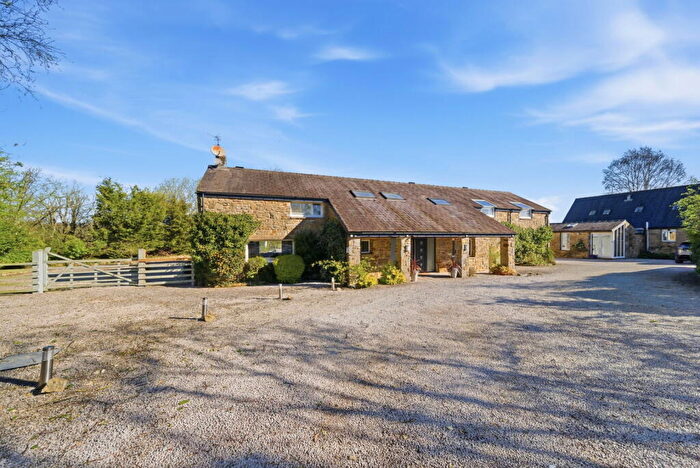
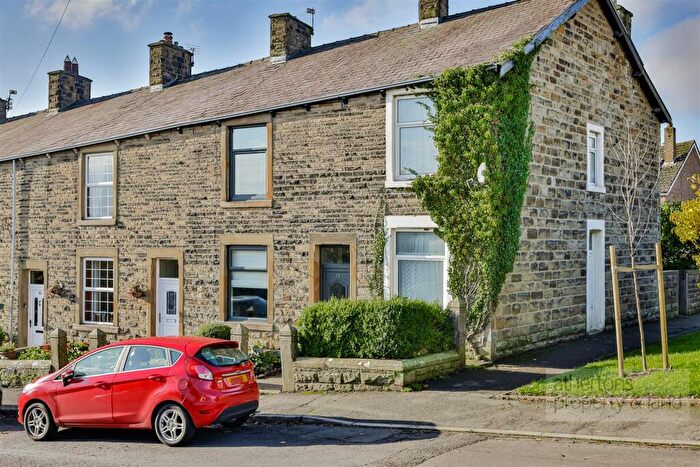
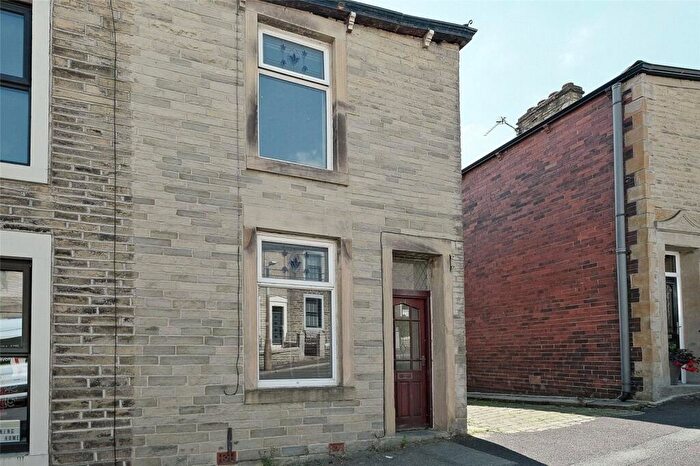
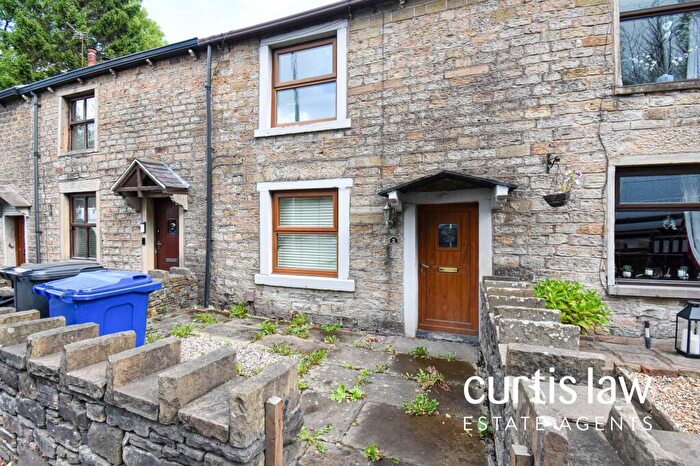
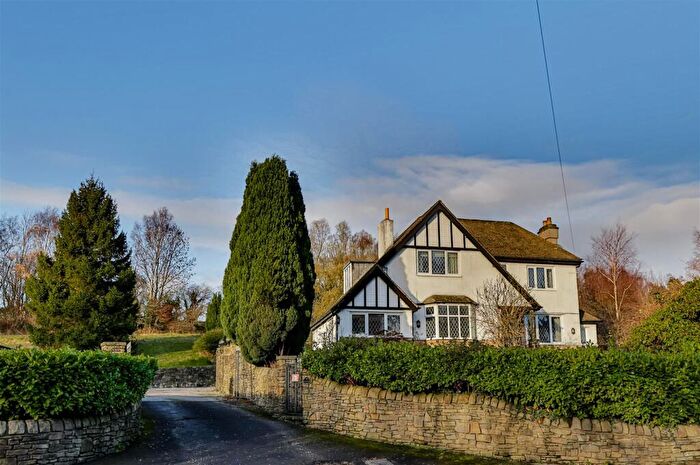
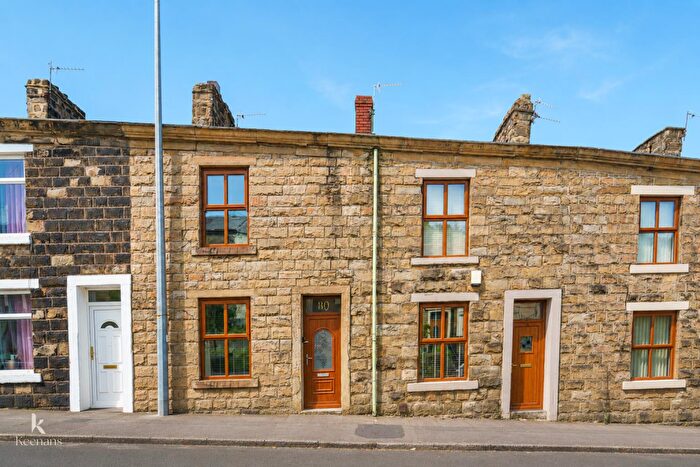
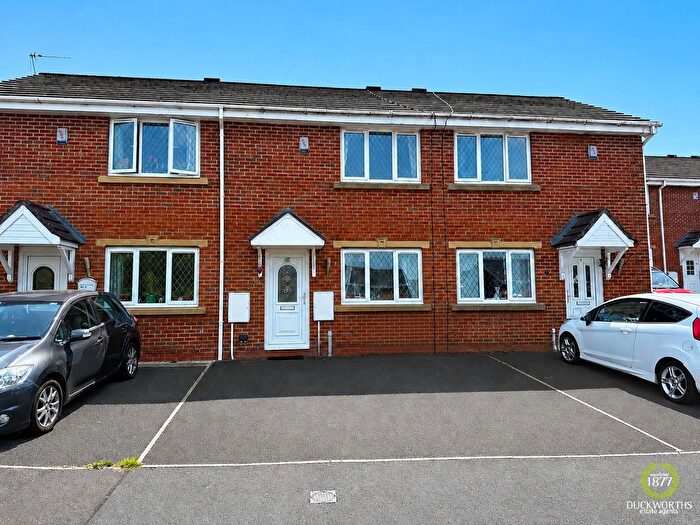
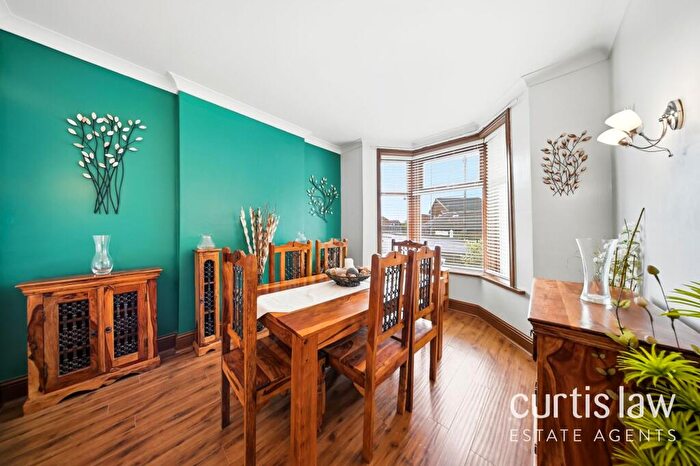
Properties for sale near BB6 7UJ, Martholme Lane
![]()
If you are looking to sell your house, let it out, or receive a property valuation, an expert can help you.
Click the button below to get started.

Price Paid in Martholme Lane, BB6 7UJ, Netherton
MARTHOLME FARM BUNGALOW Martholme Lane, BB6 7UJ, Netherton Blackburn
Property MARTHOLME FARM BUNGALOW has been sold 1 time. The last time it was sold was in 07/12/2023 and the sold price was £165,000.00.
This other property, sold as a freehold on 07/12/2023, is a 242 sqm detached house with an EPC rating of E.
| Date | Price | Property Type | Tenure | Classification |
|---|---|---|---|---|
| 07/12/2023 | £165,000.00 | Other Property | freehold | Established Building |
THE BUNGALOW Martholme Lane, BB6 7UJ, Netherton Blackburn
Property THE BUNGALOW has been sold 2 times. The last time it was sold was in 28/09/2021 and the sold price was £695,000.00.
This other property, sold as a freehold on 28/09/2021, is a 65 sqm detached bungalow with an EPC rating of D.
| Date | Price | Property Type | Tenure | Classification |
|---|---|---|---|---|
| 28/09/2021 | £695,000.00 | Other Property | freehold | Established Building |
| 22/12/2015 | £280,000.00 | Detached House | freehold | Established Building |
12 Martholme Lane, BB6 7UJ, Netherton Blackburn
Property 12 has been sold 2 times. The last time it was sold was in 17/03/2017 and the sold price was £285,000.00.
This semi detached house, sold as a freehold on 17/03/2017, is a 115 sqm semi-detached house with an EPC rating of D.
| Date | Price | Property Type | Tenure | Classification |
|---|---|---|---|---|
| 17/03/2017 | £285,000.00 | Semi Detached House | freehold | Established Building |
| 04/06/1996 | £60,000.00 | Semi Detached House | freehold | Established Building |
15 Martholme Lane, BB6 7UJ, Netherton Blackburn
Property 15 has been sold 1 time. The last time it was sold was in 13/04/2012 and the sold price was £230,000.00.
This semi detached house, sold as a freehold on 13/04/2012, is a 88 sqm semi-detached house with an EPC rating of D.
| Date | Price | Property Type | Tenure | Classification |
|---|---|---|---|---|
| 13/04/2012 | £230,000.00 | Semi Detached House | freehold | Established Building |
13 Martholme Lane, BB6 7UJ, Netherton Blackburn
Property 13 has been sold 1 time. The last time it was sold was in 11/06/1999 and the sold price was £88,500.00.
This semi detached house, sold as a freehold on 11/06/1999, is a 149 sqm semi-detached house with an EPC rating of C.
| Date | Price | Property Type | Tenure | Classification |
|---|---|---|---|---|
| 11/06/1999 | £88,500.00 | Semi Detached House | freehold | Established Building |
18 Martholme Lane, BB6 7UJ, Netherton Blackburn
Property 18 has been sold 1 time. The last time it was sold was in 29/11/1996 and the sold price was £58,500.00.
This is a Semi Detached House which was sold as a freehold in 29/11/1996
| Date | Price | Property Type | Tenure | Classification |
|---|---|---|---|---|
| 29/11/1996 | £58,500.00 | Semi Detached House | freehold | Established Building |
8 Martholme Lane, BB6 7UJ, Netherton Blackburn
Property 8 has been sold 1 time. The last time it was sold was in 09/11/1995 and the sold price was £59,000.00.
This semi detached house, sold as a freehold on 09/11/1995, is a 123 sqm semi-detached house with an EPC rating of C.
| Date | Price | Property Type | Tenure | Classification |
|---|---|---|---|---|
| 09/11/1995 | £59,000.00 | Semi Detached House | freehold | Established Building |
Property price trends in BB6 7UJ, Martholme Lane
According to the latest Land Registry data, the average home in BB6 7UJ, Martholme Lane sold for £285,000 in 2017. That figure comes from 7 sales logged over the past 22 years.
Prices have moved up over the last three years. Compared with 2015, when the typical sale came in around £280,000, that's a rise of roughly 1.8%.
Looking back five years, average prices are up about 23.9% since 2012, a gain of around £55,000 in cash terms.
Property Price Paid in BB6 7UJ, Martholme Lane by Year
The average sold property price by year was:
| Year | Average Sold Price | Price Change |
Sold Properties
|
|---|---|---|---|
| 2017 | £285,000 | 2% |
1 Property |
| 2015 | £280,000 | 18% |
1 Property |
| 2012 | £230,000 | 62% |
1 Property |
| 1999 | £88,500 | 33% |
1 Property |
| 1996 | £59,250 | 0,4% |
2 Properties |
| 1995 | £59,000 | - |
1 Property |
