
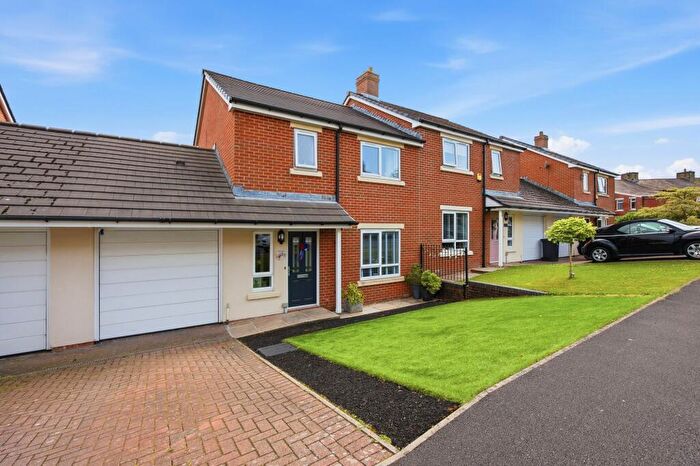
Houses for sale in Netherton, Blackburn
House Prices in Netherton
Properties in Netherton have an average house price of £138k and had 253 Property Transactions within the last 3 years¹.
Netherton is an area in Blackburn, Lancashire with 2,112 households², where the most expensive property was sold for £627k.
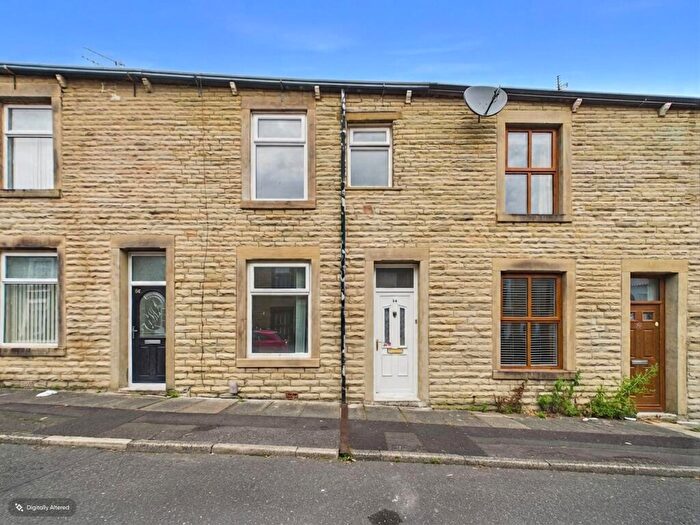
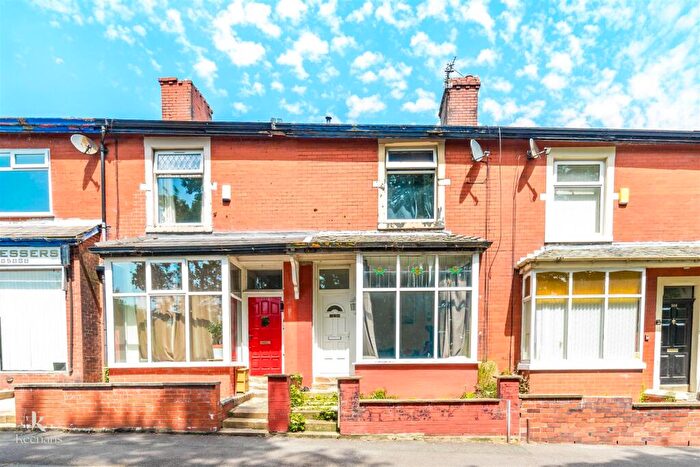
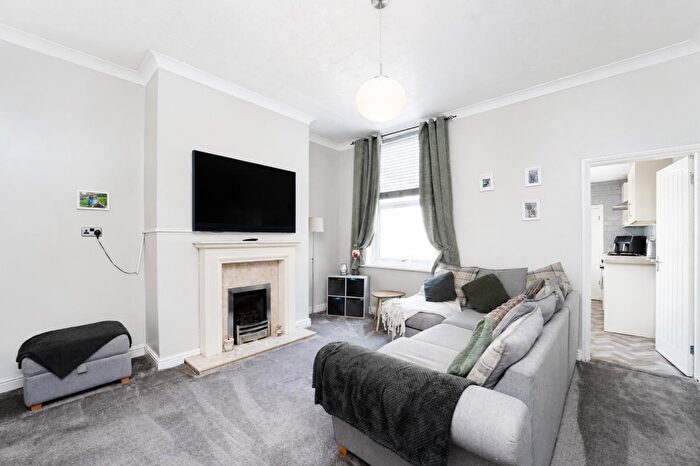
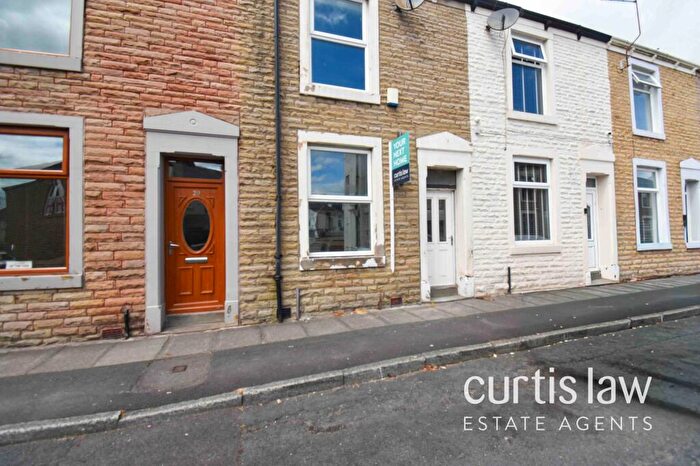
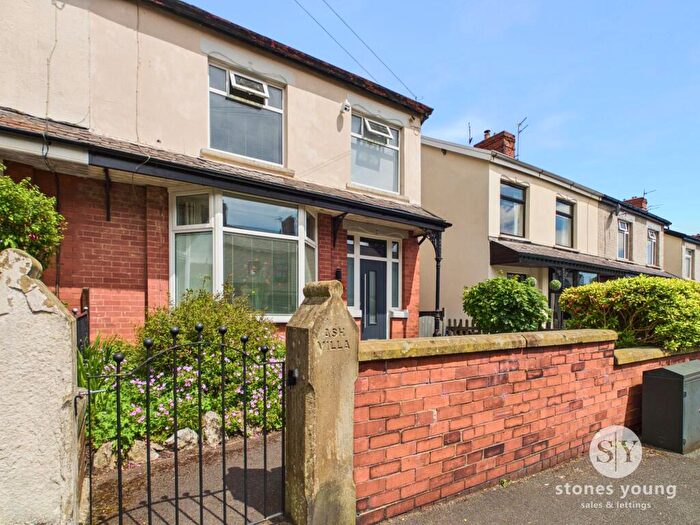
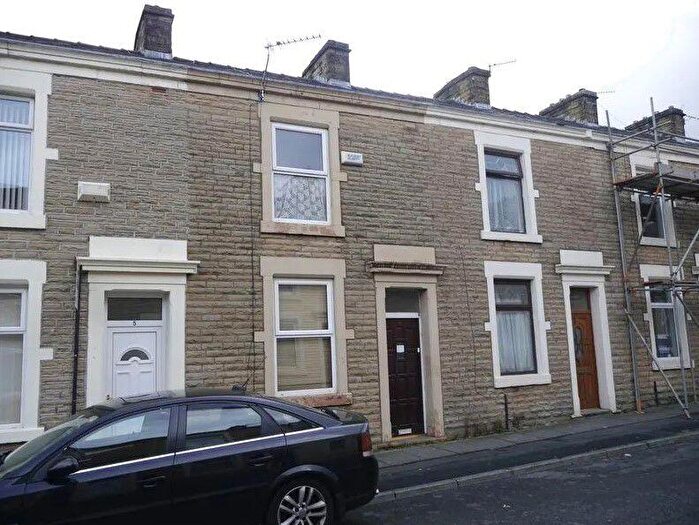
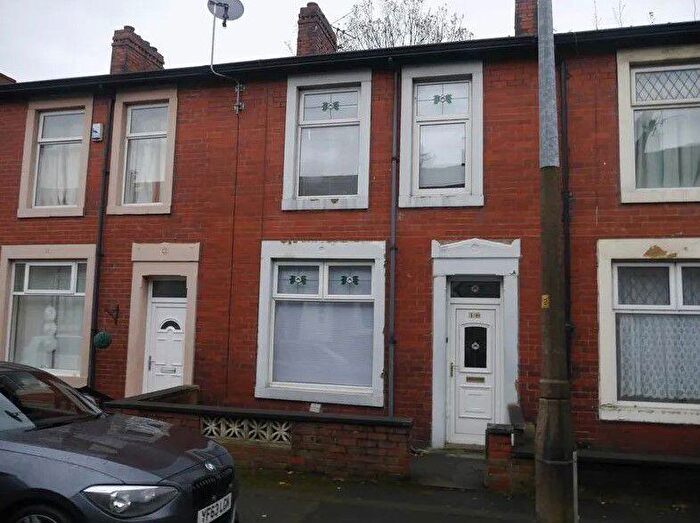
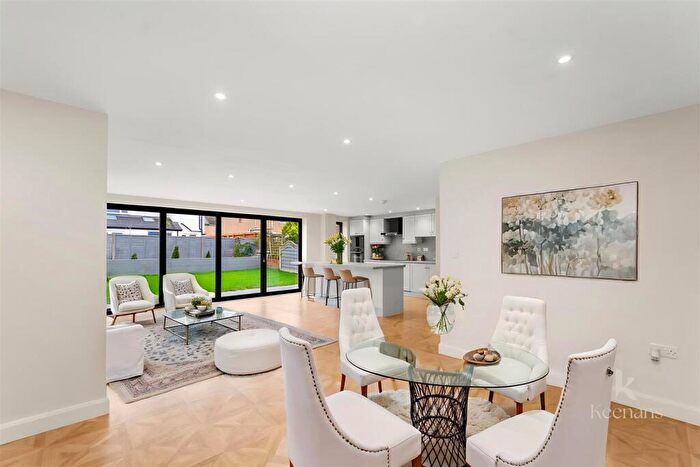
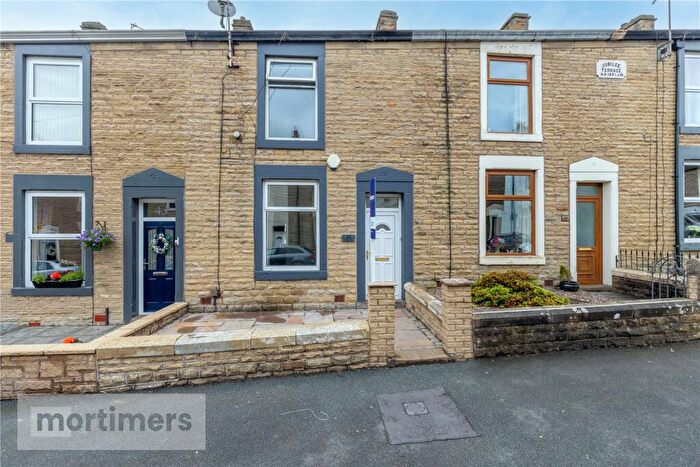
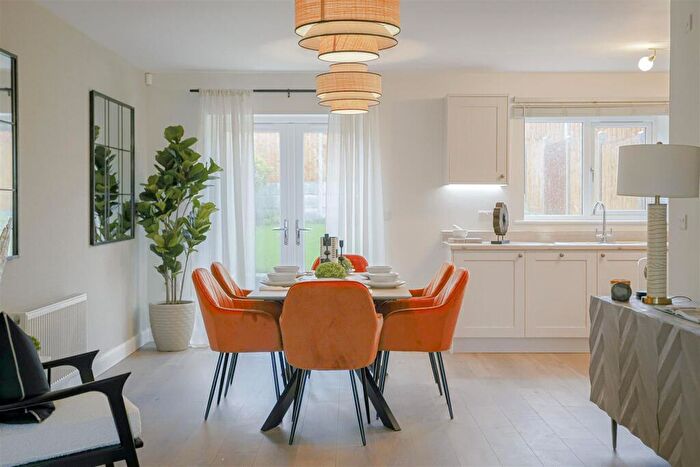
Properties for sale in Netherton
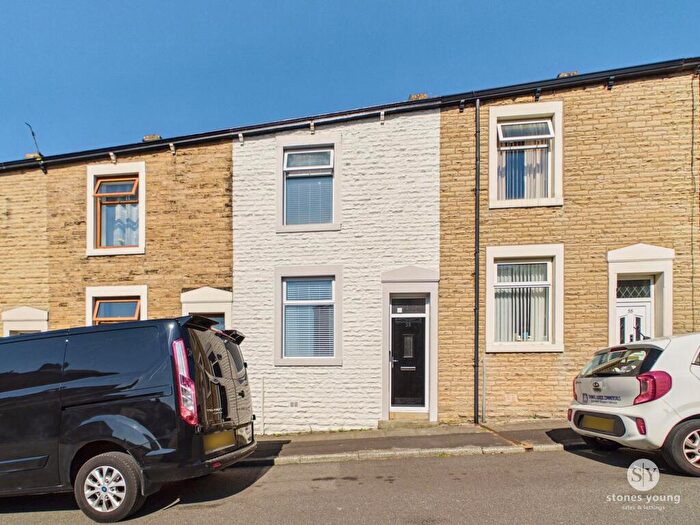
![]()
If you are looking to sell your house, let it out, or receive a property valuation, an expert can help you.
Click the button below to get started.
Roads and Postcodes in Netherton
Navigate through our locations to find the location of your next house in Netherton, Blackburn for sale or to rent.
| Streets | Postcodes |
|---|---|
| Alan Ramsbottom Way | BB6 7FB BB6 7FD BB6 7FE BB6 7UF BB6 7UR BB6 7WL |
| Albert Street | BB6 7BQ |
| Back Hesketh Street | BB6 7DN |
| Back Queen Street | BB6 7DB BB6 7QW |
| Balfour Street | BB6 7SZ |
| Barnmeadow Lane | BB6 7AB |
| Barons Way | BB6 7DL |
| Beamer Grove | BB6 7FZ |
| Blackburn Road | BB6 7EB BB6 7DF BB6 7DZ |
| Cambridge Street | BB6 7BU |
| Campbell Avenue | BB6 7FW |
| Charles Street | BB6 7EZ |
| Charter Brook | BB6 7BG |
| Chatburn Close | BB6 7TL |
| Church Mews | BB6 7EN |
| Clayton Street | BB6 7AH BB6 7AQ BB6 7AZ |
| Croft Street | BB6 7EX |
| Cross Gates | BB6 7DH |
| Cross Street | BB6 7BT |
| Downham Avenue | BB6 7TW |
| Elm Street | BB6 7HA |
| Frankland Chase | BB6 7FQ |
| Game Street | BB6 7DG |
| Garden Street | BB6 7EU |
| Glebe Street | BB6 7AA BB6 7FH BB6 7HQ |
| Greaves Street | BB6 7DY |
| Grimshaw Street | BB6 7AP |
| Hameldon View | BB6 7BL |
| Harwood Bar Caravan Park | BB6 7WA BB6 7WB BB6 7WD BB6 7WE BB6 7WF |
| Harwood New Road | BB6 7TD |
| Haydock Fields Close | BB6 7FP |
| Hesketh Street | BB6 7DW |
| Heys Lane | BB6 7UA |
| Heywood Street | BB6 7DU |
| Holdsworth Drive | BB6 7FR BB6 7FS |
| Hope Street | BB6 7LY |
| Hyndburn Road | BB6 7UE |
| Kingsway | BB6 7XA |
| Lewis Street | BB6 7BN |
| Lomax Street | BB6 7DJ |
| Lord Street | BB6 7DX |
| Loynd Street | BB6 7AD BB6 7FL |
| Lyndhurst Grove | BB6 7TT |
| Lyndon Avenue | BB6 7TP BB6 7TR |
| Lyndon Court | BB6 7TU |
| Lynfield Road | BB6 7TS |
| Martholme Lane | BB6 7UJ |
| Meadow Street | BB6 7EF BB6 7EJ |
| Mercer Street | BB6 7AN |
| Metcalf Drive | BB5 5SJ |
| Mill Lane | BB6 7UQ |
| Mortimer Avenue | BB6 7FF BB6 7FG |
| Moss Street | BB6 7EY |
| Noble Street | BB6 7DT |
| Nuttall Avenue | BB6 7ER |
| Orchard Street | BB6 7EE |
| Palatine Buildings | BB6 7HG |
| Park Street | BB6 7BP |
| Pendle Road | BB6 7TN |
| Princess Street | BB6 7BD |
| Prospect Street | BB6 7EG |
| Queen Street | BB6 7AL BB6 7QQ |
| Railway Terrace | BB6 7EH BB6 7EQ |
| Redcap Close | BB6 7FT |
| Sawley Drive | BB6 7TJ BB6 7TQ |
| School Street | BB6 7ET |
| Segar Street | BB6 7DR |
| St Cecilia Street | BB6 7BS |
| St Edmunds Street | BB6 7BW |
| St Huberts Road | BB6 7AF BB6 7AR BB6 7AS BB6 7DS BB6 7ED |
| St Huberts Street | BB6 7BE |
| St Johns Street | BB6 7EP BB6 7ES |
| Station Road | BB6 7BB BB6 7BA |
| Town Hall Square | BB6 7DD |
| Town Hall Street | BB6 7HB BB6 7DQ |
| Vicar Street | BB6 7FA |
| Walmsley Street | BB6 7DP |
| Ward Street | BB6 7AW |
| Wellington Street | BB6 7EW |
| Westwell Street | BB6 7AE |
| Whalley Road | BB6 7TE BB6 7TF BB6 7UG BB6 7UH |
| Wood Street | BB6 7UD |
| Worston Lane | BB6 7TH |
| York Street | BB6 7SB |
Property price trends in Netherton
According to the latest Land Registry data, the average home in Netherton sold for £82,000 in 2026. That figure comes from 2,927 sales logged over the past 31 years.
Prices have fallen back over the last three years. Compared with 2023, when the typical sale came in around £141,272, that's a fall of roughly 42%.
Looking back five years, average prices are down about 30.6% since 2021, a drop of around £36,152 in cash terms.
Zoom out to the past decade for the fuller picture. Back in 2016, homes here averaged £100,736, so the typical sold price has fallen about 18.6% since then, around 2% a year lower. Stretch the view to fifteen years and that annual pace edges up closer to -0.9%.
Frequently asked questions about Netherton
What is the average price for a property for sale in Netherton?
The average price for a property for sale in Netherton is £138,225. This amount is 36% lower than the average price in Blackburn. There are 917 property listings for sale in Netherton.
What streets have the most expensive properties for sale in Netherton?
The streets with the most expensive properties for sale in Netherton are Kingsway at an average of £367,500, Whalley Road at an average of £350,555 and Chatburn Close at an average of £270,000.
What streets have the most affordable properties for sale in Netherton?
The streets with the most affordable properties for sale in Netherton are St Cecilia Street at an average of £42,750, Wellington Street at an average of £48,000 and Prospect Street at an average of £52,775.
Which train stations are available in or near Netherton?
Some of the train stations available in or near Netherton are Rishton, Huncoat and Langho.
Property Price Paid in Netherton by Year
The average sold property price by year was:
| Year | Average Sold Price | Price Change |
Sold Properties
|
|---|---|---|---|
| 2026 | £82,000 | -57% |
6 Properties |
| 2025 | £128,806 | -14% |
72 Properties |
| 2024 | £146,754 | 4% |
88 Properties |
| 2023 | £141,272 | 11% |
87 Properties |
| 2022 | £125,265 | 6% |
81 Properties |
| 2021 | £118,152 | 11% |
95 Properties |
| 2020 | £105,253 | -19% |
80 Properties |
| 2019 | £124,986 | 29% |
130 Properties |
| 2018 | £88,332 | -7% |
76 Properties |
| 2017 | £94,768 | -6% |
84 Properties |
Property Price per Property Type in Netherton
Here you can find historic sold price data in order to help with your property search.
The average Property Paid Price for specific property types in the last three years are:
| Property Type | Average Sold Price | Sold Properties |
|---|---|---|
| Semi Detached House | £221,443.00 | 56 Semi Detached Houses |
| Detached House | £274,730.00 | 31 Detached Houses |
| Terraced House | £84,660.00 | 166 Terraced Houses |
