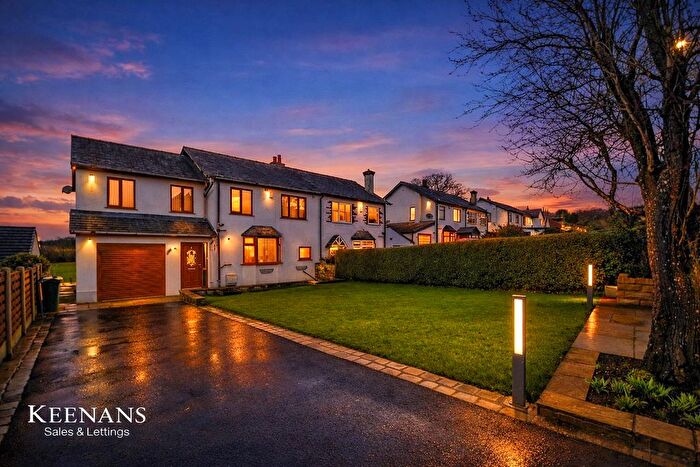
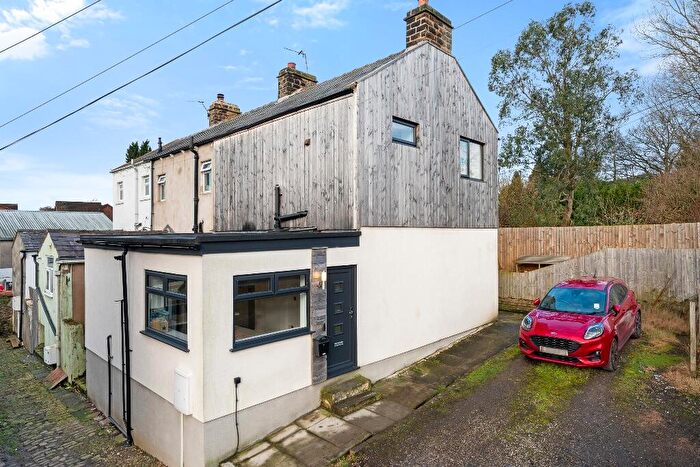
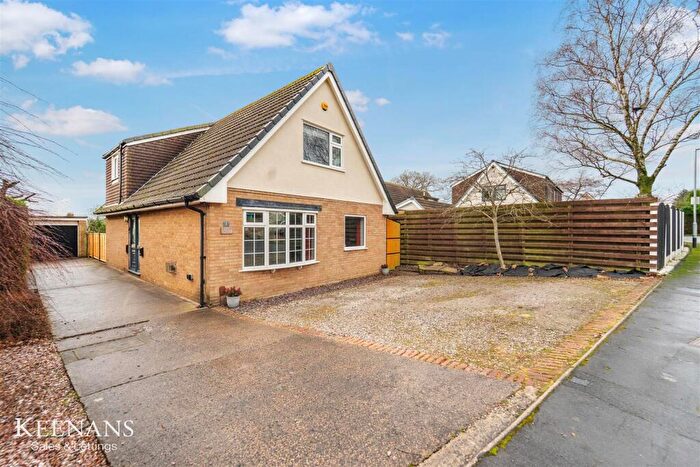
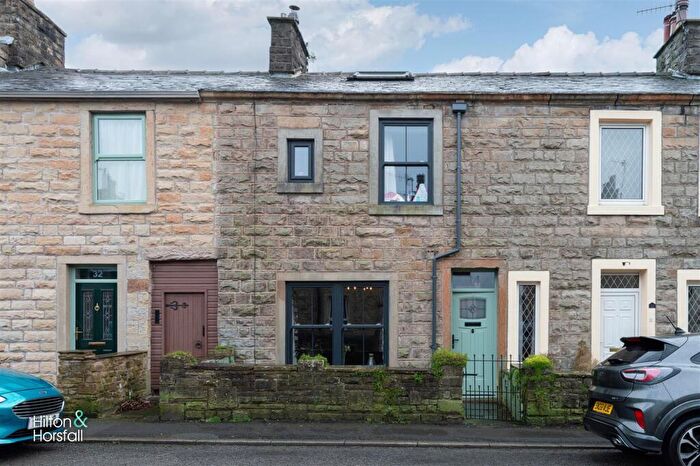
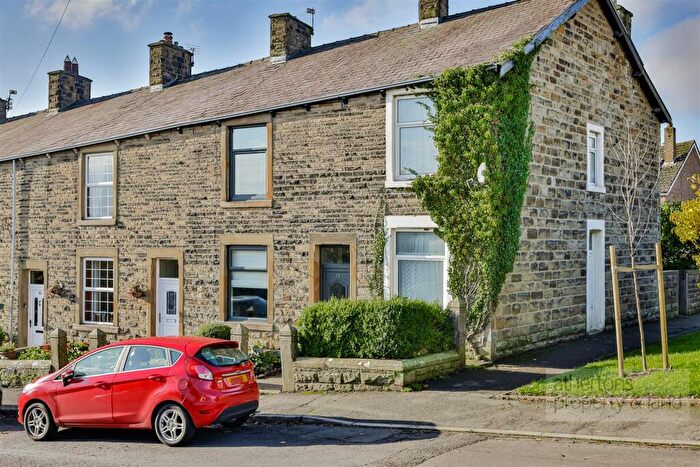
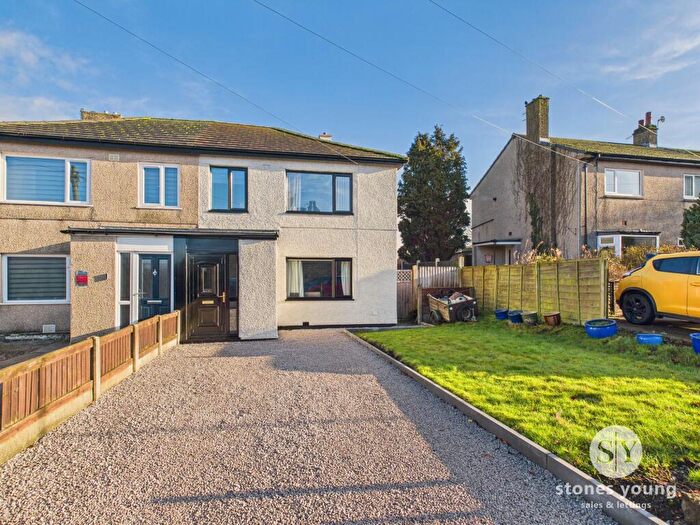
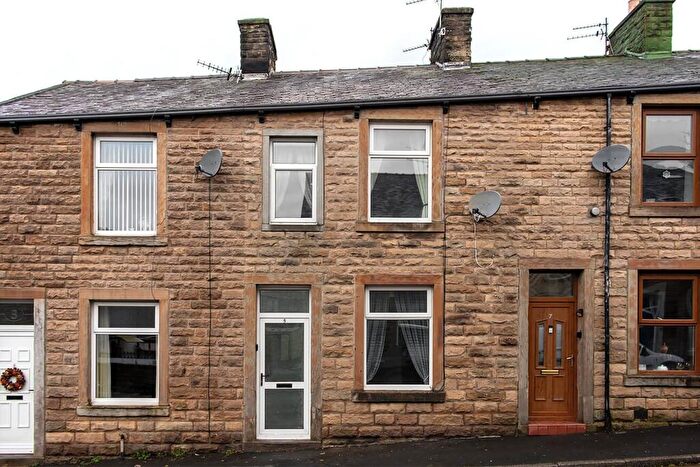
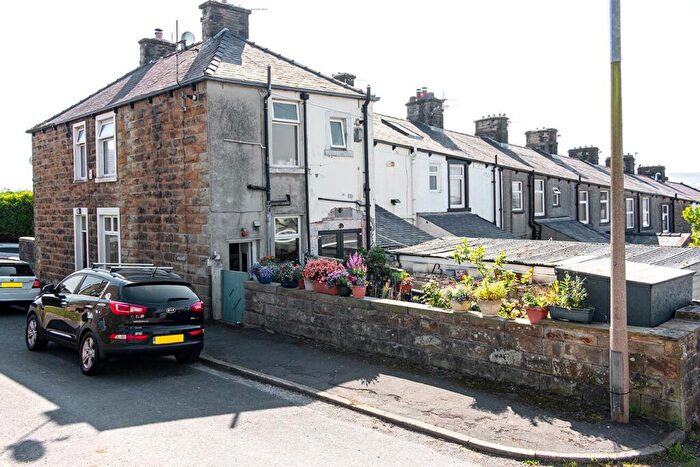
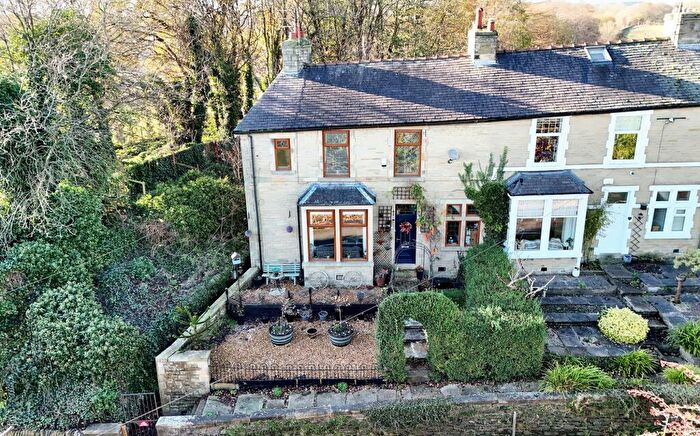
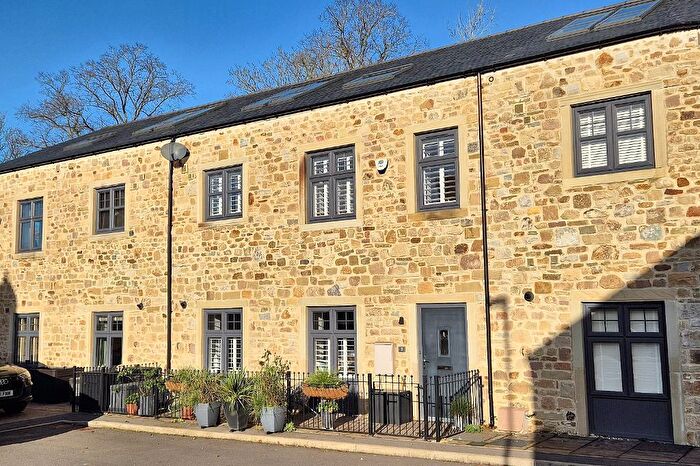
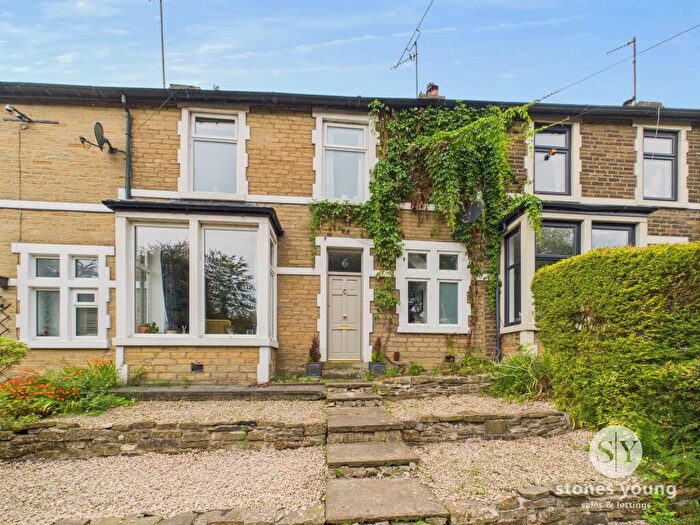
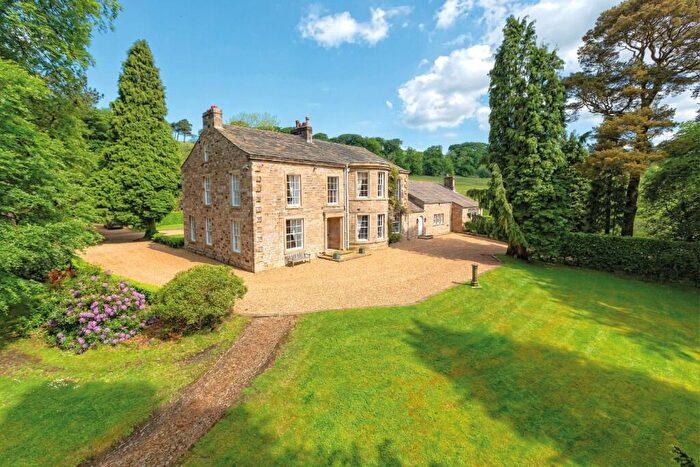
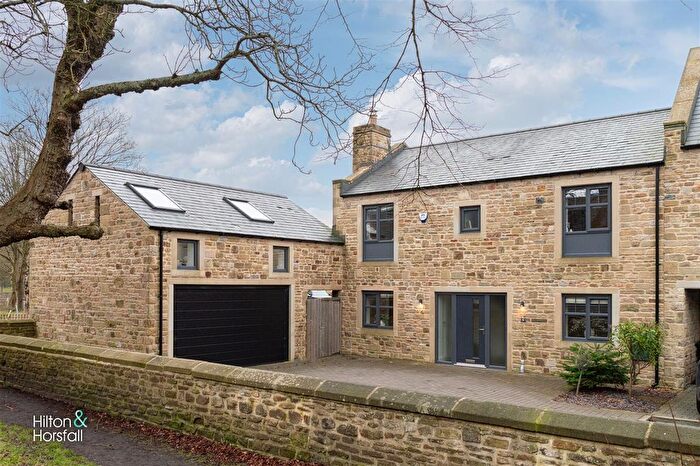
Houses for sale & to rent in Read And Simonstone, Burnley
House Prices in Read And Simonstone
Properties in Read And Simonstone have an average house price of £296,738.00 and had 102 Property Transactions within the last 3 years¹.
Read And Simonstone is an area in Burnley, Lancashire with 1,047 households², where the most expensive property was sold for £910,000.00.
Properties for sale in Read And Simonstone
Previously listed properties in Read And Simonstone
Roads and Postcodes in Read And Simonstone
Navigate through our locations to find the location of your next house in Read And Simonstone, Burnley for sale or to rent.
| Streets | Postcodes |
|---|---|
| Altham Pumping Station | BB12 7NL |
| Back Lane | BB12 7QP |
| Bank Terrace | BB12 7NW |
| Beaufort Close | BB12 7QF |
| Beauley Avenue | BB12 7HU |
| Berkeley Drive | BB12 7QG |
| Blackburn Road | BB12 7NQ |
| Buckingham Drive | BB12 7QE |
| Byland Close | BB12 7QA |
| Carleton Avenue | BB12 7JA |
| Church Street | BB12 7RW |
| Clough Lane | BB12 7HW |
| Dawson Avenue | BB12 7JF |
| East View | BB12 7PS |
| Fort Street | BB12 7PP |
| Fountains Avenue | BB12 7PY |
| Furness Avenue | BB12 7SU |
| George Lane | BB12 7RD BB12 7RH BB12 7RQ BB12 7SD |
| Green Acres | BB12 7PT |
| Hambledon View | BB12 7PD |
| Hammond Drive | BB12 7RE |
| Harewood Avenue | BB12 7JB |
| Haugh Avenue | BB12 7HZ |
| Jubilee Street | BB12 7PR |
| Kirkstall Avenue | BB12 7PZ |
| Lawrence Avenue | BB12 7HX |
| Masterson Avenue | BB12 7PL |
| Nowell Grove | BB12 7PG |
| Patrick Avenue | BB12 7QQ |
| Pollard Row | BB12 7NS |
| Railway Terrace | BB12 7NN |
| Sabden Road | BB12 9AD |
| Sawley Avenue | BB12 7QD |
| School Lane | BB12 7HR |
| Scott Avenue | BB12 7HY |
| Simonstone Lane | BB12 7NP BB12 7NX |
| Singleton Avenue | BB12 7PJ |
| St Johns Close | BB12 7RL |
| Straits Lane | BB12 7PE BB12 7PQ BB12 7RA |
| Tennyson Avenue | BB12 7PF BB12 7RN |
| Trapp Lane | BB12 7QW |
| Tunstead Avenue | BB12 7NR |
| Turner Fold | BB12 7QZ |
| Valley Terrace | BB12 7NT |
| Victoria Lodge | BB12 7SZ |
| Waverley Close | BB12 7QB |
| Westfield Avenue | BB12 7PW |
| Westminster Close | BB12 7ST |
| Whalley Road | BB12 7HN BB12 7HS BB12 7HT BB12 7NY BB12 7NZ BB12 7PB BB12 7PN BB12 7RP BB12 7RR |
| Whins Lane | BB12 7QL BB12 7QR BB12 7QT BB12 7QU BB12 7QY BB12 7RB |
| Wicken Tree Row | BB12 7QS |
| Windsor Close | BB12 7QH |
| Wood Terrace | BB12 7HP |
| Woodfields | BB12 7SB |
| Woodhead Road | BB12 7PH |
| Woodside Road | BB12 7JG |
| BB12 7RY |
Transport near Read And Simonstone
- FAQ
- Price Paid By Year
- Property Type Price
Frequently asked questions about Read And Simonstone
What is the average price for a property for sale in Read And Simonstone?
The average price for a property for sale in Read And Simonstone is £296,738. This amount is 120% higher than the average price in Burnley. There are 100 property listings for sale in Read And Simonstone.
What streets have the most expensive properties for sale in Read And Simonstone?
The streets with the most expensive properties for sale in Read And Simonstone are Woodfields at an average of £595,000, Tennyson Avenue at an average of £535,000 and Beauley Avenue at an average of £493,000.
What streets have the most affordable properties for sale in Read And Simonstone?
The streets with the most affordable properties for sale in Read And Simonstone are Railway Terrace at an average of £110,833, Jubilee Street at an average of £118,300 and Hambledon View at an average of £135,600.
Which train stations are available in or near Read And Simonstone?
Some of the train stations available in or near Read And Simonstone are Hapton, Huncoat and Whalley.
Property Price Paid in Read And Simonstone by Year
The average sold property price by year was:
| Year | Average Sold Price | Price Change |
Sold Properties
|
|---|---|---|---|
| 2025 | £318,582 | 13% |
38 Properties |
| 2024 | £276,138 | -5% |
29 Properties |
| 2023 | £290,090 | -7% |
35 Properties |
| 2022 | £309,895 | 5% |
46 Properties |
| 2021 | £295,058 | 17% |
46 Properties |
| 2020 | £243,581 | -7% |
37 Properties |
| 2019 | £260,374 | 10% |
51 Properties |
| 2018 | £235,313 | 11% |
44 Properties |
| 2017 | £209,169 | -17% |
55 Properties |
| 2016 | £245,674 | -3% |
45 Properties |
| 2015 | £252,181 | 11% |
48 Properties |
| 2014 | £225,539 | 9% |
46 Properties |
| 2013 | £205,558 | -20% |
40 Properties |
| 2012 | £247,342 | 8% |
27 Properties |
| 2011 | £226,580 | 7% |
24 Properties |
| 2010 | £211,714 | 12% |
28 Properties |
| 2009 | £186,240 | -29% |
36 Properties |
| 2008 | £239,359 | -10% |
35 Properties |
| 2007 | £264,398 | 12% |
61 Properties |
| 2006 | £232,198 | 7% |
65 Properties |
| 2005 | £215,761 | -3% |
40 Properties |
| 2004 | £221,974 | 36% |
41 Properties |
| 2003 | £141,833 | 14% |
53 Properties |
| 2002 | £122,055 | 5% |
50 Properties |
| 2001 | £115,646 | 25% |
63 Properties |
| 2000 | £87,191 | -3% |
47 Properties |
| 1999 | £89,918 | 20% |
43 Properties |
| 1998 | £71,632 | -5% |
42 Properties |
| 1997 | £75,071 | 13% |
51 Properties |
| 1996 | £65,480 | -25% |
50 Properties |
| 1995 | £81,600 | - |
41 Properties |
Property Price per Property Type in Read And Simonstone
Here you can find historic sold price data in order to help with your property search.
The average Property Paid Price for specific property types in the last three years are:
| Property Type | Average Sold Price | Sold Properties |
|---|---|---|
| Semi Detached House | £317,440.00 | 15 Semi Detached Houses |
| Detached House | £410,998.00 | 44 Detached Houses |
| Terraced House | £172,598.00 | 43 Terraced Houses |

