
Houses for sale in Sabden, Clitheroe
House Prices in Sabden
Properties in Sabden have an average house price of £261k and had 73 Property Transactions within the last 3 years¹.
Sabden is an area in Clitheroe, Lancashire with 712 households², where the most expensive property was sold for £834k.
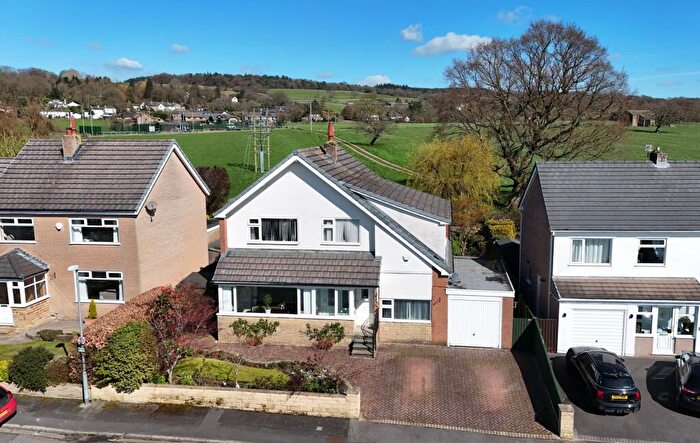
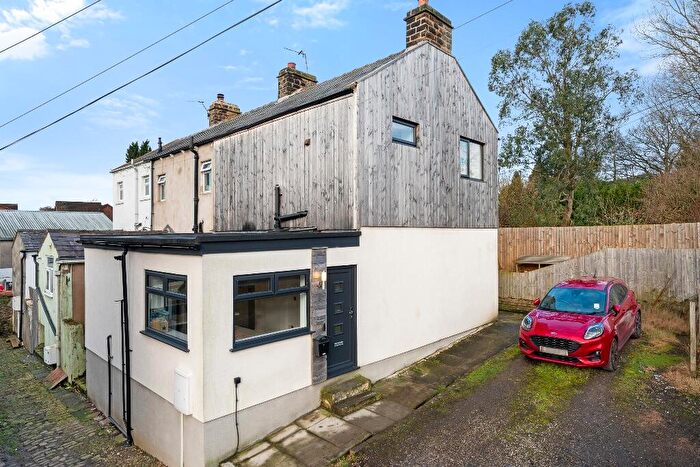
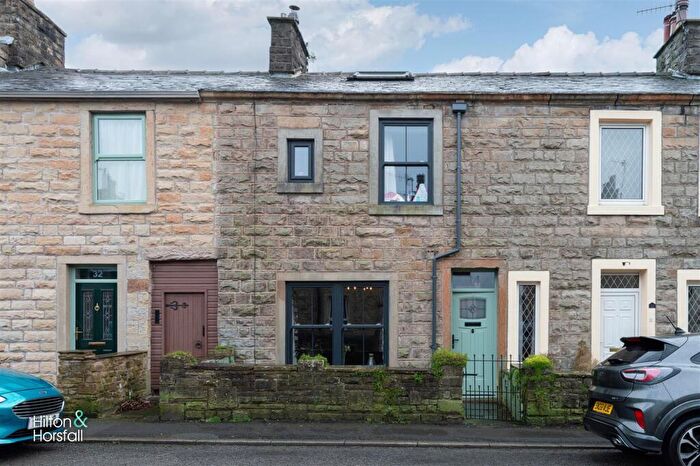
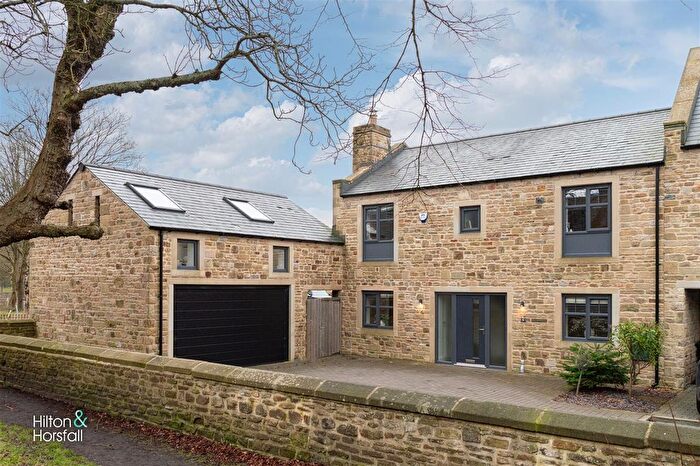
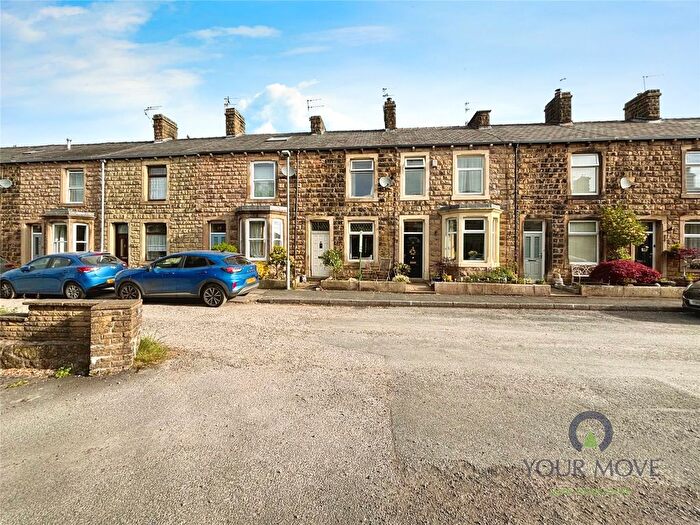
Properties for sale in Sabden
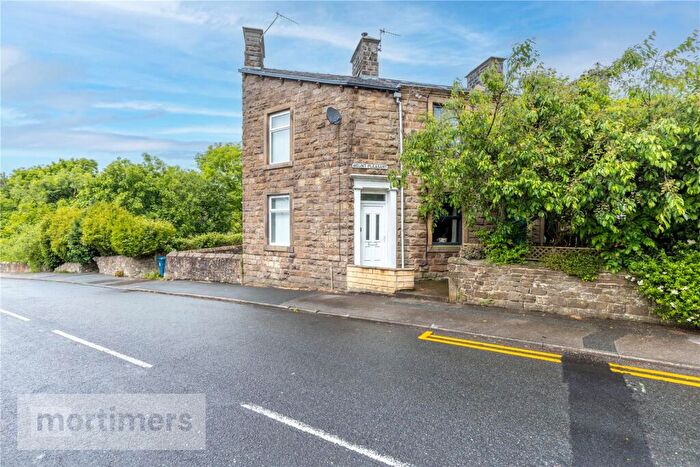
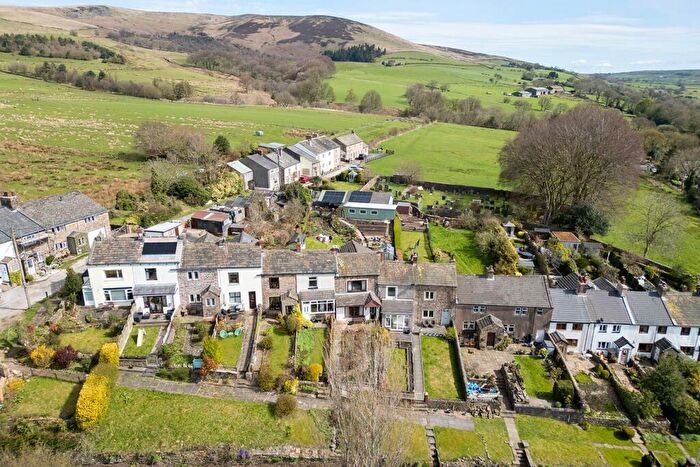
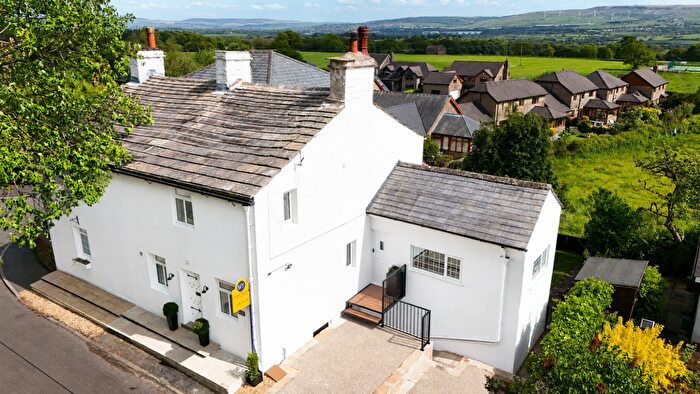
![]()
If you are looking to sell your house, let it out, or receive a property valuation, an expert can help you.
Click the button below to get started.
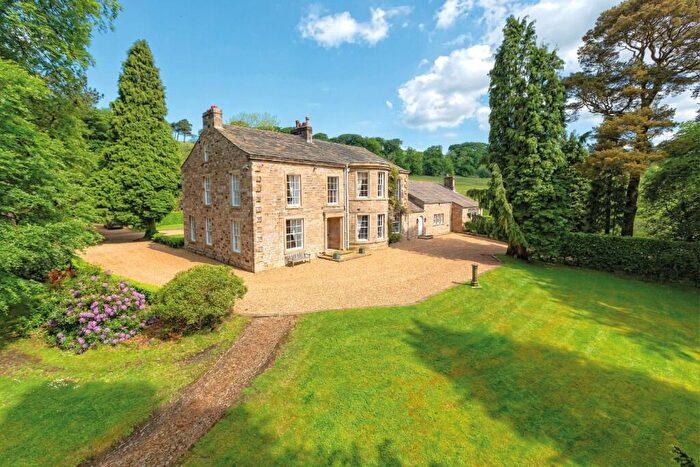
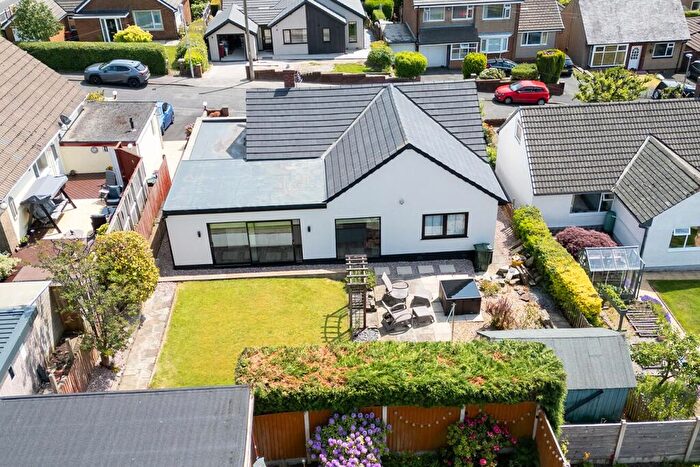
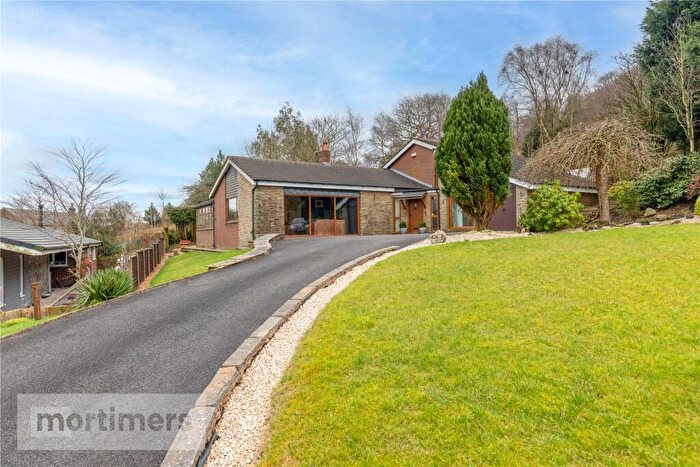
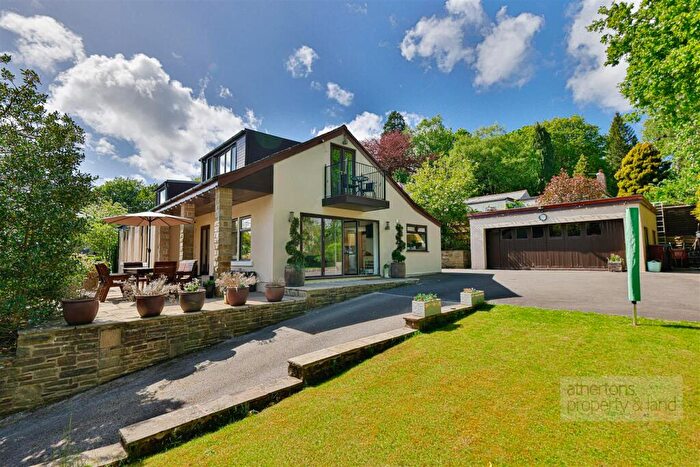
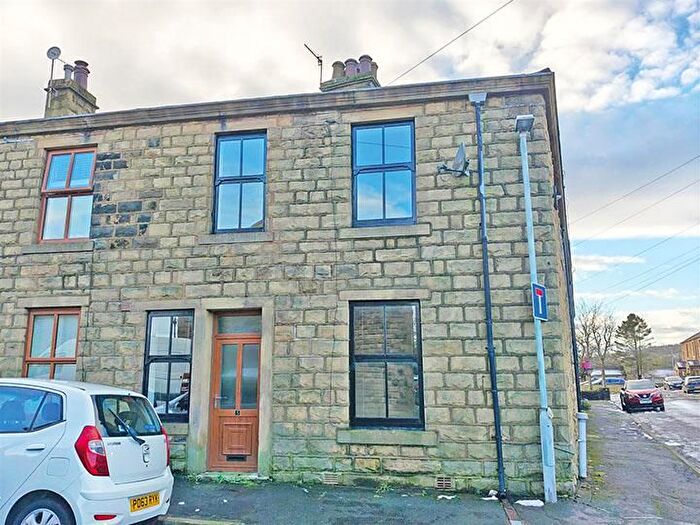
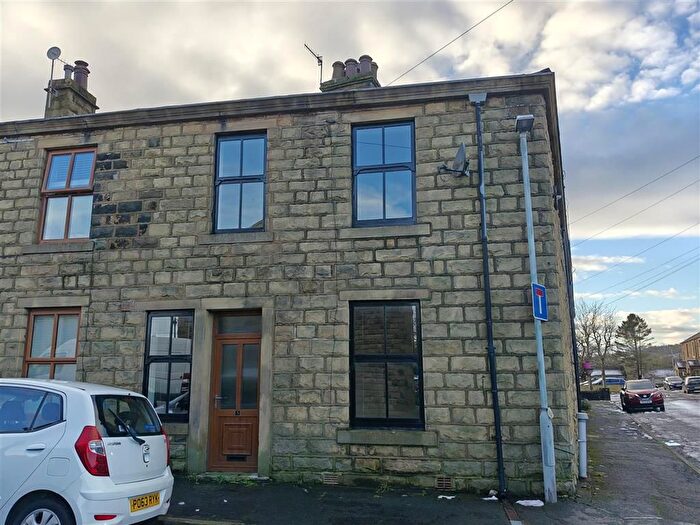
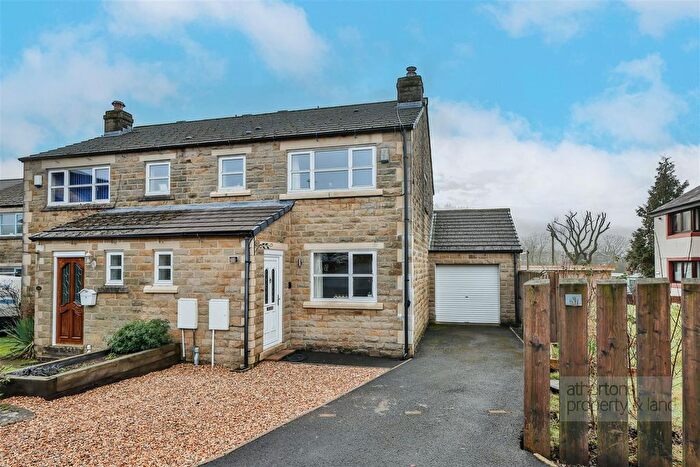
Previously listed properties in Sabden

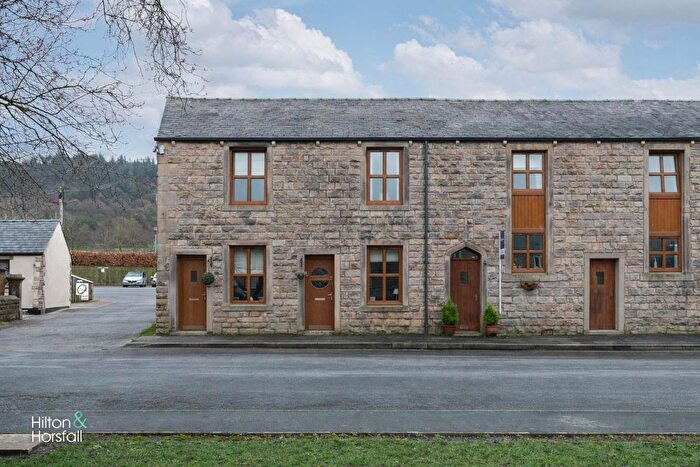
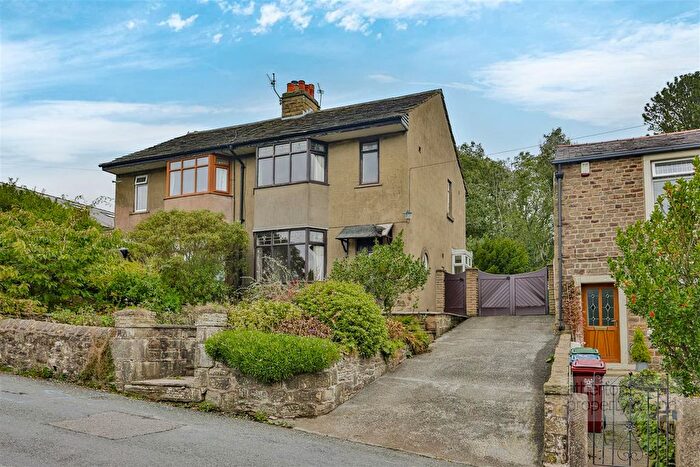
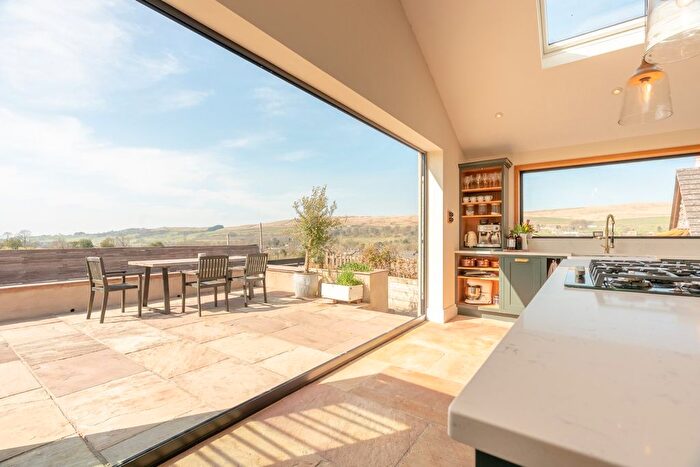
![]()
If you are looking to sell your house, let it out, or receive a property valuation, an expert can help you.
Click the button below to get started.

Roads and Postcodes in Sabden
Navigate through our locations to find the location of your next house in Sabden, Clitheroe for sale or to rent.
| Streets | Postcodes |
|---|---|
| Alston Close | BB7 9HS |
| Badger Wells Cottages | BB7 9EL |
| Black Hill View | BB7 9GY |
| Brookside | BB7 9ET |
| Bury Row | BB7 9HH |
| Clerk Hill Road | BB7 9FR |
| Clitheroe Road | BB7 9HD BB7 9HJ BB7 9HX |
| Cobden Close | BB7 9UY |
| Crow Trees Road | BB7 9HE |
| Eightacre Avenue | BB7 9HQ |
| Gardeners Row | BB7 9EB |
| Hey Houses | BB7 9EJ |
| Homeacre Avenue | BB7 9HG |
| Lamb Row | BB7 9DX |
| Lane Ends | BB7 9EZ |
| Laneside | BB7 9DU |
| Littlemoor Close | BB7 9ES |
| Littlemoor House | BB7 9HT |
| Mill Court | BB7 9UB BB7 9UX |
| Mount Pleasant | BB7 9EU |
| Padiham Road | BB7 9EW BB7 9EX BB7 9HB |
| Pendle Side Close | BB7 9DJ |
| Pendle Street East | BB7 9EQ BB7 9FX |
| Pendle Street West | BB7 9EG |
| Ridding Lane | BB7 9HW |
| Sabden | BB7 9HP |
| Sabden Brook Court | BB7 9FY |
| Simonstone Road | BB7 9HA |
| St Nicholas Avenue | BB7 9HR |
| St Nicholas Mews | BB7 9HU |
| Stubbins Lane | BB7 9EP BB7 9FN BB7 9FS |
| The Fields | BB7 9EF |
| Thorn Street | BB7 9EY |
| Timbrills Avenue | BB7 9HF |
| Top Row | BB7 9HL |
| Victoria Grove | BB7 9DQ |
| Waterside Close | BB7 9FJ |
| Watt Street | BB7 9ED |
| Wesley Street | BB7 9EH BB7 9EN |
| Whalley Road | BB7 9DT BB7 9DZ BB7 9EA |
| Whins Avenue | BB7 9DY |
Property price trends in Sabden
According to the latest Land Registry data, the average home in Sabden sold for £188,666 in 2026. That figure comes from 862 sales logged over the past 31 years.
Prices have fallen back over the last three years. Compared with 2023, when the typical sale came in around £272,105, that's a fall of roughly 30.7%.
Looking back five years, average prices are down about 19.4% since 2021, a drop of around £45,525 in cash terms.
Zoom out to the past decade for the fuller picture. Back in 2016, homes here averaged £179,701, so the typical sold price has climbed about 5% since then, roughly 0.5% a year. Stretch the view to fifteen years and that annual pace eases back to about 0.2%.
Frequently asked questions about Sabden
What is the average price for a property for sale in Sabden?
The average price for a property for sale in Sabden is £261,022. This amount is 15% lower than the average price in Clitheroe. There are 51 property listings for sale in Sabden.
What streets have the most expensive properties for sale in Sabden?
The streets with the most expensive properties for sale in Sabden are Simonstone Road at an average of £645,000, Wesley Street at an average of £507,500 and Clitheroe Road at an average of £396,166.
What streets have the most affordable properties for sale in Sabden?
The streets with the most affordable properties for sale in Sabden are Black Hill View at an average of £120,000, Gardeners Row at an average of £126,777 and Watt Street at an average of £134,890.
Which train stations are available in or near Sabden?
Some of the train stations available in or near Sabden are Whalley, Hapton and Clitheroe.
Property Price Paid in Sabden by Year
The average sold property price by year was:
| Year | Average Sold Price | Price Change |
Sold Properties
|
|---|---|---|---|
| 2026 | £188,666 | -40% |
5 Properties |
| 2025 | £264,237 | 1% |
18 Properties |
| 2024 | £261,226 | -4% |
23 Properties |
| 2023 | £272,105 | 13% |
27 Properties |
| 2022 | £238,087 | 2% |
25 Properties |
| 2021 | £234,191 | -19% |
37 Properties |
| 2020 | £277,897 | 18% |
48 Properties |
| 2019 | £228,382 | 22% |
26 Properties |
| 2018 | £178,635 | 10% |
25 Properties |
| 2017 | £161,413 | -11% |
22 Properties |
Property Price per Property Type in Sabden
Here you can find historic sold price data in order to help with your property search.
The average Property Paid Price for specific property types in the last three years are:
| Property Type | Average Sold Price | Sold Properties |
|---|---|---|
| Semi Detached House | £258,416.00 | 14 Semi Detached Houses |
| Detached House | £459,443.00 | 16 Detached Houses |
| Terraced House | £188,040.00 | 43 Terraced Houses |
