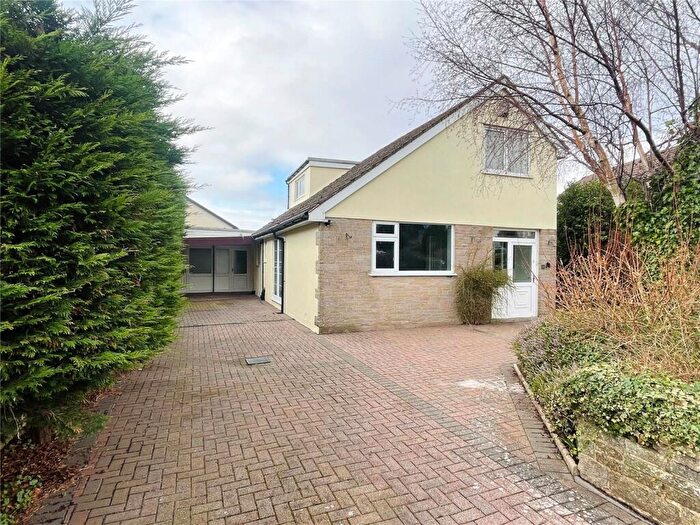
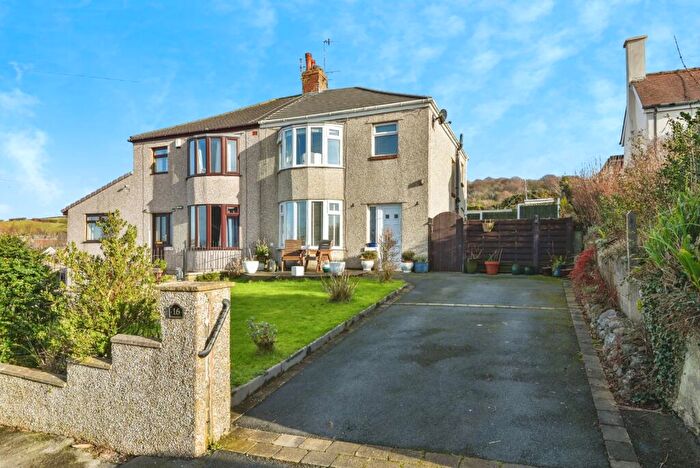
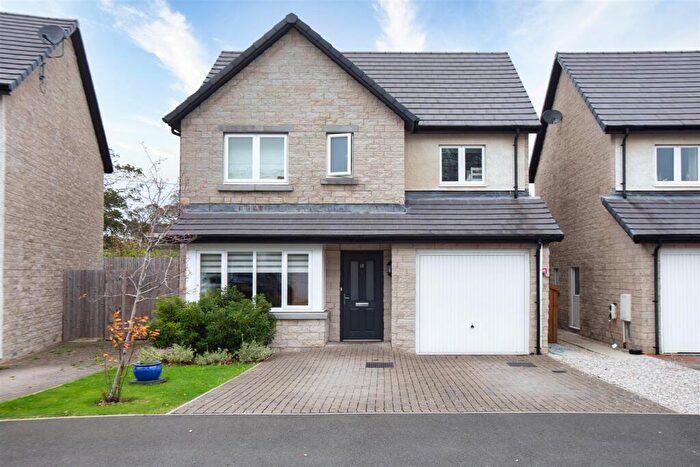
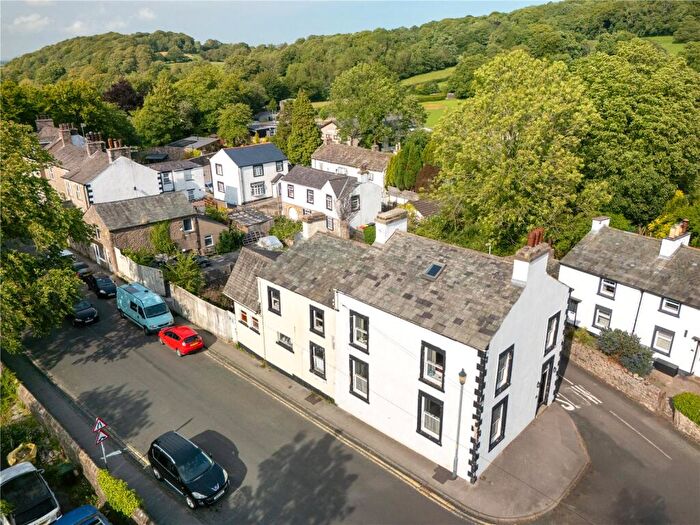
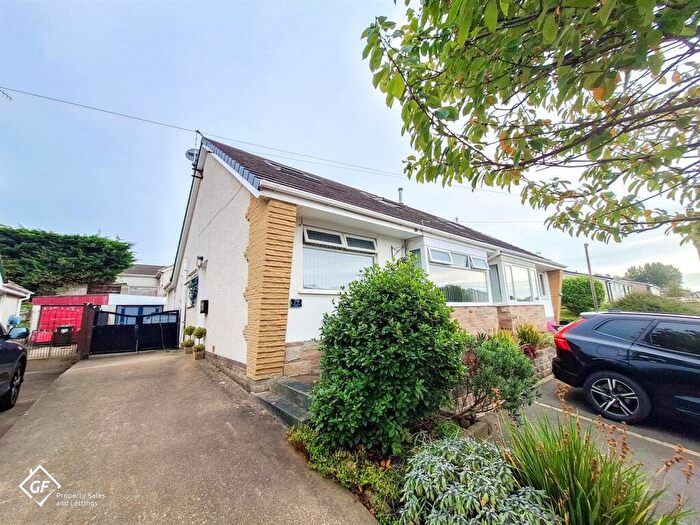
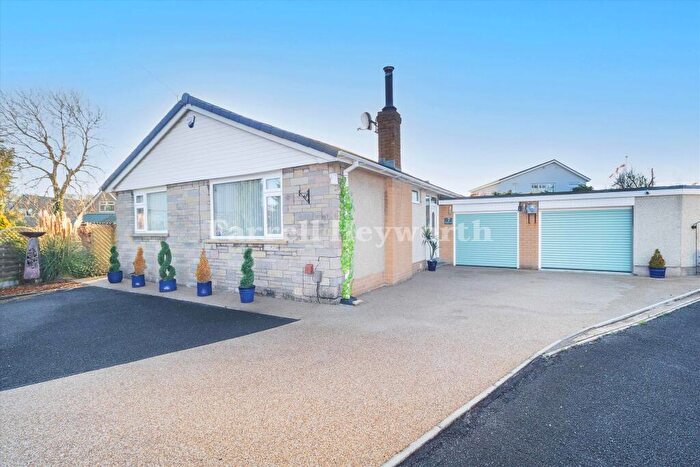
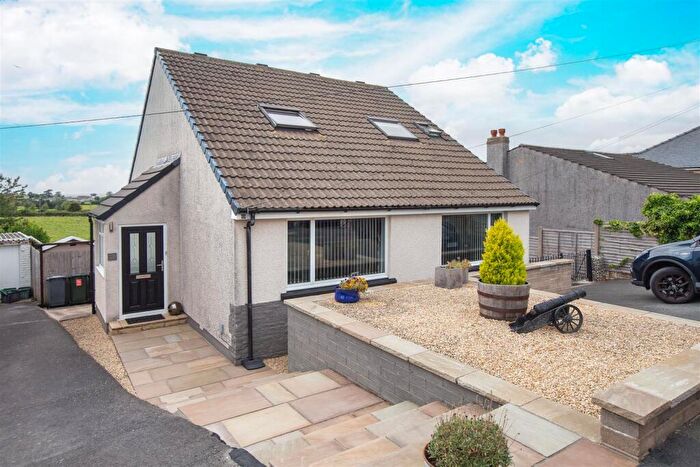
Houses for sale & to rent in Bolton-le-sands, Carnforth
House Prices in Bolton-le-sands
Properties in Bolton-le-sands have an average house price of £265,672.00 and had 152 Property Transactions within the last 3 years¹.
Bolton-le-sands is an area in Carnforth, Lancashire with 1,803 households², where the most expensive property was sold for £885,000.00.
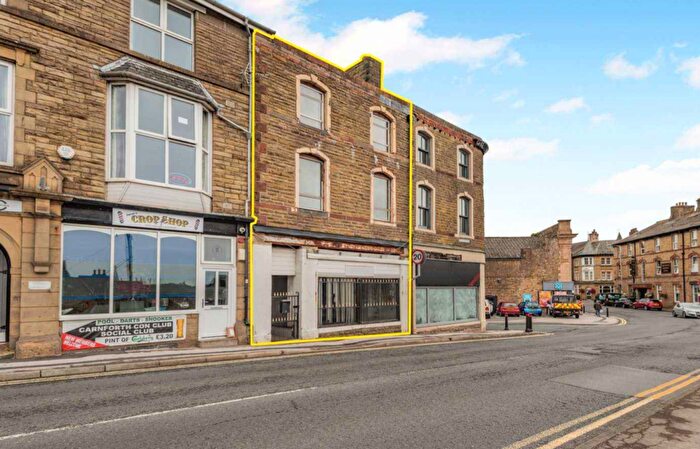
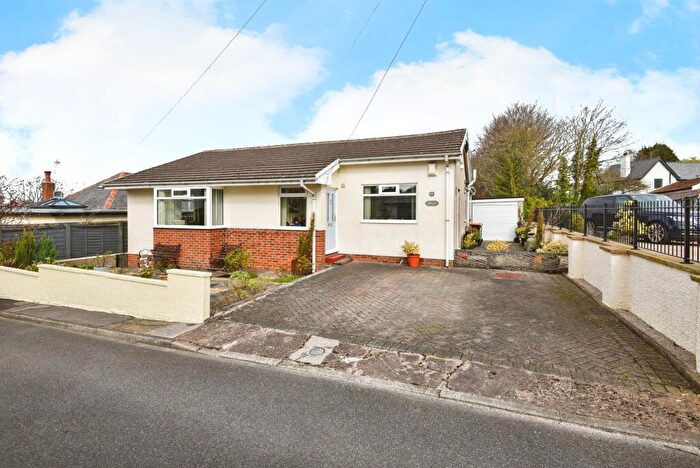
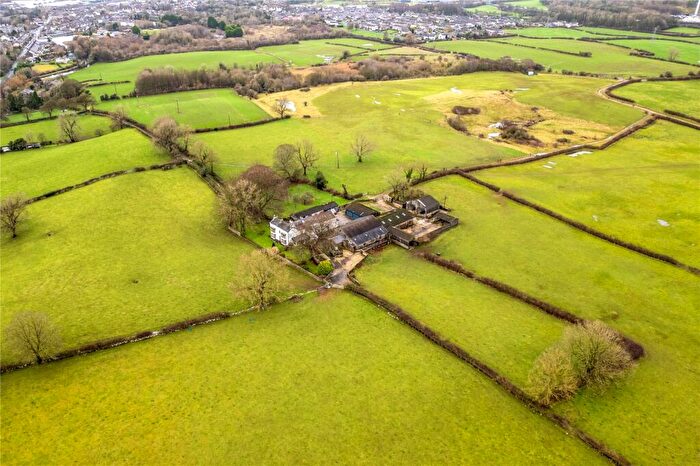
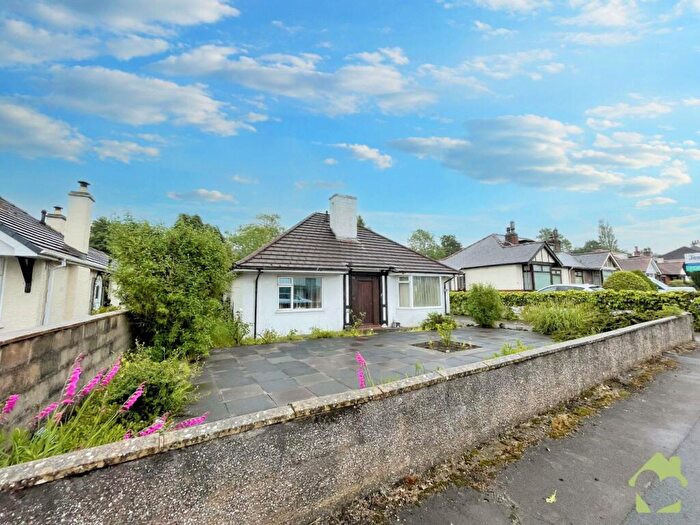
Properties for sale in Bolton-le-sands
Roads and Postcodes in Bolton-le-sands
Navigate through our locations to find the location of your next house in Bolton-le-sands, Carnforth for sale or to rent.
| Streets | Postcodes |
|---|---|
| Acorn Meadow | LA5 8JL |
| Alpine View | LA5 8EP |
| Ancliffe Lane | LA5 8DS |
| Beech Tree Close | LA5 8BF |
| Bolton Lane | LA5 8BL |
| Bowland Close | LA5 9UP |
| Bridge Croft | LA5 8JG |
| Brookfield Close | LA5 8EF |
| Brookfield View | LA5 8DJ |
| Browsholme Close | LA5 9UW |
| Bye Pass Road | LA5 8JA LA5 8JD |
| Byron Avenue | LA5 8HN |
| Calder Close | LA5 9UT |
| Canal Gardens | LA5 8EE |
| Cavendish Court | LA5 8ED |
| Chestnut Avenue | LA5 8HD |
| Church Brow | LA5 8DY LA5 8DZ |
| Church Court | LA5 8EB |
| Clarksfield Road | LA5 8JE |
| Claylands Drive | LA5 8LN |
| Coniston Road | LA5 8LQ |
| Crag Bank Crescent | LA5 9EQ |
| Crag Bank Road | LA5 9EG LA5 9EH LA5 9GX LA5 9GY LA5 9JA LA5 9JB LA5 9JH |
| Croasdale Close | LA5 9UN |
| Croftland Gardens | LA5 8FB |
| Cross Hill Court | LA5 8EG |
| Eden Grove | LA5 8DF |
| Fern Lea | LA5 8HU |
| Gordon Cottages | LA5 8BZ |
| Greengate Lane | LA5 9JJ |
| Hawthorn Road | LA5 8BY LA5 8EH LA5 8EY |
| Hillcrest Avenue | LA5 8JX |
| Howard Mews | LA5 9UH |
| Hunting Hill Road | LA5 9JQ |
| Jesson Way | LA5 9UR |
| Johnson Close | LA5 9UJ |
| Keats Avenue | LA5 8HH |
| Laburnum Park | LA5 9FB |
| Lancaster Road | LA5 9EF LA5 9TP |
| Lowlands Road | LA5 8HB LA5 8HE |
| Main Road | LA5 8BS LA5 8DH LA5 8DL LA5 8DN LA5 8DQ LA5 8DU LA5 8DX LA5 8EQ |
| Meadow Drive | LA5 8HA |
| Merefell Road | LA5 8EX |
| Mill Lane | LA5 8DG LA5 8ET LA5 8EU LA5 8EZ LA5 8HR |
| Monkswell Avenue | LA5 8JY |
| Monkswell Drive | LA5 8JZ |
| Orchard Avenue | LA5 8HP |
| Packet Lane | LA5 8DW |
| Rose Bank | LA5 9TW |
| Ruskin Grove | LA5 8HL |
| Rydal Road | LA5 8LH LA5 8LJ |
| Shelley Close | LA5 8HQ |
| Slyne Road | LA5 8AG LA5 8AH LA5 8AJ LA5 8AQ |
| St Margarets Road | LA5 8EN |
| St Michaels Close | LA5 8LE |
| St Michaels Crescent | LA5 8LD |
| St Michaels Grove | LA5 8JB |
| St Michaels Lane | LA5 8DP LA5 8JT LA5 8LA LA5 8LB LA5 8LG |
| St Michaels Place | LA5 8LF |
| St Nicholas Crescent | LA5 8BU |
| St Nicholas Lane | LA5 8BT LA5 8EJ LA5 8EL |
| Sunnybank Road | LA5 8HF LA5 8HG LA5 8HS LA5 8HW |
| Tarn Cottages | LA5 8AE |
| Tarnbrook Close | LA5 9UL |
| Tennyson Close | LA5 8HT |
| The Drive | LA5 9JD LA5 9JG |
| The Green | LA5 8FD |
| The Grove | LA5 9JE |
| The Nook | LA5 8DR |
| The Parade | LA5 9JF |
| The Rise | LA5 8BX |
| The Shore | LA5 8JR LA5 8JS |
| Thwaite Brow Lane | LA5 8DE |
| Town End | LA5 8JF |
| Westfield Drive | LA5 8EW |
| Whin Avenue | LA5 8DA |
| Whin Drive | LA5 8DB |
| Whin Grove | LA5 8DD |
| Windermere Road | LA5 8LL |
| Wordsworth Avenue | LA5 8HJ |
| LA5 8AD |
Transport near Bolton-le-sands
- FAQ
- Price Paid By Year
- Property Type Price
Frequently asked questions about Bolton-le-sands
What is the average price for a property for sale in Bolton-le-sands?
The average price for a property for sale in Bolton-le-sands is £265,672. This amount is 8% lower than the average price in Carnforth. There are 602 property listings for sale in Bolton-le-sands.
What streets have the most expensive properties for sale in Bolton-le-sands?
The streets with the most expensive properties for sale in Bolton-le-sands are Bolton Lane at an average of £885,000, Ancliffe Lane at an average of £558,000 and Croftland Gardens at an average of £479,416.
What streets have the most affordable properties for sale in Bolton-le-sands?
The streets with the most affordable properties for sale in Bolton-le-sands are Croasdale Close at an average of £100,000, Alpine View at an average of £132,000 and Main Road at an average of £159,000.
Which train stations are available in or near Bolton-le-sands?
Some of the train stations available in or near Bolton-le-sands are Carnforth, Bare Lane and Silverdale.
Property Price Paid in Bolton-le-sands by Year
The average sold property price by year was:
| Year | Average Sold Price | Price Change |
Sold Properties
|
|---|---|---|---|
| 2025 | £270,567 | -1% |
48 Properties |
| 2024 | £272,325 | 7% |
58 Properties |
| 2023 | £252,173 | -9% |
46 Properties |
| 2022 | £274,817 | 14% |
81 Properties |
| 2021 | £236,448 | 6% |
102 Properties |
| 2020 | £222,795 | 10% |
94 Properties |
| 2019 | £200,864 | -6% |
72 Properties |
| 2018 | £213,311 | 6% |
65 Properties |
| 2017 | £199,584 | 2% |
85 Properties |
| 2016 | £196,052 | 5% |
70 Properties |
| 2015 | £186,064 | -7% |
60 Properties |
| 2014 | £198,865 | 11% |
81 Properties |
| 2013 | £176,113 | -7% |
60 Properties |
| 2012 | £188,096 | 4% |
51 Properties |
| 2011 | £180,528 | -1% |
61 Properties |
| 2010 | £182,083 | -6% |
65 Properties |
| 2009 | £193,366 | 7% |
63 Properties |
| 2008 | £179,170 | -4% |
46 Properties |
| 2007 | £185,890 | 6% |
80 Properties |
| 2006 | £173,866 | 9% |
103 Properties |
| 2005 | £158,443 | -3% |
70 Properties |
| 2004 | £163,289 | 11% |
96 Properties |
| 2003 | £145,142 | 33% |
128 Properties |
| 2002 | £97,804 | 15% |
131 Properties |
| 2001 | £83,236 | 14% |
118 Properties |
| 2000 | £71,553 | -1% |
107 Properties |
| 1999 | £72,277 | 20% |
104 Properties |
| 1998 | £58,020 | -13% |
95 Properties |
| 1997 | £65,289 | 15% |
87 Properties |
| 1996 | £55,461 | -16% |
94 Properties |
| 1995 | £64,268 | - |
85 Properties |
Property Price per Property Type in Bolton-le-sands
Here you can find historic sold price data in order to help with your property search.
The average Property Paid Price for specific property types in the last three years are:
| Property Type | Average Sold Price | Sold Properties |
|---|---|---|
| Semi Detached House | £238,931.00 | 74 Semi Detached Houses |
| Detached House | £332,209.00 | 56 Detached Houses |
| Terraced House | £195,789.00 | 19 Terraced Houses |
| Flat | £125,833.00 | 3 Flats |

