Houses for sale & to rent in Carnforth, Carnforth
House Prices in Carnforth
Properties in Carnforth have an average house price of £184,339.00 and had 208 Property Transactions within the last 3 years¹.
Carnforth is an area in Carnforth, Lancashire with 1,878 households², where the most expensive property was sold for £445,000.00.
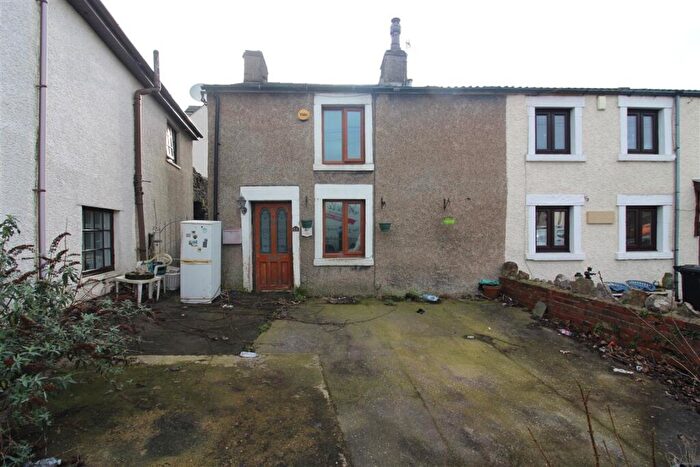
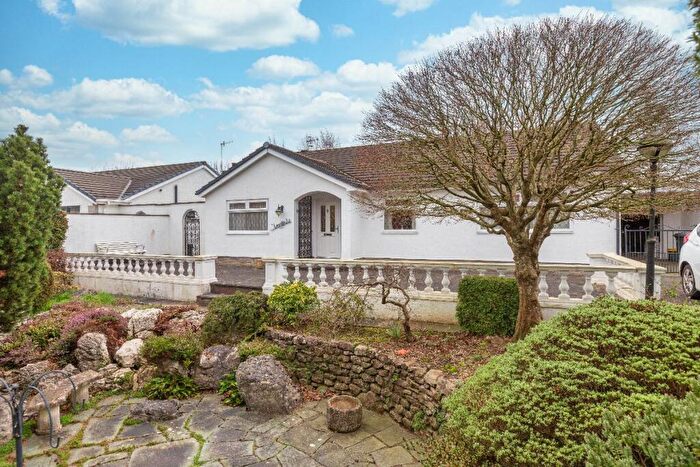
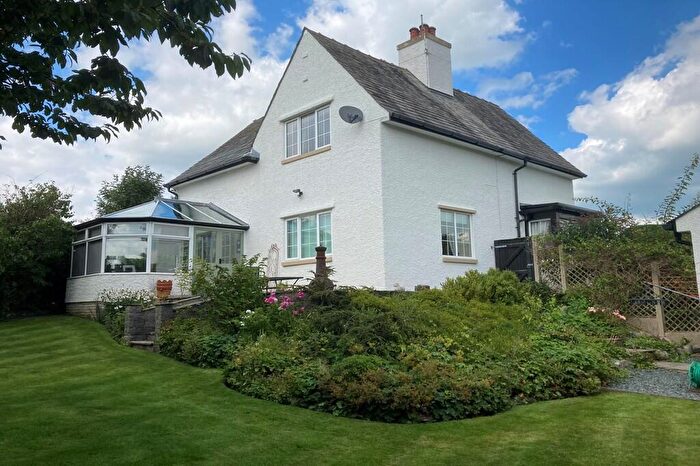
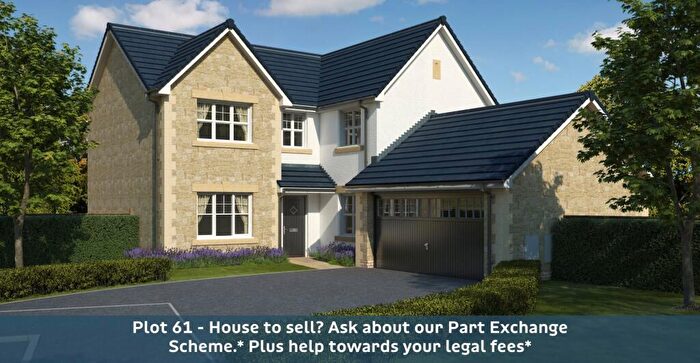
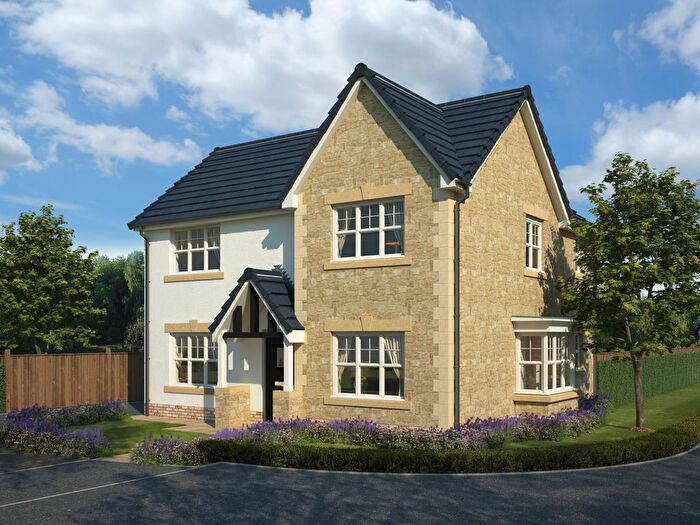
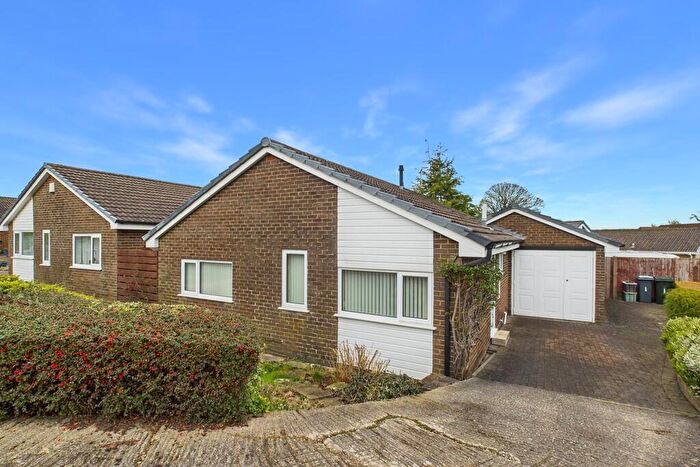
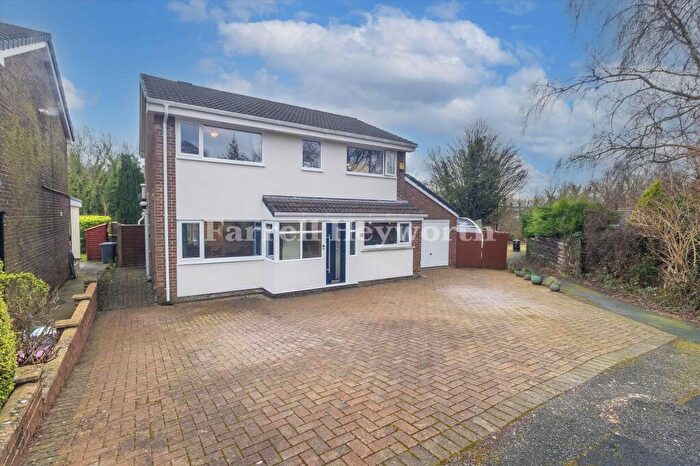
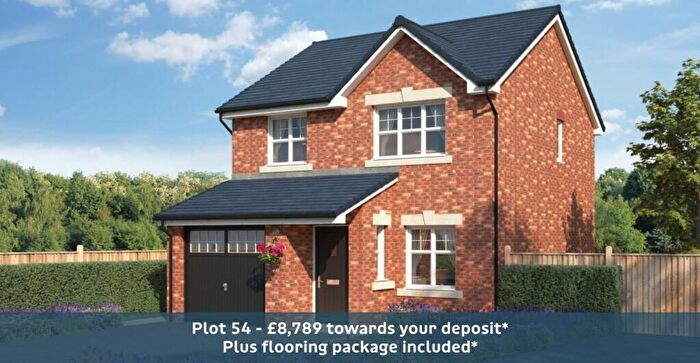
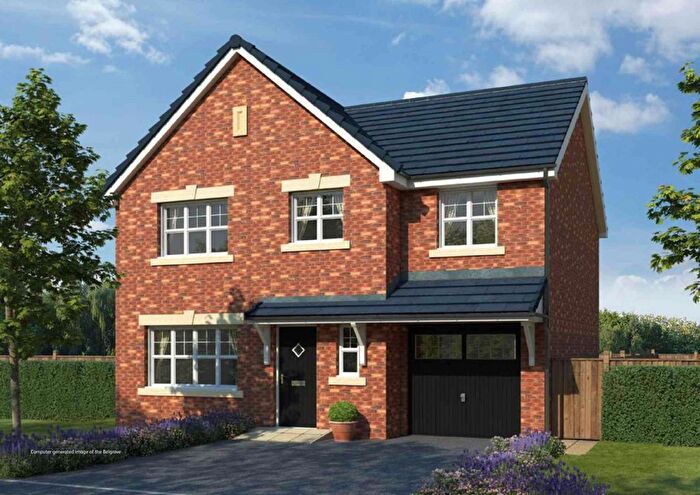
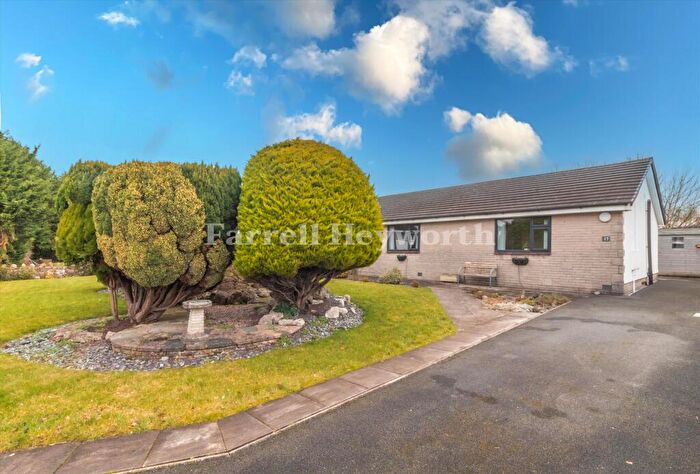
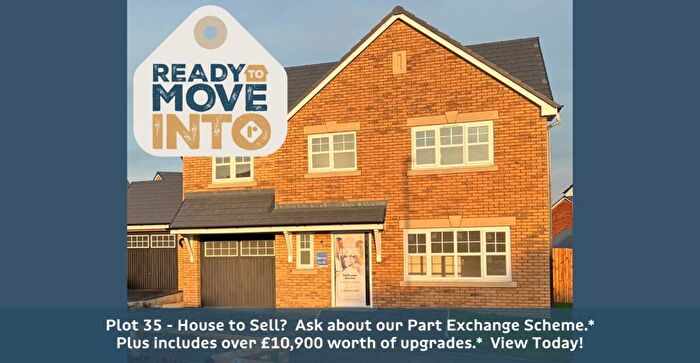
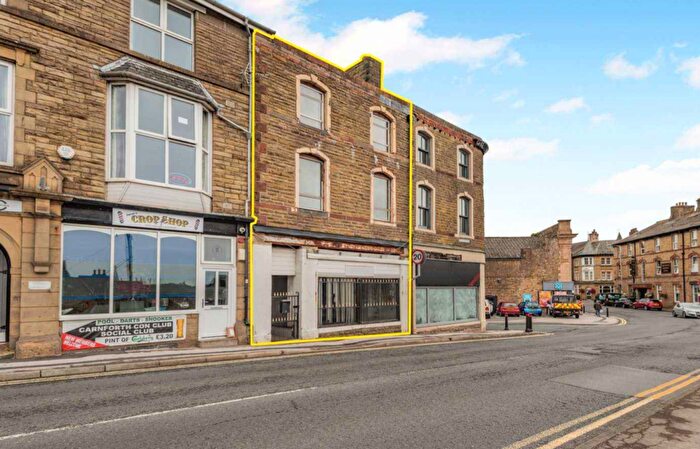
Properties for sale in Carnforth
Roads and Postcodes in Carnforth
Navigate through our locations to find the location of your next house in Carnforth, Carnforth for sale or to rent.
| Streets | Postcodes |
|---|---|
| Alamein Road | LA5 9BB |
| Alexandra Road | LA5 9DT |
| Arkholme Close | LA5 9XF |
| Arnhem Road | LA5 9BD |
| Ashtrees Way | LA5 9BF |
| Back Market Street | LA5 9BZ |
| Bloomfield Park | LA5 9LH |
| Booth Street | LA5 9DF |
| Bridgeside | LA5 9LF |
| Browfoot Close | LA5 9XT |
| Camborne Avenue | LA5 9TS |
| Conder Brow | LA5 9XQ |
| Coniston Road | LA5 9AX LA5 9AZ |
| Coppice Brow | LA5 9XG |
| Crag Bank Road | LA5 9JN |
| Dunkirk Avenue | LA5 9AP LA5 9AW LA5 9BA |
| Eden Mount Way | LA5 9XN |
| Edward Street | LA5 9DA |
| Fairfield Close | LA5 9XL |
| Fern Bank | LA5 9DS |
| Grosvenor Court | LA5 9TX |
| Grosvenor Place | LA5 9DL |
| Grosvenor Road | LA5 9DJ |
| Hard Knott Rise | LA5 9BJ |
| Hawk Street | LA5 9LA LA5 9LZ |
| Haws Avenue | LA5 9DH |
| Haws Hill | LA5 9DD LA5 9DG |
| Highfield Road | LA5 9AH LA5 9AJ LA5 9AL LA5 9BE LA5 9BG |
| Hill Street | LA5 9DY |
| Hindburn Close | LA5 9XW |
| Hunter Street | LA5 9BP |
| Ingleborough View | LA5 9AT |
| Keer Villas | LA5 9EY |
| Kellet Road | LA5 9LN LA5 9LP LA5 9LR LA5 9LS LA5 9XJ |
| King Street | LA5 9DU |
| Kings Drive | LA5 9AF LA5 9AG LA5 9AN |
| Lancaster Road | LA5 9EA LA5 9EE LA5 9LD LA5 9LE |
| Langdale Road | LA5 9AU |
| Longacre Close | LA5 9EN |
| Longfield Drive | LA5 9EJ |
| Longmere Crescent | LA5 9EW |
| Market Street | LA5 9JX LA5 9LL |
| Midland Terrace | LA5 9EZ |
| New Acres | LA5 9XD |
| New Street | LA5 9BX |
| North Road | LA5 9LJ LA5 9LQ LA5 9LU LA5 9LX LA5 9NA LA5 9NG LA6 1AA |
| Oliver Place | LA5 9LY |
| Oxford Street | LA5 9LG |
| Pond Street | LA5 9BN |
| Pond Terrace | LA5 9BL |
| Preston Street | LA5 9BY |
| Prince Avenue | LA5 9AD |
| Queen Street | LA5 9EB |
| Queens Drive | LA5 9AE |
| Ramsden Street | LA5 9BW |
| Redmayne Drive | LA5 9XA LA5 9XB |
| Redruth Drive | LA5 9TT |
| Russell Road | LA5 9AQ |
| Scotland Road | LA5 9JY LA5 9JZ |
| Shore Road | LA5 9HY |
| St Austell Place | LA5 9TU |
| Stanley Street | LA5 9DX |
| Towpath Walk | LA5 9JS |
| Ullswater Crescent | LA5 9AY |
| Victoria Street | LA5 9DP LA5 9ED |
| Wartonwood View | LA5 9DE |
| Whernside Grove | LA5 9XH |
| Windermere Road | LA5 9AR LA5 9AS |
| Yealand Grove | LA5 9XE |
| LA5 9EL |
Transport near Carnforth
- FAQ
- Price Paid By Year
- Property Type Price
Frequently asked questions about Carnforth
What is the average price for a property for sale in Carnforth?
The average price for a property for sale in Carnforth is £184,339. This amount is 36% lower than the average price in Carnforth. There are 478 property listings for sale in Carnforth.
What streets have the most expensive properties for sale in Carnforth?
The streets with the most expensive properties for sale in Carnforth are St Austell Place at an average of £352,500, New Acres at an average of £340,000 and Crag Bank Road at an average of £335,000.
What streets have the most affordable properties for sale in Carnforth?
The streets with the most affordable properties for sale in Carnforth are Fairfield Close at an average of £75,000, Hard Knott Rise at an average of £122,500 and Ramsden Street at an average of £123,000.
Which train stations are available in or near Carnforth?
Some of the train stations available in or near Carnforth are Carnforth, Silverdale and Bare Lane.
Property Price Paid in Carnforth by Year
The average sold property price by year was:
| Year | Average Sold Price | Price Change |
Sold Properties
|
|---|---|---|---|
| 2025 | £187,232 | 1% |
61 Properties |
| 2024 | £185,436 | 3% |
76 Properties |
| 2023 | £180,678 | -12% |
71 Properties |
| 2022 | £202,371 | 8% |
86 Properties |
| 2021 | £186,450 | 12% |
104 Properties |
| 2020 | £163,585 | -1% |
95 Properties |
| 2019 | £164,589 | 1% |
113 Properties |
| 2018 | £162,292 | 4% |
130 Properties |
| 2017 | £155,698 | 6% |
79 Properties |
| 2016 | £145,896 | -3% |
75 Properties |
| 2015 | £150,279 | 8% |
69 Properties |
| 2014 | £137,762 | - |
79 Properties |
| 2013 | £137,783 | -4% |
65 Properties |
| 2012 | £142,923 | 7% |
67 Properties |
| 2011 | £133,630 | -2% |
64 Properties |
| 2010 | £136,698 | -18% |
40 Properties |
| 2009 | £161,900 | 7% |
56 Properties |
| 2008 | £151,366 | -6% |
72 Properties |
| 2007 | £161,165 | 15% |
126 Properties |
| 2006 | £136,781 | 11% |
140 Properties |
| 2005 | £121,314 | 2% |
74 Properties |
| 2004 | £118,890 | 27% |
125 Properties |
| 2003 | £87,154 | 28% |
145 Properties |
| 2002 | £63,044 | 9% |
130 Properties |
| 2001 | £57,678 | 14% |
107 Properties |
| 2000 | £49,692 | -10% |
93 Properties |
| 1999 | £54,846 | 2% |
77 Properties |
| 1998 | £53,519 | 9% |
94 Properties |
| 1997 | £48,631 | 1% |
80 Properties |
| 1996 | £48,201 | 5% |
71 Properties |
| 1995 | £46,030 | - |
66 Properties |
Property Price per Property Type in Carnforth
Here you can find historic sold price data in order to help with your property search.
The average Property Paid Price for specific property types in the last three years are:
| Property Type | Average Sold Price | Sold Properties |
|---|---|---|
| Semi Detached House | £203,009.00 | 43 Semi Detached Houses |
| Detached House | £275,736.00 | 36 Detached Houses |
| Terraced House | £154,205.00 | 118 Terraced Houses |
| Flat | £135,491.00 | 11 Flats |

