
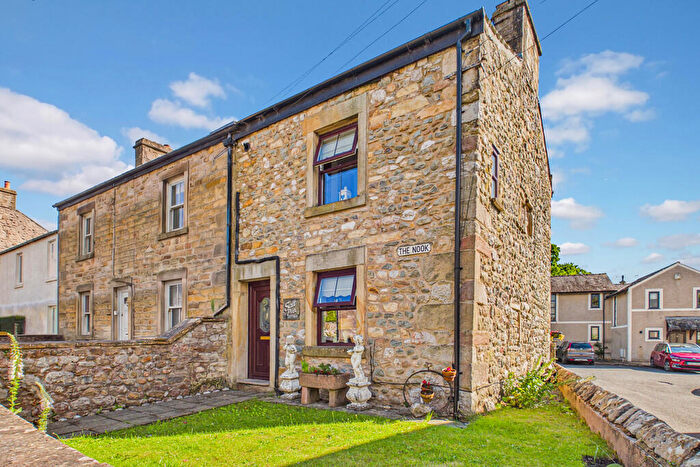
Houses for sale in Bolton & Slyne, Carnforth
House Prices in Bolton & Slyne
Properties in Bolton & Slyne have an average house price of £320k and had 9 Property Transactions within the last 3 years¹.
Bolton & Slyne is an area in Carnforth, Lancashire with 112 households², where the most expensive property was sold for £510k.
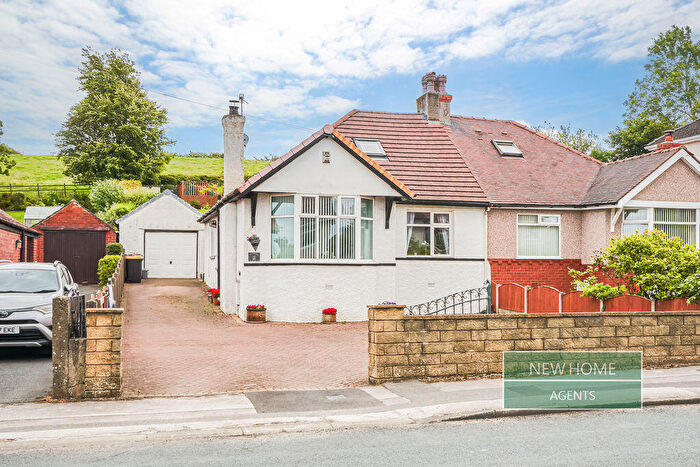
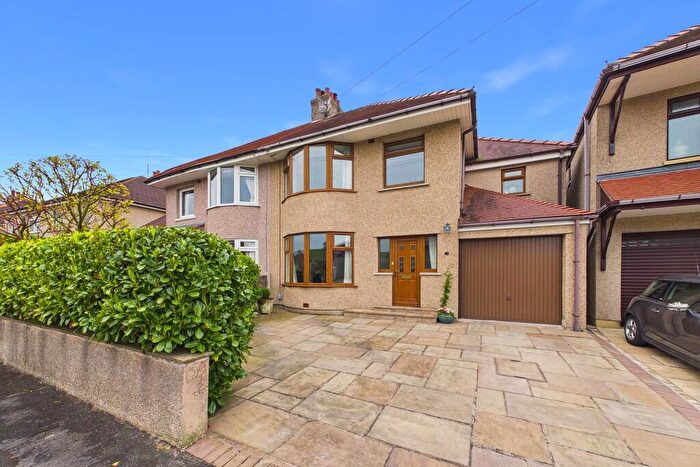
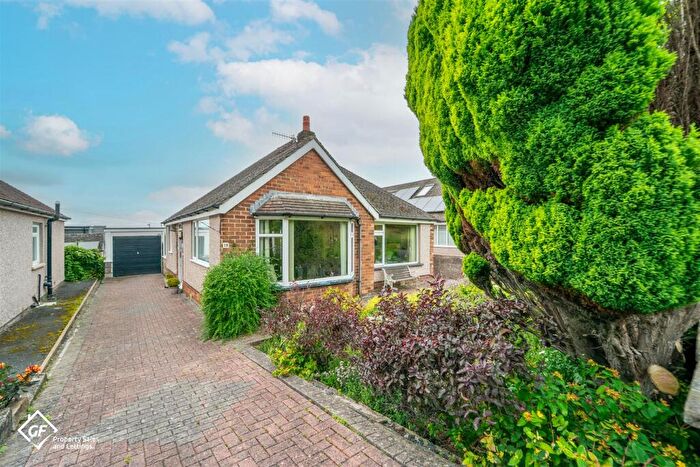
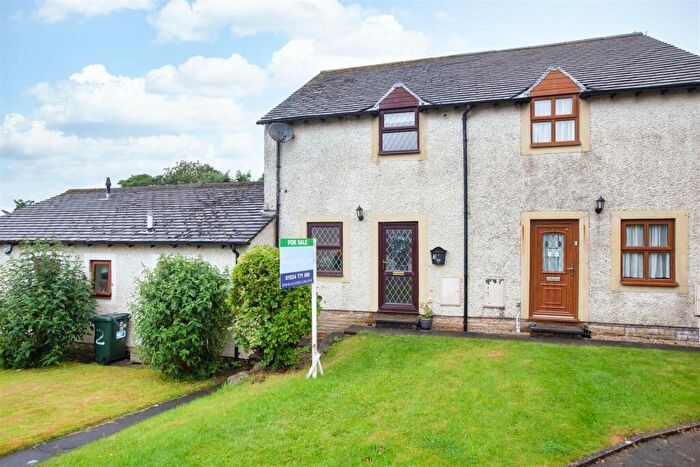
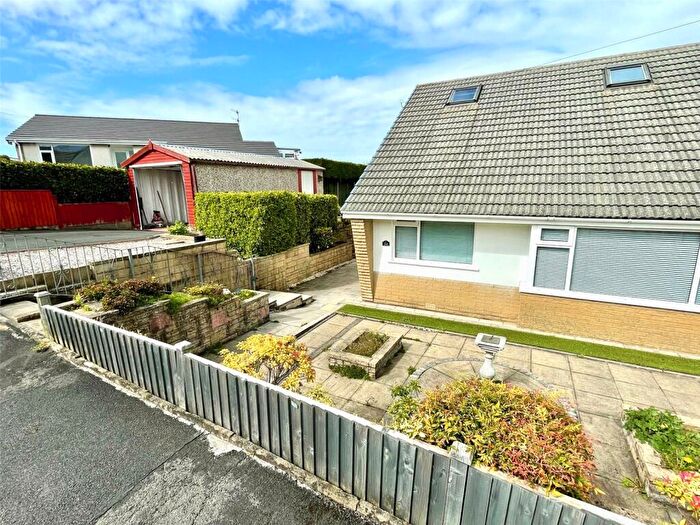
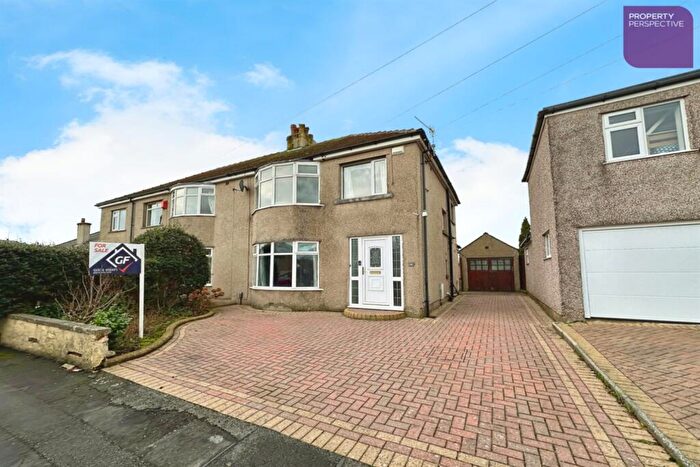
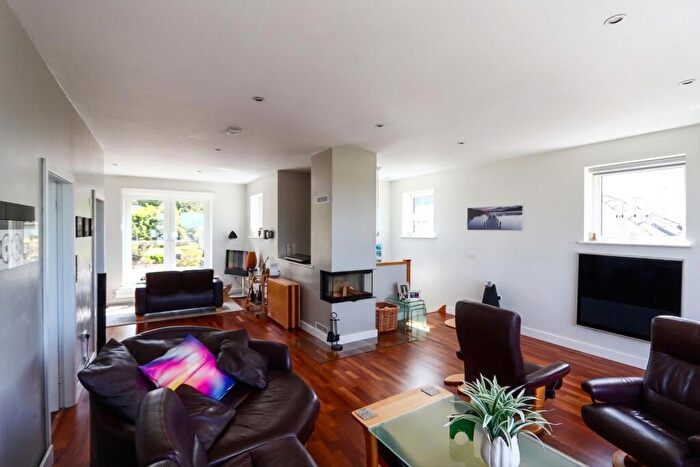
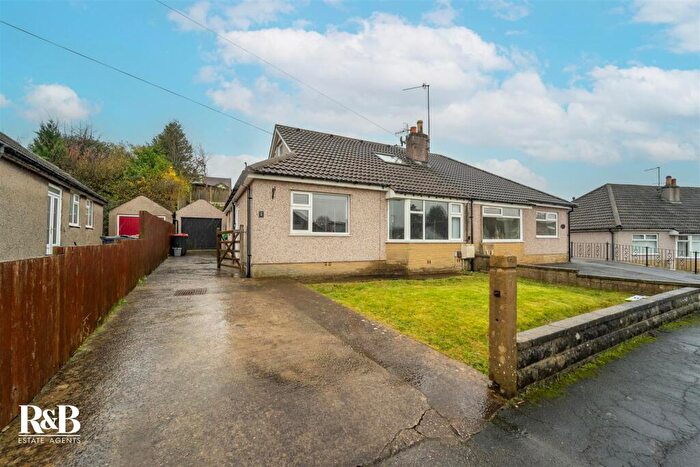
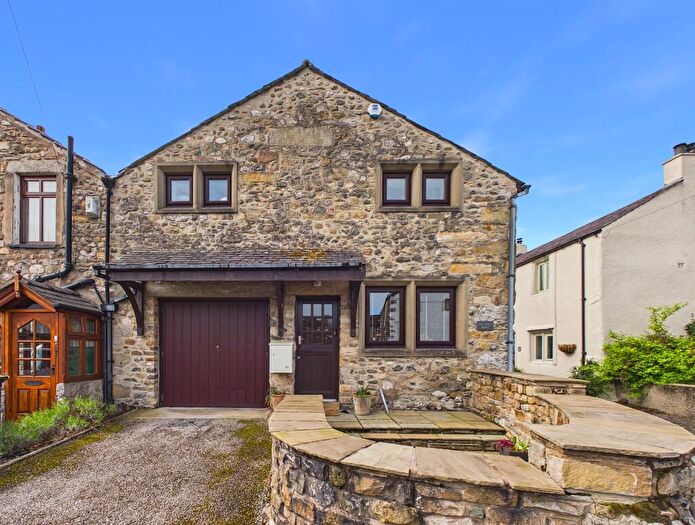
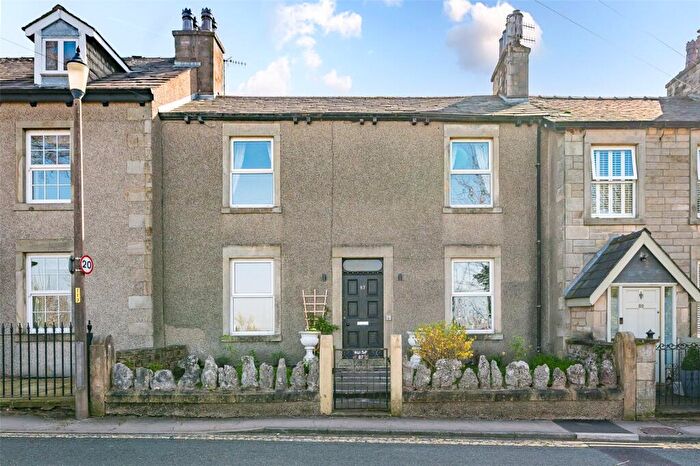
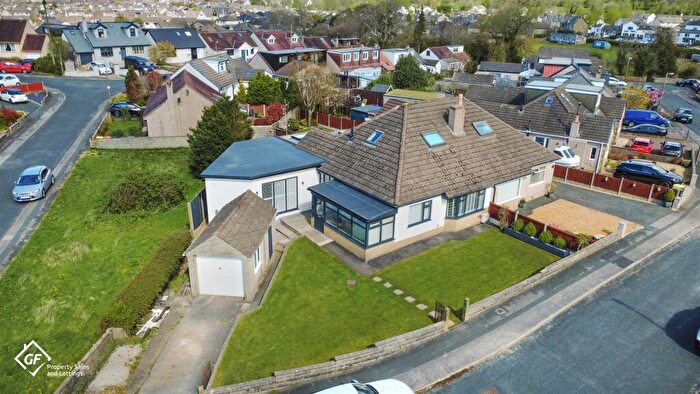
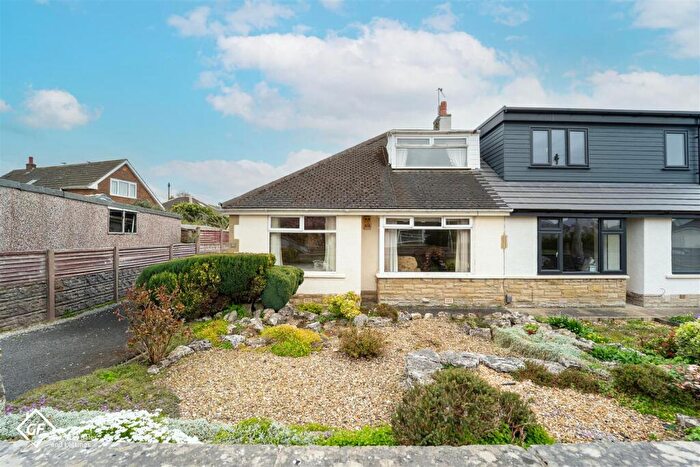
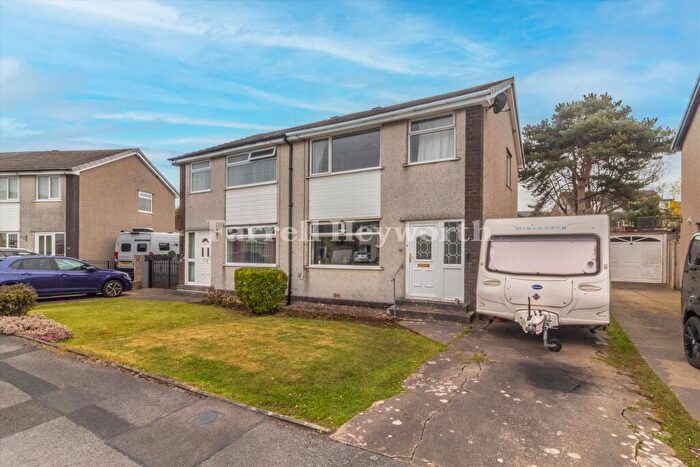
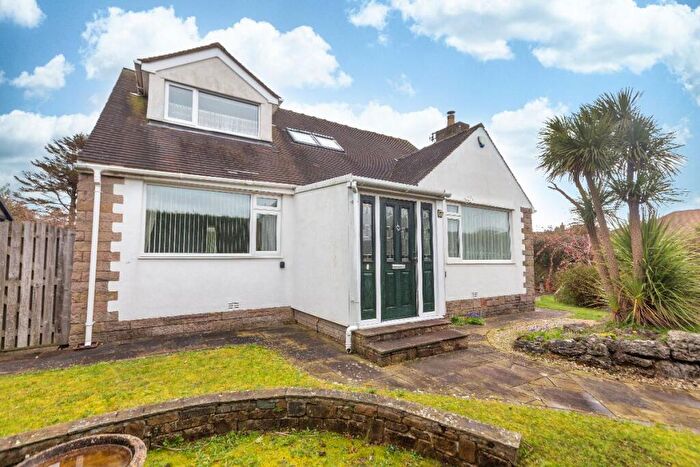
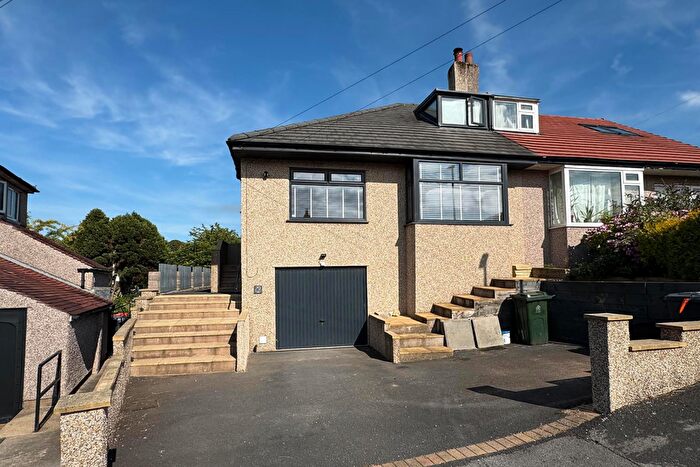
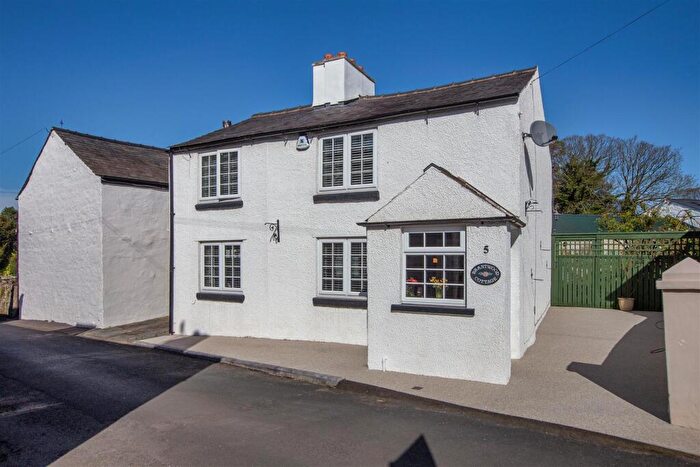
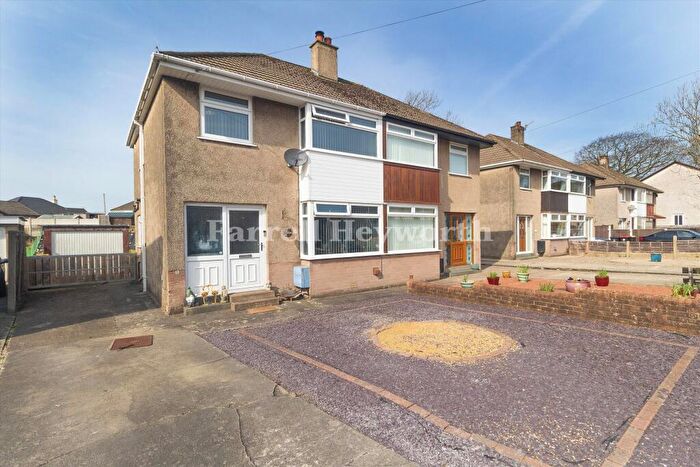
Properties for sale in Bolton & Slyne
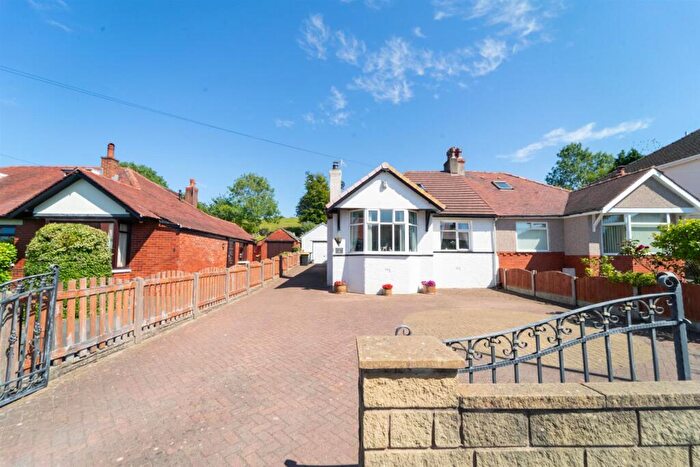
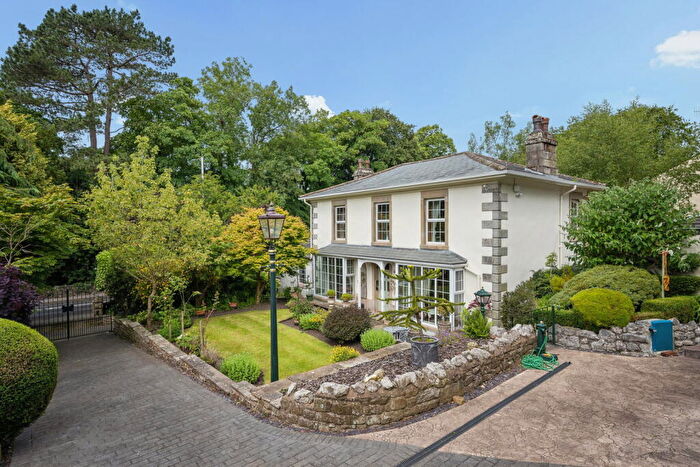
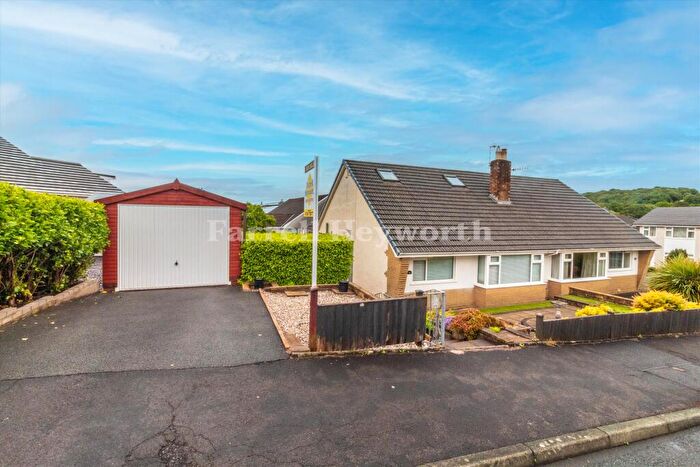
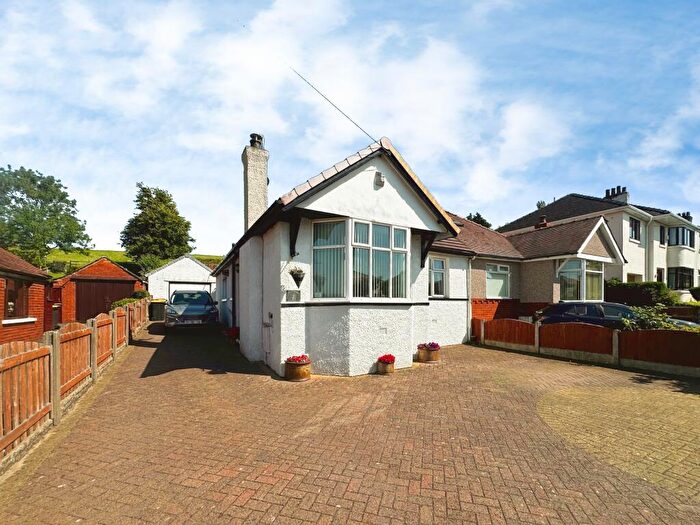
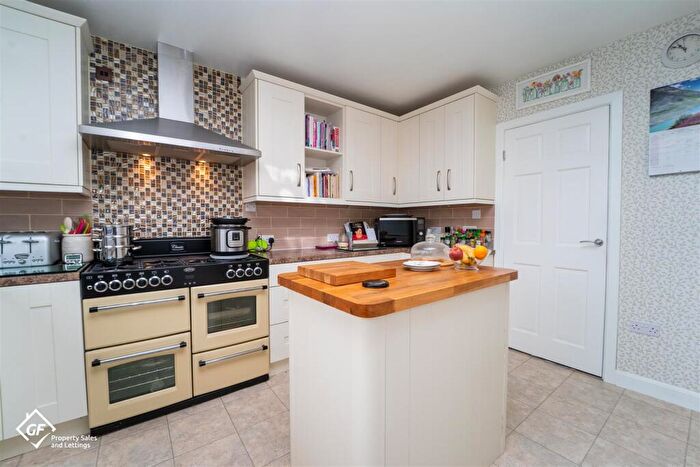
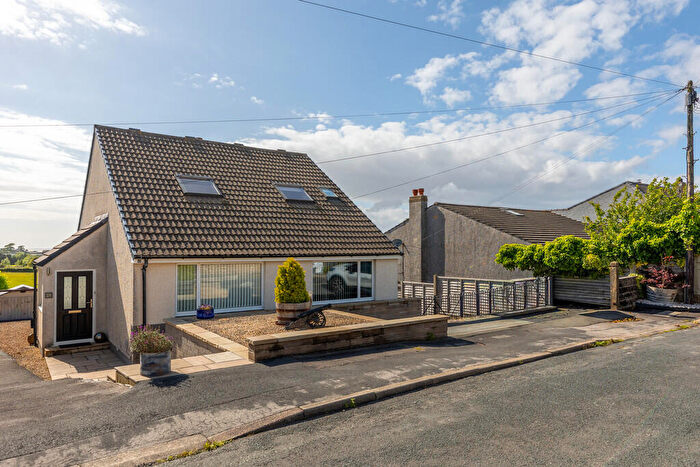
![]()
If you are looking to sell your house, let it out, or receive a property valuation, an expert can help you.
Click the button below to get started.
Roads and Postcodes in Bolton & Slyne
Navigate through our locations to find the location of your next house in Bolton & Slyne, Carnforth for sale or to rent.
| Streets | Postcodes |
|---|---|
| Back St Michaels Grove | LA5 8LS |
| Church Brow Close | LA5 8EA |
| Greenwood Court | LA5 8BB |
| Mount Pleasant Lane | LA5 8DT |
| Pasture Lane | LA5 8LP |
| Shore Lane | LA5 8JP |
| Slyne Road | LA5 8AL |
| Swallow Close | LA5 8BN |
| LA5 8BP LA5 8ER LA5 8ES LA5 9TN |
Property price trends in Bolton & Slyne
According to the latest Land Registry data, the average home in Bolton & Slyne sold for £395,000 in 2026. That figure comes from 90 sales logged over the past 18 years.
Prices have continued to climb over the last three years. Compared with 2023, when the typical sale came in around £287,000, that's a rise of roughly 37.6%.
Looking back five years, average prices are down about 1.9% since 2021, a drop of around £7,500 in cash terms.
Zoom out to the past decade for the fuller picture. Back in 2016, homes here averaged £322,941, so the typical sold price has climbed about 22.3% since then, roughly 2% a year.
Frequently asked questions about Bolton & Slyne
What is the average price for a property for sale in Bolton & Slyne?
The average price for a property for sale in Bolton & Slyne is £319,611. This amount is 11% higher than the average price in Carnforth. There are 300 property listings for sale in Bolton & Slyne.
Which train stations are available in or near Bolton & Slyne?
Some of the train stations available in or near Bolton & Slyne are Carnforth, Bare Lane and Morecambe.
Property Price Paid in Bolton & Slyne by Year
The average sold property price by year was:
| Year | Average Sold Price | Price Change |
Sold Properties
|
|---|---|---|---|
| 2026 | £395,000 | 15% |
1 Property |
| 2025 | £335,900 | 32% |
5 Properties |
| 2024 | £228,000 | -26% |
1 Property |
| 2023 | £287,000 | -40% |
2 Properties |
| 2021 | £402,500 | 39% |
2 Properties |
| 2020 | £243,618 | -15% |
24 Properties |
| 2019 | £280,000 | -5% |
1 Property |
| 2018 | £293,237 | -3% |
4 Properties |
| 2017 | £301,892 | -7% |
20 Properties |
| 2016 | £322,941 | 15% |
18 Properties |
Property Price per Property Type in Bolton & Slyne
Here you can find historic sold price data in order to help with your property search.
The average Property Paid Price for specific property types in the last three years are:
| Property Type | Average Sold Price | Sold Properties |
|---|---|---|
| Terraced House | £161,250.00 | 2 Terraced Houses |
| Flat | £64,000.00 | 1 Flat |
| Detached House | £415,000.00 | 6 Detached Houses |
