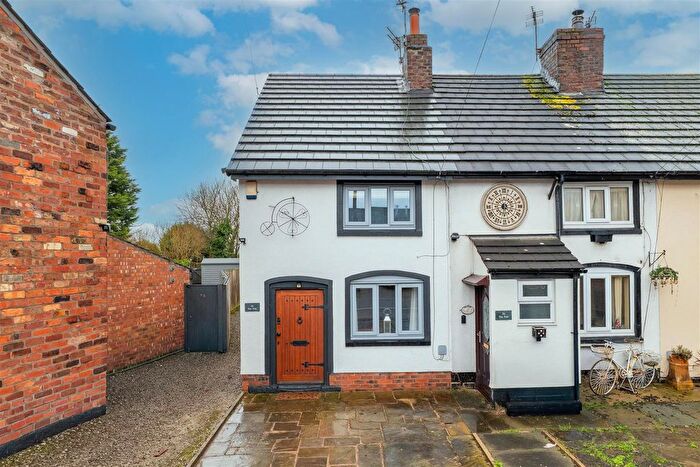
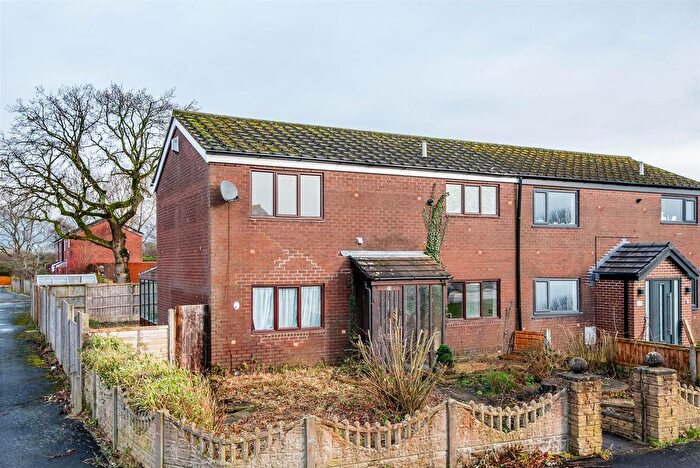
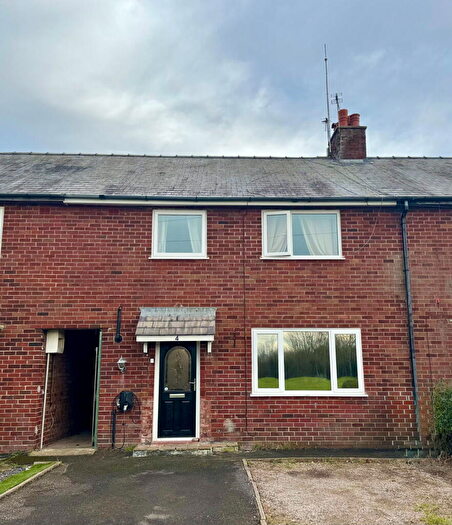
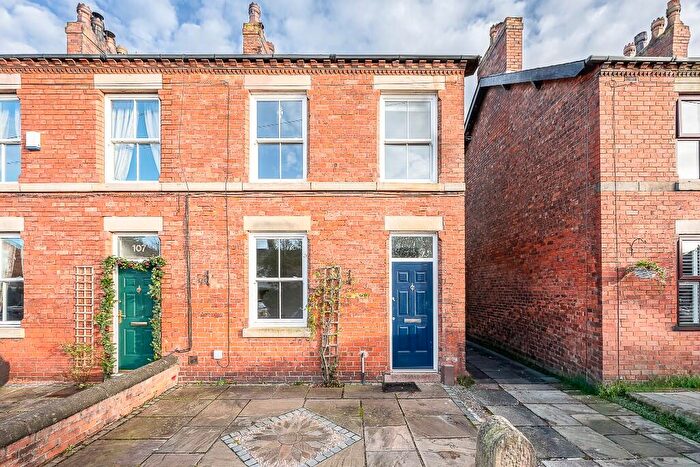
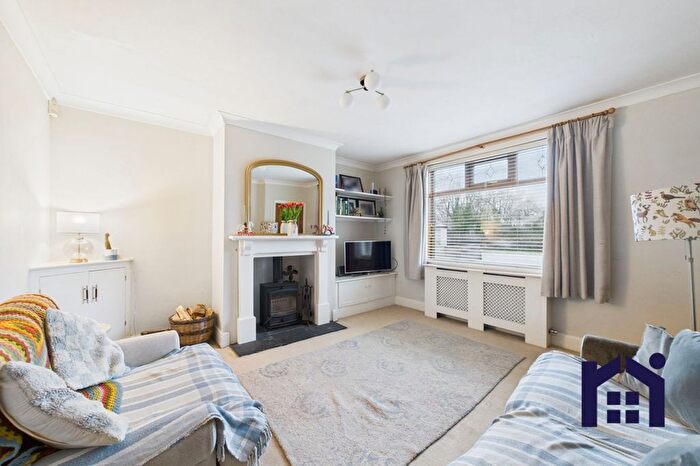
Houses for sale & to rent in Lostock, Leyland
House Prices in Lostock
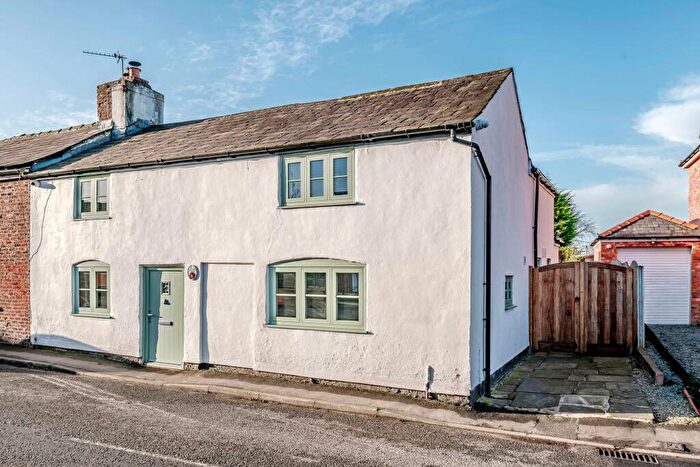
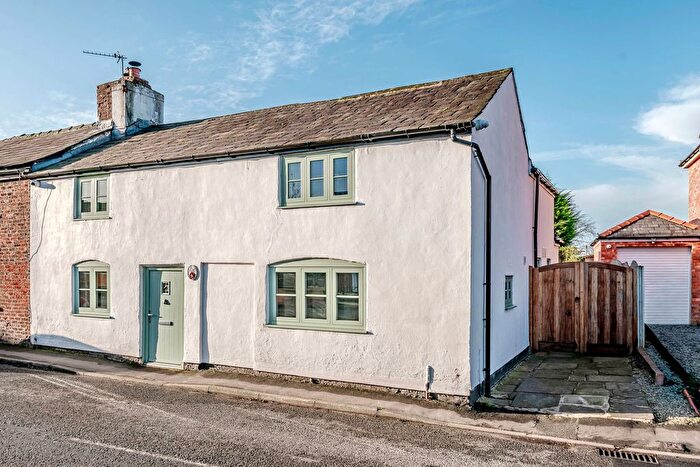
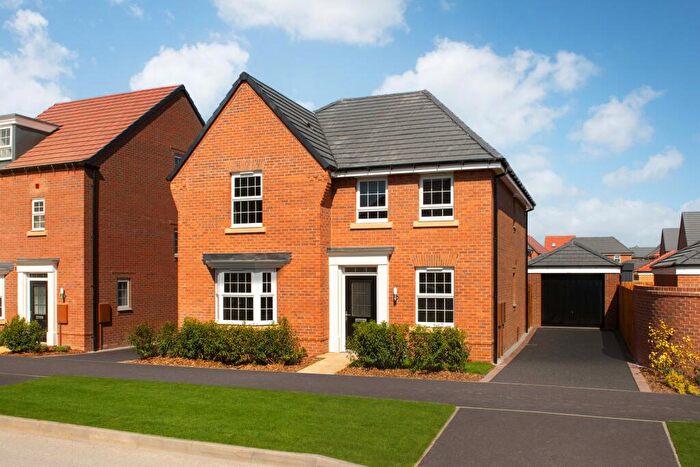
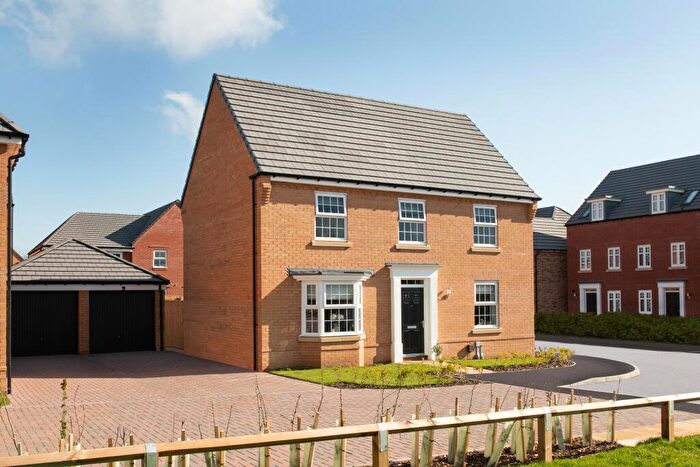
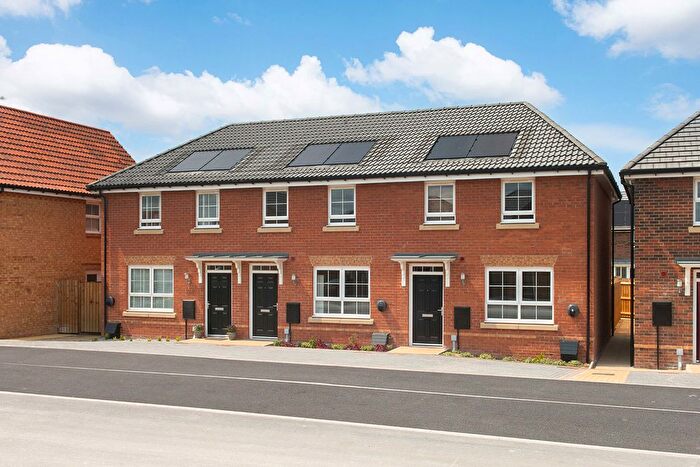
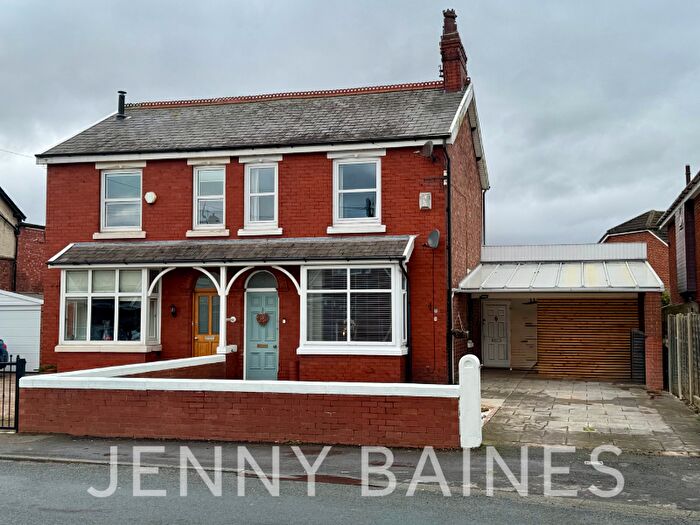
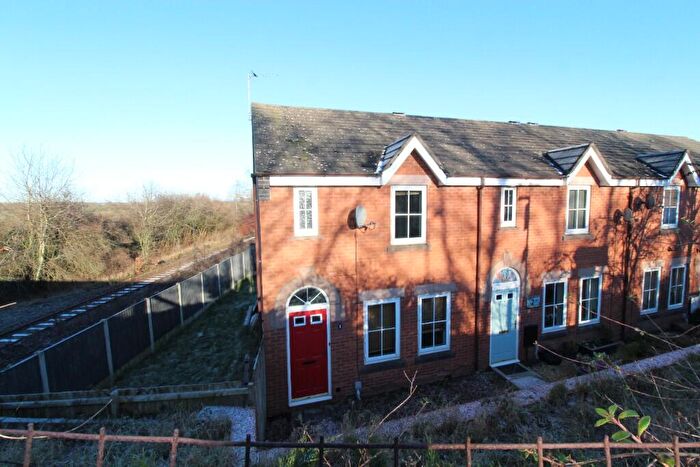
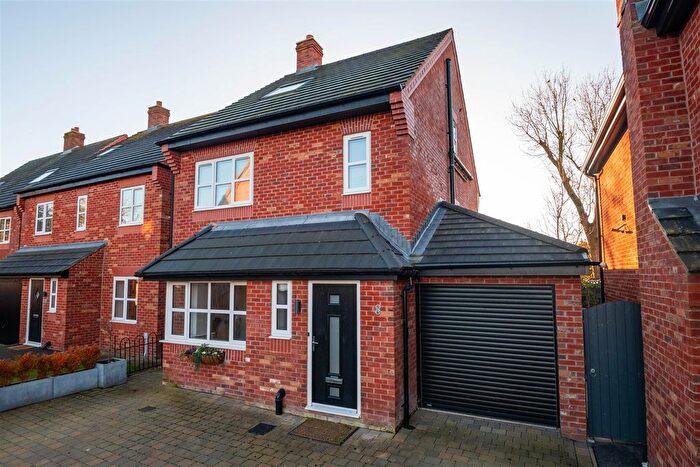
Properties in Lostock have an average house price of £333,709.00 and had 167 Property Transactions within the last 3 years¹.
Lostock is an area in Leyland, Lancashire with 1,788 households², where the most expensive property was sold for £1,350,000.00.
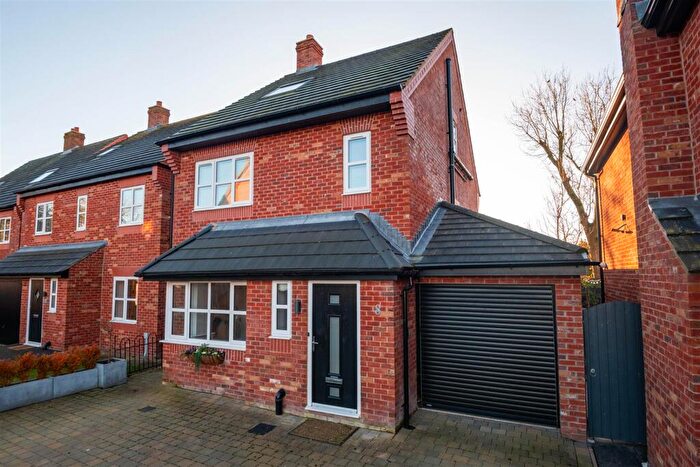
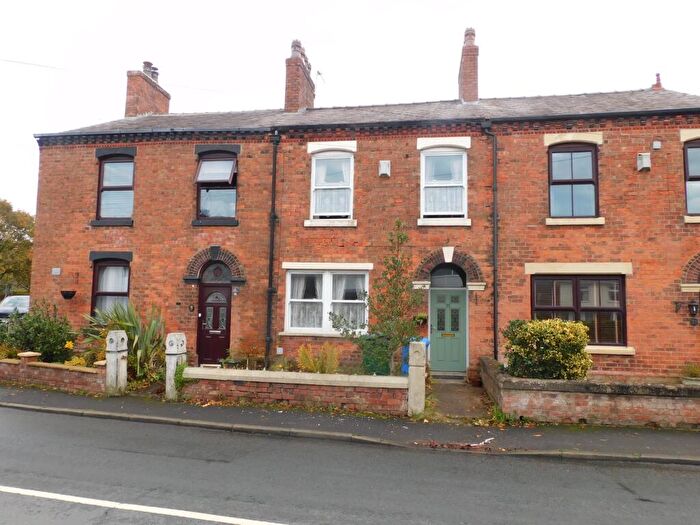
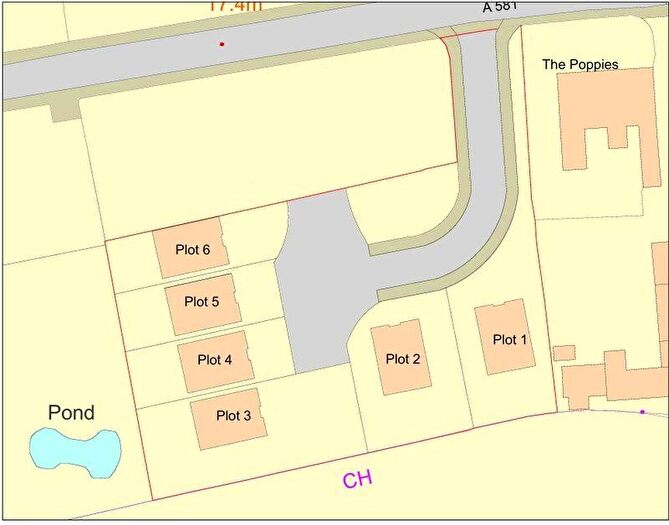
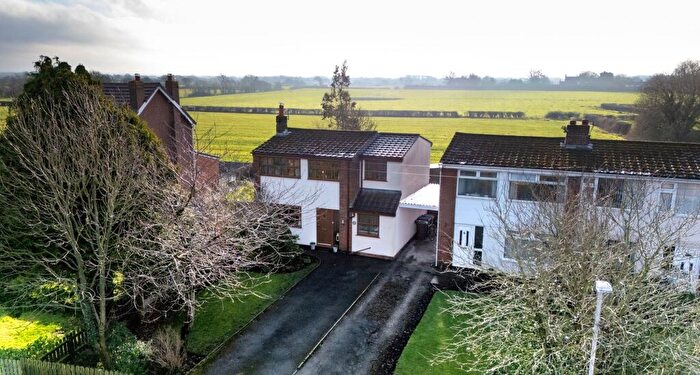
Properties for sale in Lostock
Roads and Postcodes in Lostock
Navigate through our locations to find the location of your next house in Lostock, Leyland for sale or to rent.
| Streets | Postcodes |
|---|---|
| Back Drinkhouse Lane | PR26 9JL |
| Bamfords Fold | PR26 9AL |
| Bramblewood | PR26 9RG |
| Brookfield | PR26 9HY |
| Carr House Lane | PR26 9AR |
| Carvers Brow | PR26 9JD |
| Castle Walks | PR26 9RH |
| Church Street | PR26 9HA |
| Cock Robin Cottages | PR26 9HG |
| Cocker Bar Road | PR26 7TA PR26 9AZ |
| Coniston Way | PR26 9SD |
| Coronation Court | PR26 9HF |
| Cottage Lane | PR26 9JJ |
| Cutt Close | PR26 8NJ |
| Drinkhouse Road | PR26 9JE PR26 9JH |
| Eyes Lane | PR26 9AS |
| Finney Lane | PR26 9JQ |
| Flag Lane | PR26 9AD |
| Glover Close | PR26 8NL |
| Grape Lane | PR26 9HB |
| Highfield Road | PR26 9HH |
| Holker Lane | PR26 8LL |
| Home Farm Mews | PR26 9JT |
| Jubilee Way | PR26 9HD |
| Langdale Avenue | PR26 9SE |
| Leyland Lane | PR26 8LB |
| Liverpool Road | PR26 9AX |
| Lonsdale Drive | PR26 9SA PR26 9SB |
| Lostock Road | PR26 9HT |
| Marl Cop | PR26 9BD |
| Meadow Lane | PR26 9JP |
| Meadowside | PR26 9QY |
| Melrose Gardens | PR26 9HR |
| Mill Row | PR26 9HZ |
| Moor Road | PR26 9HN PR26 9HP PR26 9HQ |
| Moorhey Cottages | PR26 9AE |
| Moss Lane | PR26 8LX |
| North Road | PR26 9AY |
| Odd House Lane | PR26 9BF |
| Orchard Mill Drive | PR26 9RD |
| Out Lane | PR26 9HJ |
| Pavilion View | PR26 9RW |
| Pear Tree Road | PR26 9HU PR26 9HX |
| Pompian Brow | PR26 9AQ |
| Railway View | PR26 9RY |
| Rectory Close | PR26 9SH |
| Ridley Lane | PR26 9JA |
| Riverside Crescent | PR26 9RU |
| Shevington Causeway | PR26 9JN |
| South Road | PR26 9AB PR26 9AH PR26 9AJ |
| South View | PR26 9AN |
| Southport Road | PR26 8LN PR26 8LP PR26 8LQ |
| Station Road | PR26 9HL PR26 9RJ PR26 9RL PR26 9RN PR26 9RP |
| The Causeway | PR26 8NN |
| The Hillocks | PR26 9RE |
| The Maples | PR26 8NR |
| The Orchard | PR26 9HS |
| Town Road | PR26 9RA PR26 9RB |
| Turflands | PR26 9RX |
| Ulnes Walton Lane | PR26 8LT PR26 8LU |
| Victoria Court | PR26 9HW |
| Wade Brook Road | PR26 8NW |
| Weavers Fold | PR26 9AP |
| Westfields | PR26 9RT |
| Westhead Road | PR26 9RQ PR26 9RR PR26 9RS |
| Willow Road | PR26 8NP |
| Wray Crescent | PR26 8NH |
| Yarrow Close | PR26 9SJ |
| PR26 9AT |
Transport near Lostock
-
Croston Station
-
Rufford Station
-
Leyland Station
-
Euxton Balshaw Lane Station
-
Buckshaw Parkway Station
- FAQ
- Price Paid By Year
- Property Type Price
Frequently asked questions about Lostock
What is the average price for a property for sale in Lostock?
The average price for a property for sale in Lostock is £333,709. This amount is 49% higher than the average price in Leyland. There are 813 property listings for sale in Lostock.
What streets have the most expensive properties for sale in Lostock?
The streets with the most expensive properties for sale in Lostock are Odd House Lane at an average of £1,150,000, Flag Lane at an average of £995,000 and The Hillocks at an average of £750,000.
What streets have the most affordable properties for sale in Lostock?
The streets with the most affordable properties for sale in Lostock are Mill Row at an average of £95,000, Wray Crescent at an average of £118,750 and Wade Brook Road at an average of £126,500.
Which train stations are available in or near Lostock?
Some of the train stations available in or near Lostock are Croston, Rufford and Leyland.
Property Price Paid in Lostock by Year
The average sold property price by year was:
| Year | Average Sold Price | Price Change |
Sold Properties
|
|---|---|---|---|
| 2025 | £298,224 | -21% |
49 Properties |
| 2024 | £361,731 | 8% |
65 Properties |
| 2023 | £332,150 | 12% |
53 Properties |
| 2022 | £293,629 | -6% |
70 Properties |
| 2021 | £310,874 | 0,3% |
82 Properties |
| 2020 | £309,867 | 8% |
55 Properties |
| 2019 | £284,414 | 20% |
65 Properties |
| 2018 | £227,918 | -4% |
81 Properties |
| 2017 | £236,074 | 16% |
93 Properties |
| 2016 | £198,034 | -41% |
60 Properties |
| 2015 | £278,627 | 9% |
72 Properties |
| 2014 | £253,781 | 12% |
77 Properties |
| 2013 | £223,459 | 5% |
44 Properties |
| 2012 | £212,121 | -15% |
49 Properties |
| 2011 | £244,664 | 4% |
48 Properties |
| 2010 | £235,595 | -14% |
32 Properties |
| 2009 | £269,325 | 22% |
35 Properties |
| 2008 | £211,205 | -10% |
58 Properties |
| 2007 | £231,891 | 2% |
105 Properties |
| 2006 | £227,735 | 13% |
89 Properties |
| 2005 | £197,460 | 5% |
80 Properties |
| 2004 | £187,810 | 25% |
85 Properties |
| 2003 | £140,526 | 7% |
116 Properties |
| 2002 | £131,213 | 30% |
170 Properties |
| 2001 | £91,324 | -3% |
83 Properties |
| 2000 | £94,174 | -3% |
85 Properties |
| 1999 | £96,989 | 21% |
94 Properties |
| 1998 | £76,306 | -0,4% |
73 Properties |
| 1997 | £76,586 | 6% |
74 Properties |
| 1996 | £71,755 | 15% |
77 Properties |
| 1995 | £61,286 | - |
40 Properties |
Property Price per Property Type in Lostock
Here you can find historic sold price data in order to help with your property search.
The average Property Paid Price for specific property types in the last three years are:
| Property Type | Average Sold Price | Sold Properties |
|---|---|---|
| Semi Detached House | £265,498.00 | 51 Semi Detached Houses |
| Detached House | £634,140.00 | 37 Detached Houses |
| Terraced House | £236,649.00 | 73 Terraced Houses |
| Flat | £241,750.00 | 6 Flats |

