Houses for sale & to rent in Moss Side, Leyland
House Prices in Moss Side
Properties in Moss Side have an average house price of £243,199.00 and had 105 Property Transactions within the last 3 years¹.
Moss Side is an area in Leyland, Lancashire with 1,460 households², where the most expensive property was sold for £745,000.00.
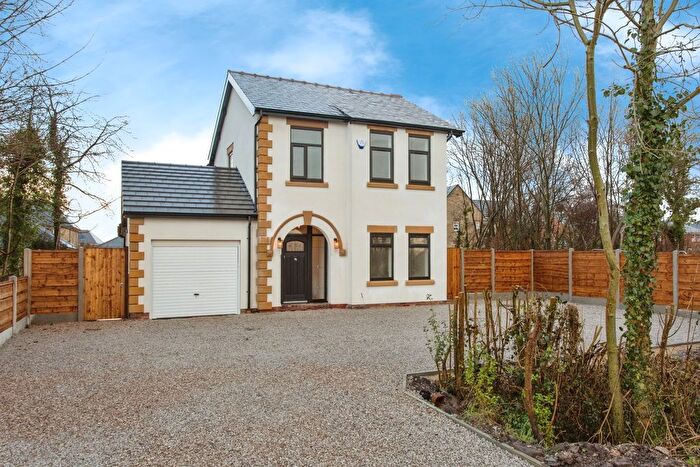
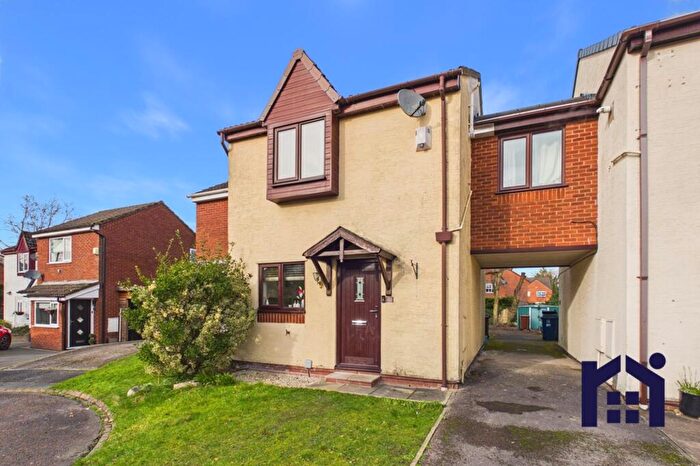
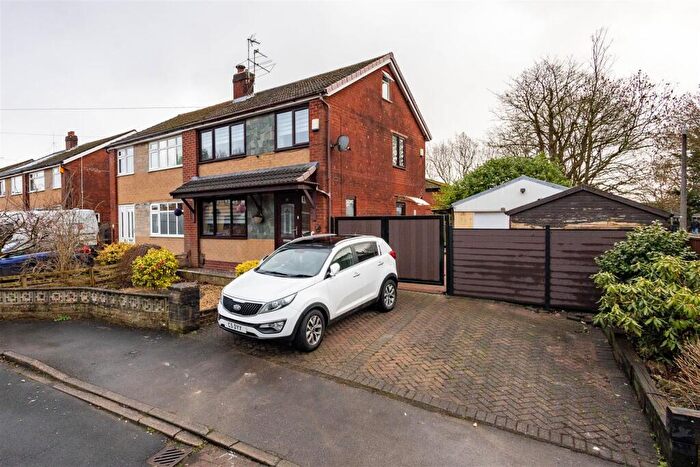
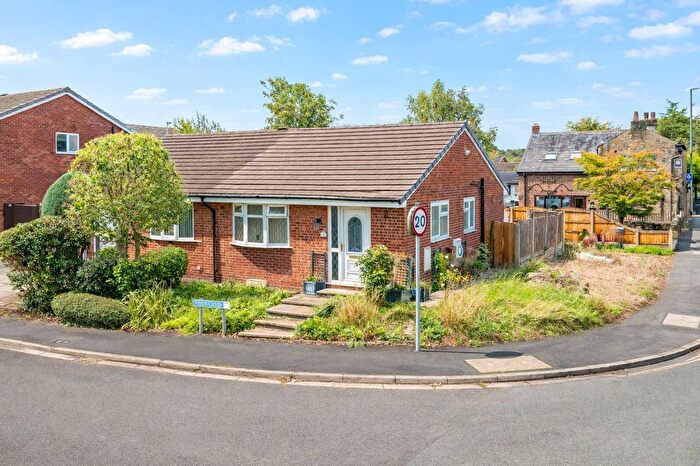
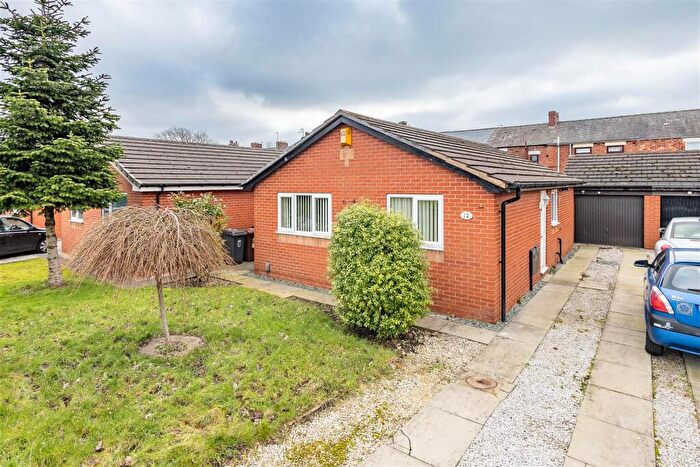
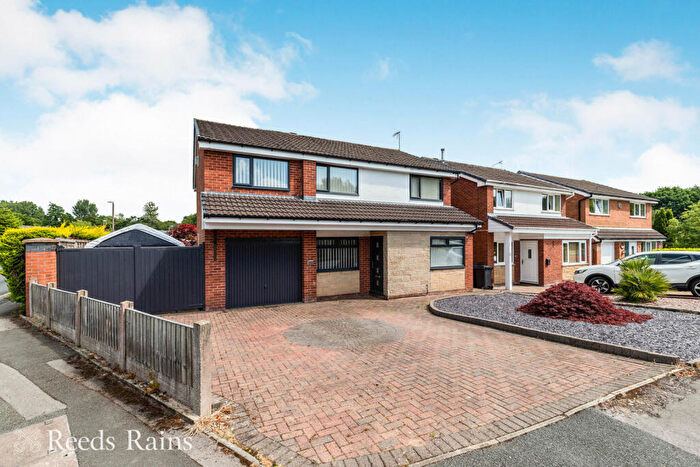
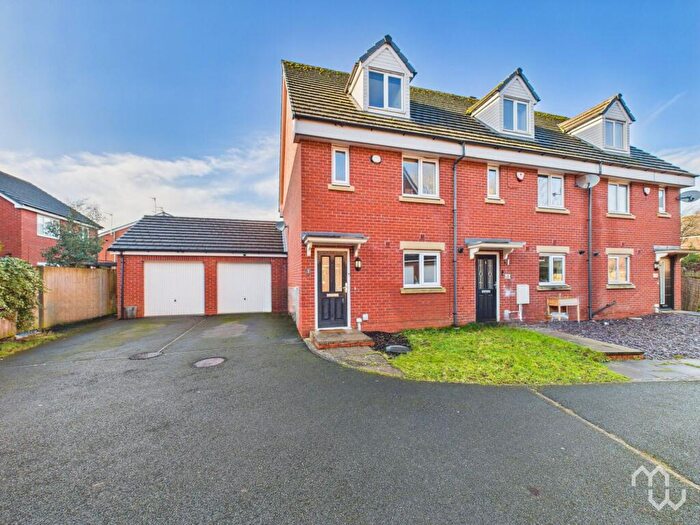
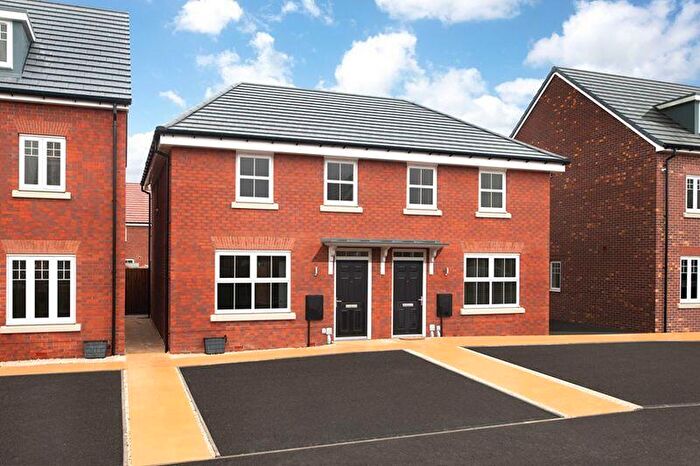
Properties for sale in Moss Side
Roads and Postcodes in Moss Side
Navigate through our locations to find the location of your next house in Moss Side, Leyland for sale or to rent.
| Streets | Postcodes |
|---|---|
| Albion Road | PR26 7BQ |
| Ashfields | PR26 7UW |
| Aston Way | PR26 7TZ PR26 7UX |
| Avocet Court | PR26 7RW |
| Badger Drive | PR26 7BH |
| Barn Croft | PR26 7UD |
| Bison Place | PR26 7QR |
| Bolton Meadow | PR26 7AJ |
| Boxer Place | PR26 7QL |
| Calderbank Close | PR26 6RF |
| Cheetham Meadow | PR26 7UA PR26 7UB |
| Chelmsford Walk | PR26 7AA |
| Chieftain Close | PR26 7BN |
| Clydesdale Place | PR26 7QS |
| Comet Road | PR26 7PF |
| Dunkirk Lane | PR26 7SN PR26 7SY |
| Earnshaw Manor Court | PR26 6BE |
| Fernleigh | PR26 7AL PR26 7AW |
| Greystones | PR26 7UH |
| Hedgerows Road | PR25 3JZ PR26 7JQ PR26 7JR |
| Highgrove Court | PR26 7AN |
| Hornby Croft | PR26 7UT |
| Jane Lane | PR26 6TQ |
| Kirkwood Court | PR26 7SF |
| Lansborough Close | PR25 1TF |
| Long Close | PR26 7AB |
| Long Moss | PR26 7AH |
| Longmeanygate | PR26 6TD PR26 7TB |
| Lynx Place | PR26 7BS |
| Marathon Place | PR26 7QN |
| Meadow Vale | PR26 7JY |
| Middlefield | PR26 7AE |
| Midge Hall Lane | PR26 6TN |
| Moss Side Village Centre | PR25 1TW |
| Narrow Lane | PR26 6TL |
| Nixon Lane | PR26 8LY |
| Nixons Court | PR26 7LD |
| Nookfield | PR26 7YA PR26 7YB PR26 7YD |
| Old Orchard Place | PR26 7UY |
| Old School Close | PR26 7SS |
| Paddock Avenue | PR26 7LF |
| Panther Street | PR26 7BP |
| Parsonage Close | PR26 7AG |
| Peregrine Place | PR25 3EY |
| Pintail Close | PR26 7RY |
| Retriever Street | PR26 7BB |
| Richmond Court | PR26 7YH |
| Roadtrain Avenue | PR26 7BE |
| Robin Hey | PR26 7UJ PR26 7UL PR26 7UN PR26 7UP PR26 7UR |
| Routeman Place | PR26 7AZ |
| School Lane | PR26 7SL |
| Slater Lane | PR26 7SB |
| Smith Croft | PR26 7XN |
| St James Gardens | PR26 7XA PR26 7XB |
| The Glebe | PR26 7TG |
| The Laund | PR26 7XX PR26 7XY |
| The Meadow | PR26 7UZ |
| The Orchards | PR26 7SZ |
| The Pines | PR26 7AP |
| Thornycroft Mews | PR26 7BT |
| Tiger Grove | PR26 7BG |
| Titan Way | PR26 7EW |
| Wheatfield | PR26 7AD |
| Woodvale | PR26 7LG |
Transport near Moss Side
- FAQ
- Price Paid By Year
- Property Type Price
Frequently asked questions about Moss Side
What is the average price for a property for sale in Moss Side?
The average price for a property for sale in Moss Side is £243,199. This amount is 9% higher than the average price in Leyland. There are 534 property listings for sale in Moss Side.
What streets have the most expensive properties for sale in Moss Side?
The streets with the most expensive properties for sale in Moss Side are Jane Lane at an average of £530,000, Woodvale at an average of £420,000 and Longmeanygate at an average of £401,250.
What streets have the most affordable properties for sale in Moss Side?
The streets with the most affordable properties for sale in Moss Side are Robin Hey at an average of £115,210, Cheetham Meadow at an average of £122,666 and Nookfield at an average of £133,222.
Which train stations are available in or near Moss Side?
Some of the train stations available in or near Moss Side are Leyland, Croston and Lostock Hall.
Property Price Paid in Moss Side by Year
The average sold property price by year was:
| Year | Average Sold Price | Price Change |
Sold Properties
|
|---|---|---|---|
| 2025 | £226,093 | -15% |
30 Properties |
| 2024 | £259,675 | 8% |
40 Properties |
| 2023 | £239,031 | 13% |
35 Properties |
| 2022 | £207,678 | -0,2% |
44 Properties |
| 2021 | £208,033 | -6% |
46 Properties |
| 2020 | £221,012 | 19% |
58 Properties |
| 2019 | £178,248 | -2% |
52 Properties |
| 2018 | £181,706 | -6% |
55 Properties |
| 2017 | £192,733 | 6% |
55 Properties |
| 2016 | £181,549 | 13% |
51 Properties |
| 2015 | £157,388 | -10% |
54 Properties |
| 2014 | £172,553 | 12% |
45 Properties |
| 2013 | £151,064 | -8% |
39 Properties |
| 2012 | £162,619 | 7% |
28 Properties |
| 2011 | £150,865 | -19% |
38 Properties |
| 2010 | £180,276 | 2% |
23 Properties |
| 2009 | £176,986 | 9% |
30 Properties |
| 2008 | £160,748 | -9% |
46 Properties |
| 2007 | £175,989 | 14% |
80 Properties |
| 2006 | £151,104 | -4% |
80 Properties |
| 2005 | £157,230 | 10% |
52 Properties |
| 2004 | £140,846 | 27% |
85 Properties |
| 2003 | £103,426 | 5% |
101 Properties |
| 2002 | £97,958 | 14% |
116 Properties |
| 2001 | £84,501 | 0,3% |
96 Properties |
| 2000 | £84,218 | 12% |
112 Properties |
| 1999 | £73,821 | -4% |
117 Properties |
| 1998 | £76,925 | 12% |
99 Properties |
| 1997 | £68,018 | 8% |
93 Properties |
| 1996 | £62,687 | 12% |
72 Properties |
| 1995 | £55,242 | - |
47 Properties |
Property Price per Property Type in Moss Side
Here you can find historic sold price data in order to help with your property search.
The average Property Paid Price for specific property types in the last three years are:
| Property Type | Average Sold Price | Sold Properties |
|---|---|---|
| Semi Detached House | £198,515.00 | 33 Semi Detached Houses |
| Detached House | £311,667.00 | 53 Detached Houses |
| Terraced House | £131,326.00 | 17 Terraced Houses |
| Flat | £117,000.00 | 2 Flats |

