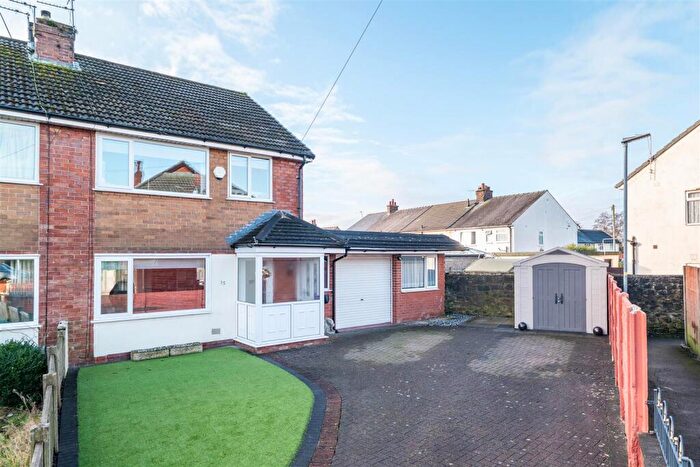
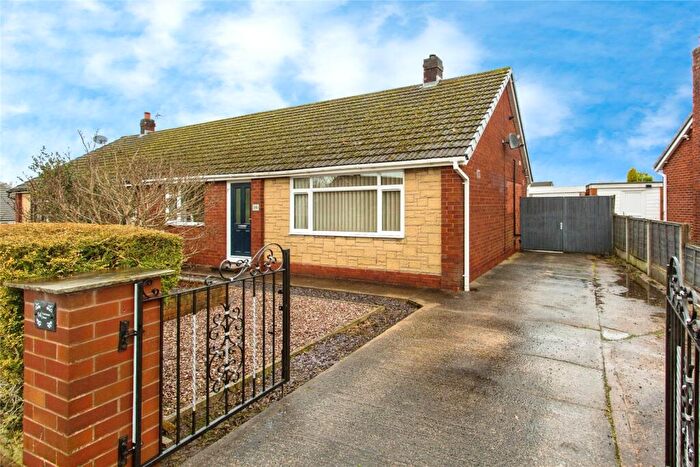
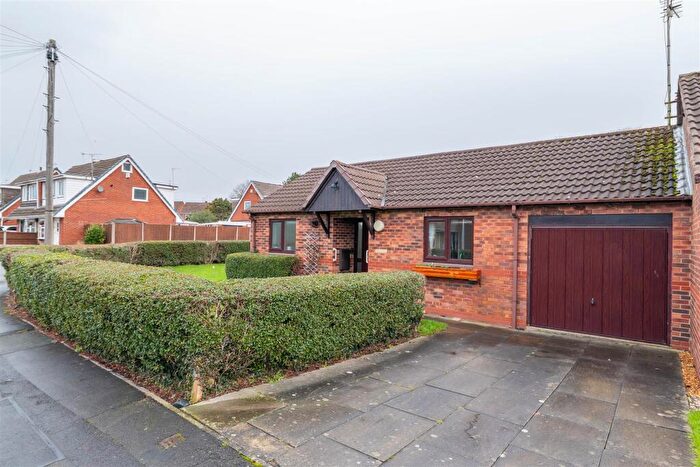
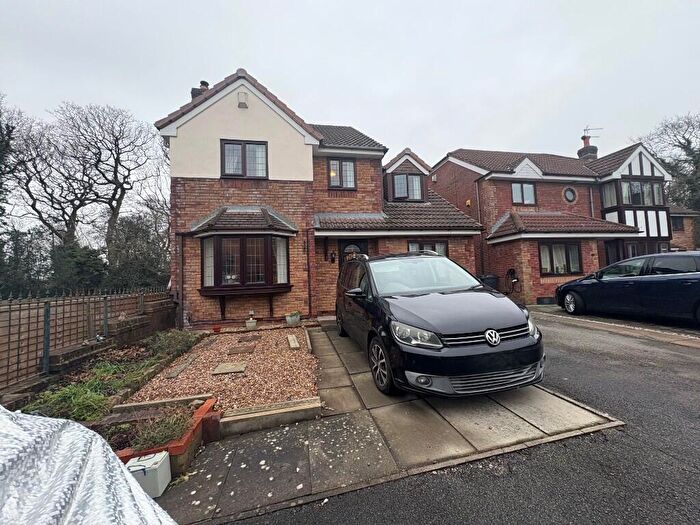
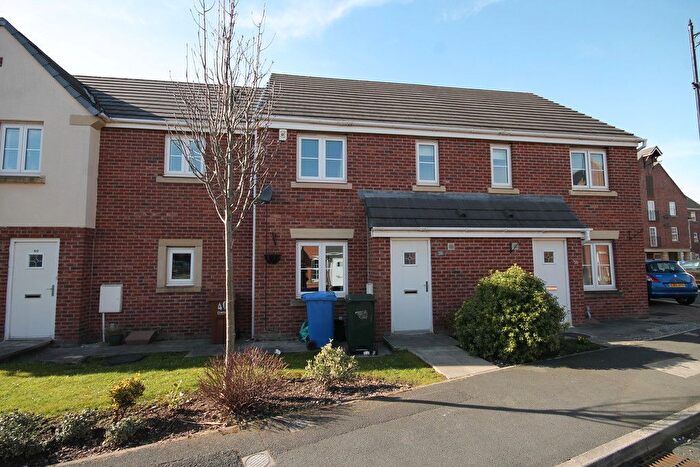
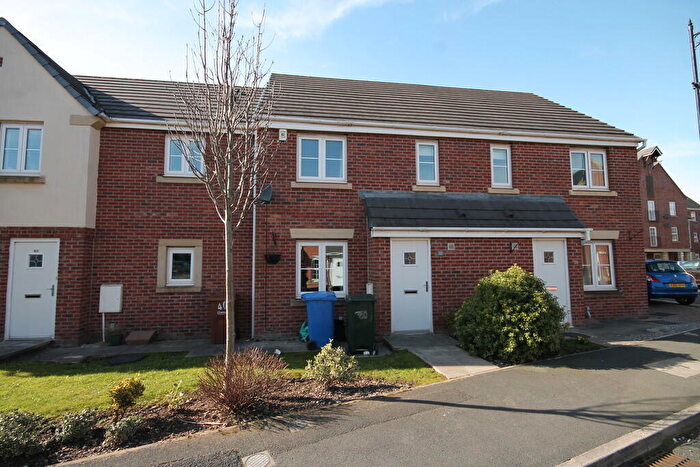
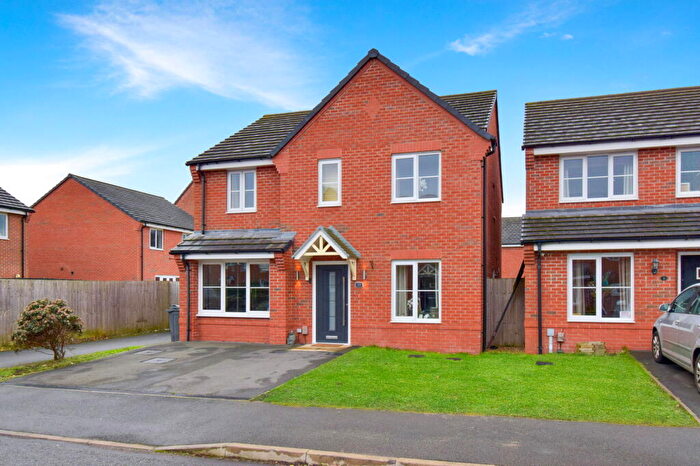
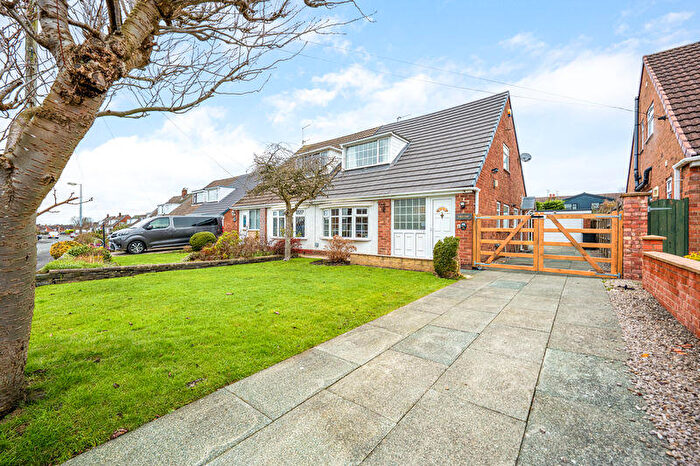
Houses for sale & to rent in Leyland, Lancashire
House Prices in Leyland
Properties in Leyland have an average house price of £222,912.00 and had 2,785 Property Transactions within the last 3 years.¹
Leyland is an area in Lancashire with 18,556 households², where the most expensive property was sold for £1,350,000.00.
Properties for sale in Leyland
Neighbourhoods in Leyland
Navigate through our locations to find the location of your next house in Leyland, Lancashire for sale or to rent.
- Clayton-le-woods West And Cuerden
- Earnshaw Bridge
- Eccleston And Mawdesley
- Farington East
- Farington West
- Golden Hill
- Leyland Central
- Leyland St. Ambrose
- Leyland St. Marys
- Little Hoole And Much Hoole
- Lostock
- Lowerhouse
- Moss Side
- Seven Stars
- Broadfield
- Buckshaw & Worden
- St Ambrose
- Clayton West & Cuerden
- Croston, Mawdesley & Euxton South
- Eccleston, Heskin & Charnock Richard
Transport in Leyland
Please see below transportation links in this area:
- FAQ
- Price Paid By Year
- Property Type Price
Frequently asked questions about Leyland
What is the average price for a property for sale in Leyland?
The average price for a property for sale in Leyland is £222,912. This amount is 8% higher than the average price in Lancashire. There are more than 10,000 property listings for sale in Leyland.
What locations have the most expensive properties for sale in Leyland?
The locations with the most expensive properties for sale in Leyland are Eccleston, Heskin & Charnock Richard at an average of £500,000, Croston, Mawdesley & Euxton South at an average of £378,857 and Lostock at an average of £322,673.
What locations have the most affordable properties for sale in Leyland?
The locations with the most affordable properties for sale in Leyland are Golden Hill at an average of £165,794, Leyland Central at an average of £178,411 and Leyland St. Ambrose at an average of £181,234.
Which train stations are available in or near Leyland?
Some of the train stations available in or near Leyland are Leyland, Buckshaw Parkway and Lostock Hall.
Property Price Paid in Leyland by Year
The average sold property price by year was:
| Year | Average Sold Price | Price Change |
Sold Properties
|
|---|---|---|---|
| 2025 | £231,072 | 4% |
481 Properties |
| 2024 | £222,400 | 2% |
721 Properties |
| 2023 | £218,617 | -2% |
675 Properties |
| 2022 | £222,188 | 6% |
908 Properties |
| 2021 | £208,401 | 6% |
1,112 Properties |
| 2020 | £195,089 | 5% |
829 Properties |
| 2019 | £184,832 | 1% |
864 Properties |
| 2018 | £182,806 | 1% |
927 Properties |
| 2017 | £181,122 | 2% |
959 Properties |
| 2016 | £178,174 | -6% |
804 Properties |
| 2015 | £189,172 | 11% |
805 Properties |
| 2014 | £167,421 | 13% |
785 Properties |
| 2013 | £146,483 | -3% |
543 Properties |
| 2012 | £151,523 | -1% |
509 Properties |
| 2011 | £153,757 | -4% |
481 Properties |
| 2010 | £159,248 | 1% |
459 Properties |
| 2009 | £157,889 | 2% |
462 Properties |
| 2008 | £154,489 | -4% |
491 Properties |
| 2007 | £160,416 | 7% |
1,017 Properties |
| 2006 | £149,016 | 2% |
1,062 Properties |
| 2005 | £146,434 | 11% |
822 Properties |
| 2004 | £130,103 | 18% |
943 Properties |
| 2003 | £106,301 | 13% |
1,124 Properties |
| 2002 | £92,187 | 23% |
1,314 Properties |
| 2001 | £71,306 | 4% |
1,041 Properties |
| 2000 | £68,397 | 4% |
1,004 Properties |
| 1999 | £65,631 | 9% |
911 Properties |
| 1998 | £59,682 | 5% |
869 Properties |
| 1997 | £56,808 | 4% |
851 Properties |
| 1996 | £54,671 | 5% |
755 Properties |
| 1995 | £51,748 | - |
615 Properties |
Property Price per Property Type in Leyland
Here you can find historic sold price data in order to help with your property search.
The average Property Paid Price for specific property types in the last three years are:
| Property Type | Average Sold Price | Sold Properties |
|---|---|---|
| Semi Detached House | £194,777.00 | 1,074 Semi Detached Houses |
| Detached House | £339,733.00 | 814 Detached Houses |
| Terraced House | £151,334.00 | 721 Terraced Houses |
| Flat | £147,520.00 | 176 Flats |


