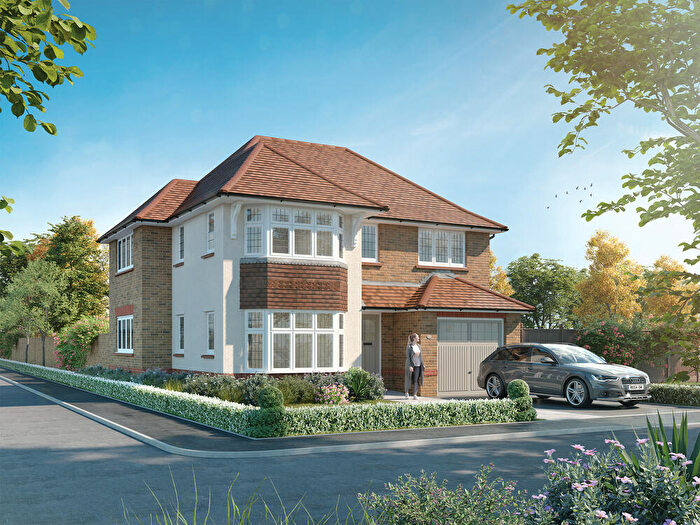
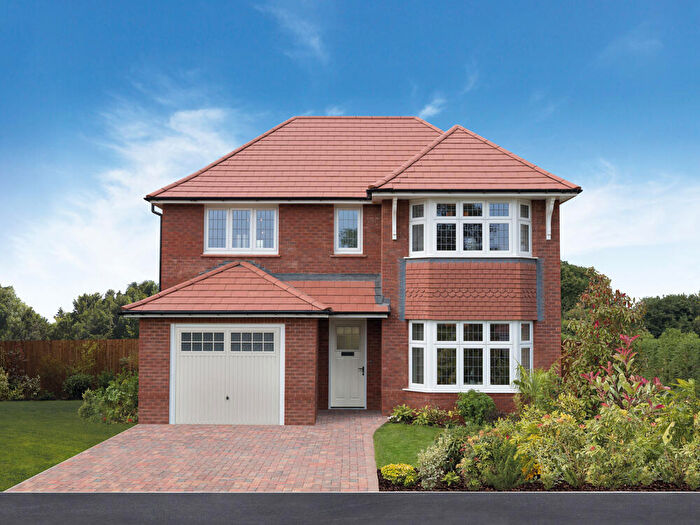
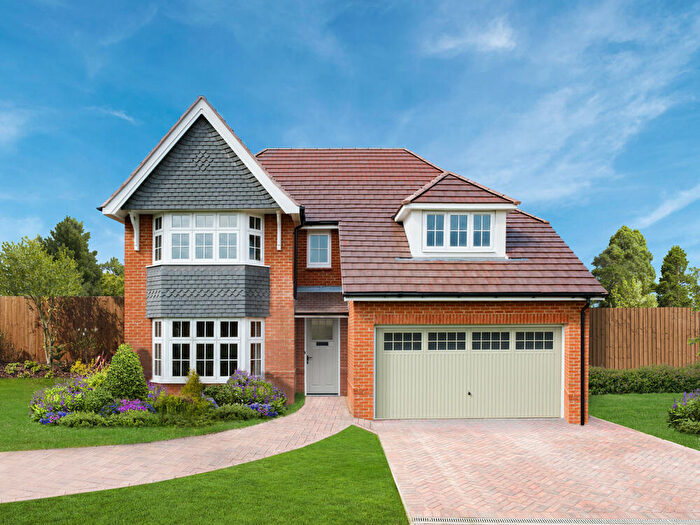
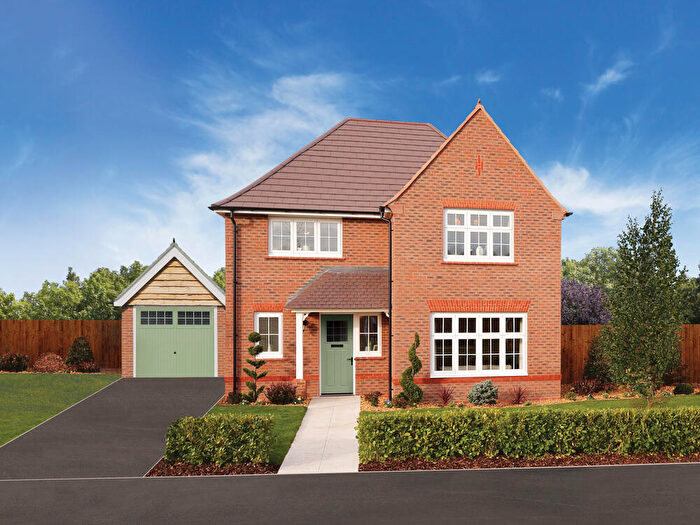
Houses for sale & to rent in Lowerhouse, Leyland
House Prices in Lowerhouse
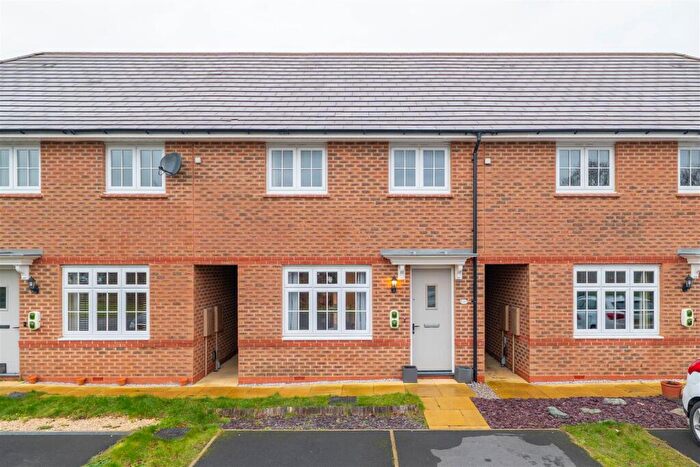
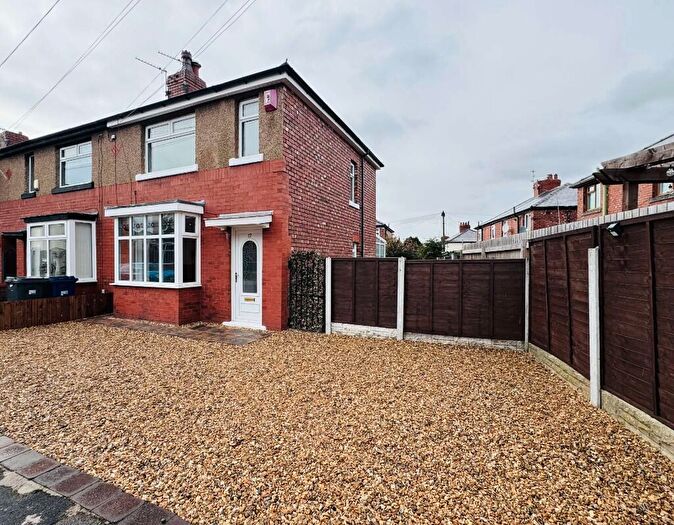
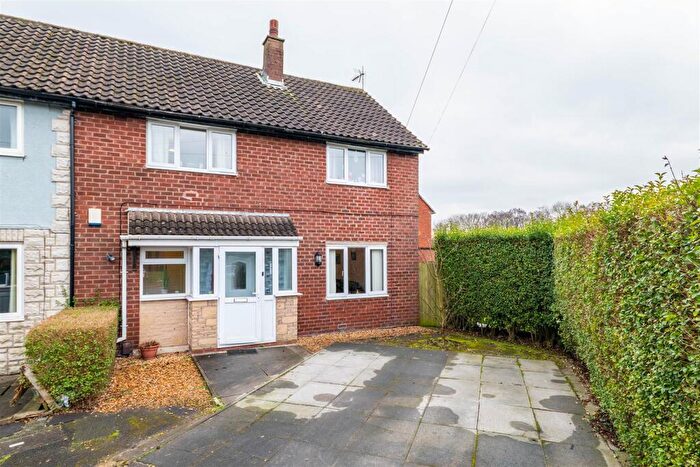
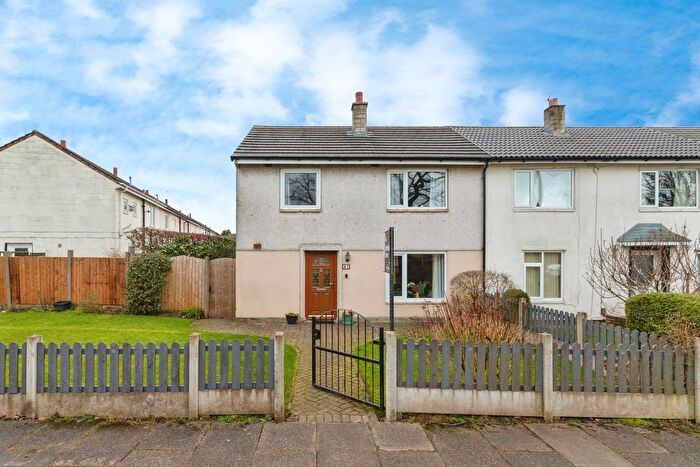
Properties in Lowerhouse have an average house price of £198,830.00 and had 130 Property Transactions within the last 3 years¹.
Lowerhouse is an area in Leyland, Lancashire with 1,640 households², where the most expensive property was sold for £675,000.00.
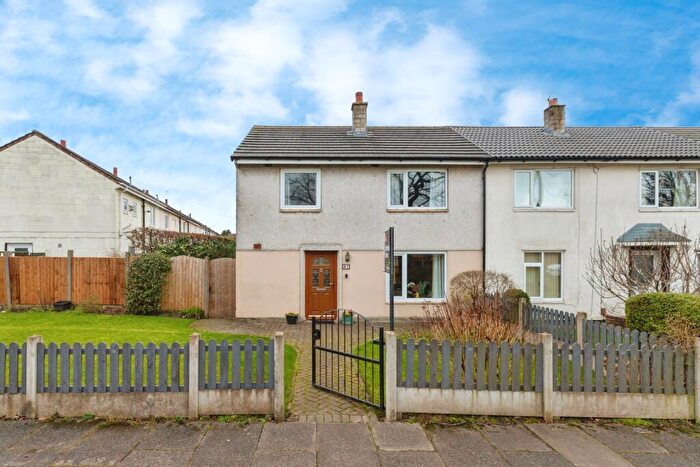
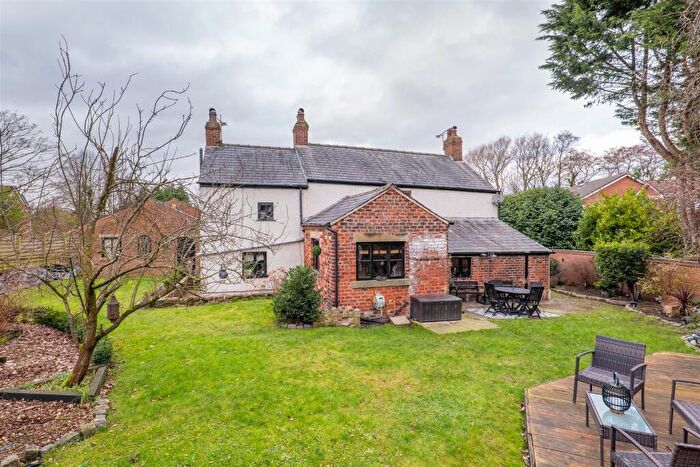
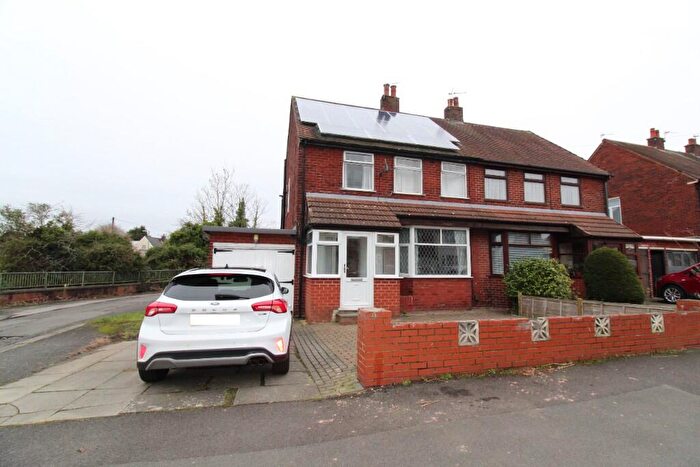
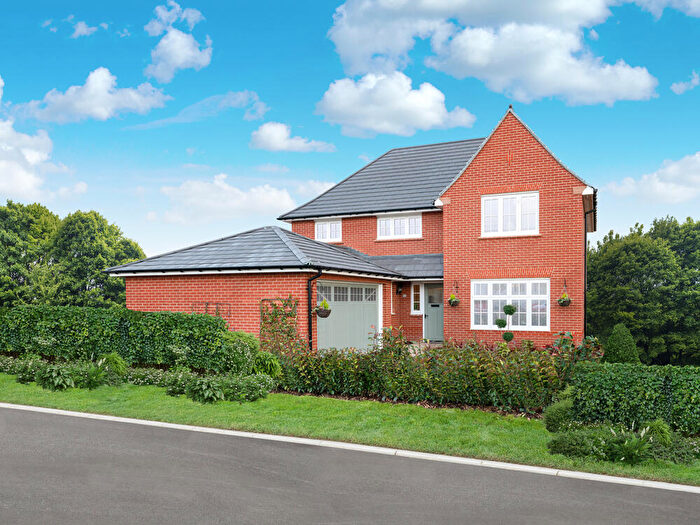
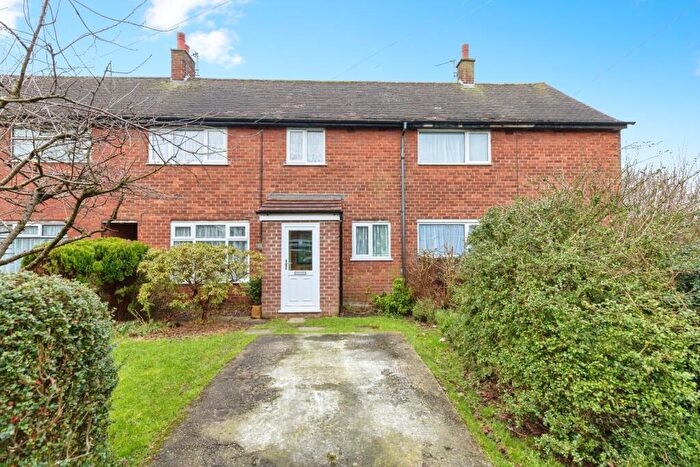
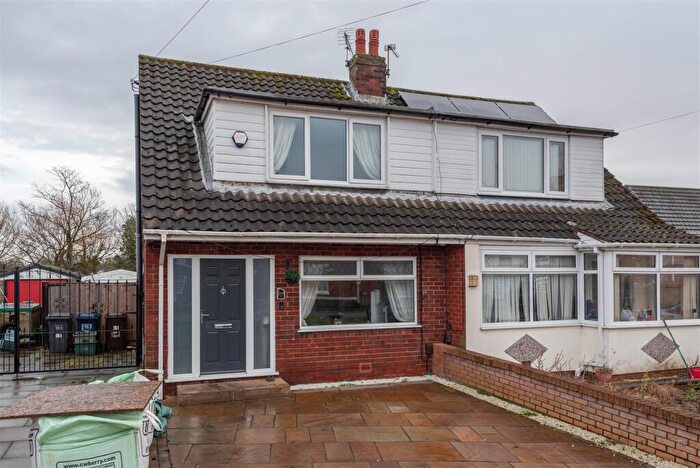
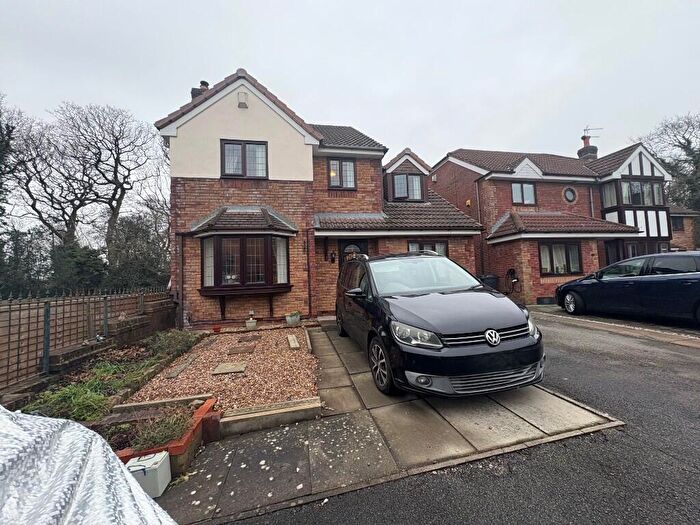
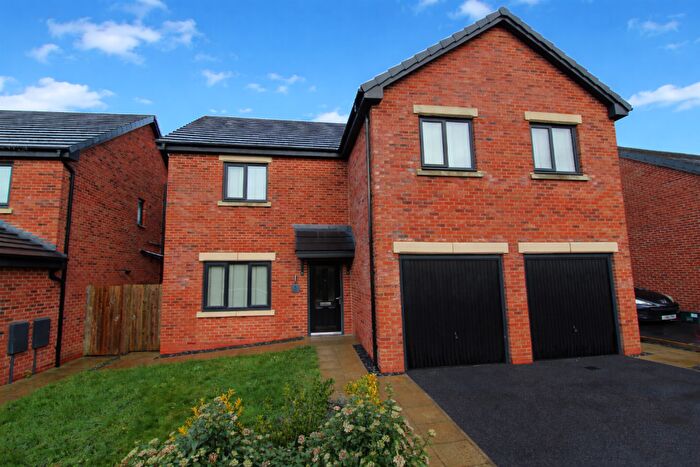
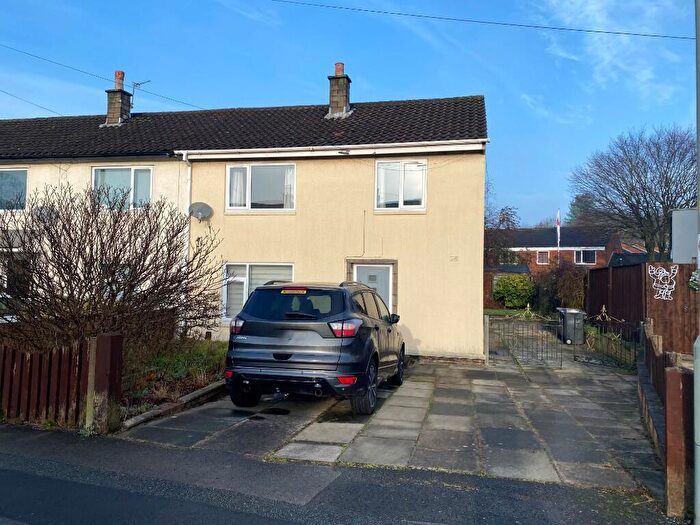
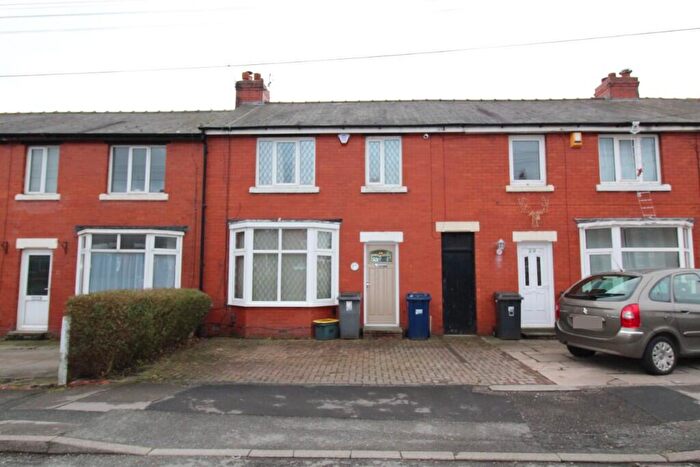
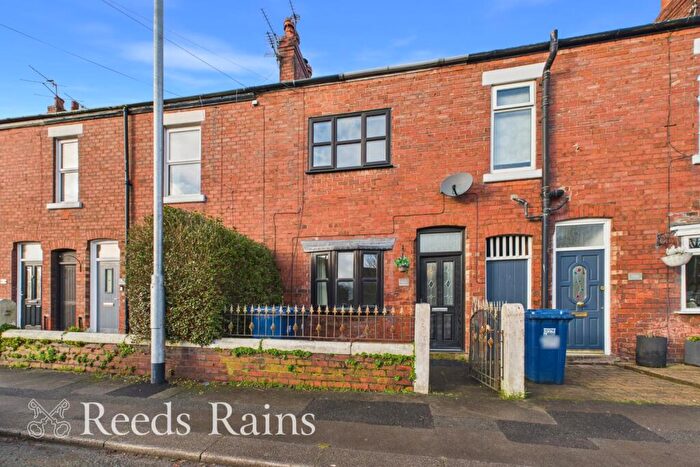
Properties for sale in Lowerhouse
Roads and Postcodes in Lowerhouse
Navigate through our locations to find the location of your next house in Lowerhouse, Leyland for sale or to rent.
| Streets | Postcodes |
|---|---|
| Altcar Lane | PR25 1LE |
| Briarwood Close | PR25 1RD |
| Butlers Farm Court | PR25 1LF |
| Cedarwood Drive | PR25 1HN |
| Chapel Close | PR25 1TG |
| Cherrywood Close | PR25 1RB |
| Clayton Avenue | PR25 1AT |
| Cuerden Avenue | PR25 1AX |
| Cumberland Avenue | PR25 1BE PR25 1BH |
| Durham Close | PR25 1BB |
| Elmwood Avenue | PR25 1RL |
| Farington Avenue | PR25 1AU |
| Forest Way | PR25 1HL |
| Fox Lane | PR25 1HA PR25 1HB PR25 1HD PR25 1HE PR25 1HH PR25 1HJ |
| Gorsewood Road | PR25 1RE |
| Hazelwood Close | PR25 1RH |
| Kingsway | PR25 1BJ PR25 1BL |
| Larchwood Crescent | PR25 1RJ |
| Leyland Lane | PR25 1LA PR25 1TA PR25 1UP |
| Leyton Avenue | PR25 1AQ |
| Lower House Road | PR25 1HT |
| Maplewood Close | PR25 1HP |
| Marron Close | PR25 1RX |
| Mill Lane | PR25 1HY |
| Norfolk Close | PR25 1BP |
| Nursery Close | PR25 1NS |
| Orchard Court | PR25 1AZ |
| Parkgate Drive | PR25 1BU |
| Pinewood Crescent | PR25 1HQ |
| Queensway | PR25 1AA PR25 1AB PR25 1AD PR25 1AE PR25 1AH |
| Redwood Avenue | PR25 1RN |
| Ribble Road | PR25 1HU |
| Roberts Court | PR25 1HG |
| Royal Avenue | PR25 1BQ PR25 1BX |
| Seven Stars Road | PR25 1AN PR25 1AP |
| Shawbrook Road | PR25 1AY |
| Spey Close | PR25 1RU |
| Springfield Road | PR25 1AR PR25 1AS |
| Stanning Close | PR25 1HZ |
| Warwick Road | PR25 1BN |
| Welsby Road | PR25 1JA PR25 1JB PR25 1JD PR25 1JE PR25 1JH |
| West Paddock | PR25 1HR PR25 1JJ |
| Westmorland Close | PR25 1BA |
| Windsor Close | PR25 1JU |
| York Close | PR25 1BT |
Transport near Lowerhouse
- FAQ
- Price Paid By Year
- Property Type Price
Frequently asked questions about Lowerhouse
What is the average price for a property for sale in Lowerhouse?
The average price for a property for sale in Lowerhouse is £198,830. This amount is 11% lower than the average price in Leyland. There are 808 property listings for sale in Lowerhouse.
What streets have the most expensive properties for sale in Lowerhouse?
The streets with the most expensive properties for sale in Lowerhouse are Parkgate Drive at an average of £389,000, Leyland Lane at an average of £309,120 and Cedarwood Drive at an average of £275,737.
What streets have the most affordable properties for sale in Lowerhouse?
The streets with the most affordable properties for sale in Lowerhouse are Shawbrook Road at an average of £74,000, Seven Stars Road at an average of £79,750 and Kingsway at an average of £104,000.
Which train stations are available in or near Lowerhouse?
Some of the train stations available in or near Lowerhouse are Leyland, Buckshaw Parkway and Euxton Balshaw Lane.
Property Price Paid in Lowerhouse by Year
The average sold property price by year was:
| Year | Average Sold Price | Price Change |
Sold Properties
|
|---|---|---|---|
| 2025 | £216,924 | 11% |
33 Properties |
| 2024 | £192,827 | 0,1% |
44 Properties |
| 2023 | £192,548 | -15% |
53 Properties |
| 2022 | £220,598 | 25% |
50 Properties |
| 2021 | £166,235 | 4% |
71 Properties |
| 2020 | £158,802 | -2% |
37 Properties |
| 2019 | £162,346 | 4% |
29 Properties |
| 2018 | £156,552 | 8% |
47 Properties |
| 2017 | £144,643 | 9% |
48 Properties |
| 2016 | £131,214 | 8% |
35 Properties |
| 2015 | £120,119 | -9% |
46 Properties |
| 2014 | £130,472 | -2% |
47 Properties |
| 2013 | £132,580 | -11% |
31 Properties |
| 2012 | £147,312 | 11% |
24 Properties |
| 2011 | £130,455 | -13% |
27 Properties |
| 2010 | £147,521 | 16% |
31 Properties |
| 2009 | £124,533 | -7% |
24 Properties |
| 2008 | £133,782 | -6% |
32 Properties |
| 2007 | £141,598 | 0,5% |
82 Properties |
| 2006 | £140,919 | -4% |
69 Properties |
| 2005 | £146,726 | 20% |
61 Properties |
| 2004 | £117,985 | 12% |
69 Properties |
| 2003 | £104,007 | 29% |
88 Properties |
| 2002 | £73,704 | 14% |
80 Properties |
| 2001 | £63,036 | 13% |
80 Properties |
| 2000 | £54,676 | 4% |
67 Properties |
| 1999 | £52,520 | -8% |
57 Properties |
| 1998 | £56,798 | 3% |
43 Properties |
| 1997 | £55,077 | -0,2% |
53 Properties |
| 1996 | £55,196 | 16% |
44 Properties |
| 1995 | £46,122 | - |
34 Properties |
Property Price per Property Type in Lowerhouse
Here you can find historic sold price data in order to help with your property search.
The average Property Paid Price for specific property types in the last three years are:
| Property Type | Average Sold Price | Sold Properties |
|---|---|---|
| Semi Detached House | £172,857.00 | 55 Semi Detached Houses |
| Detached House | £322,843.00 | 29 Detached Houses |
| Terraced House | £156,634.00 | 40 Terraced Houses |
| Flat | £118,833.00 | 6 Flats |

