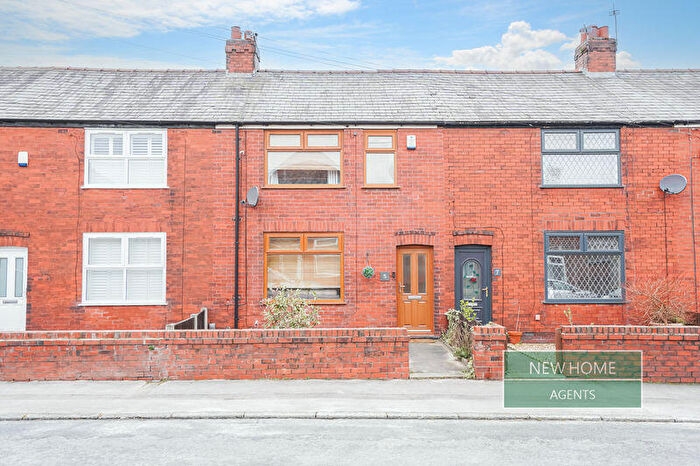
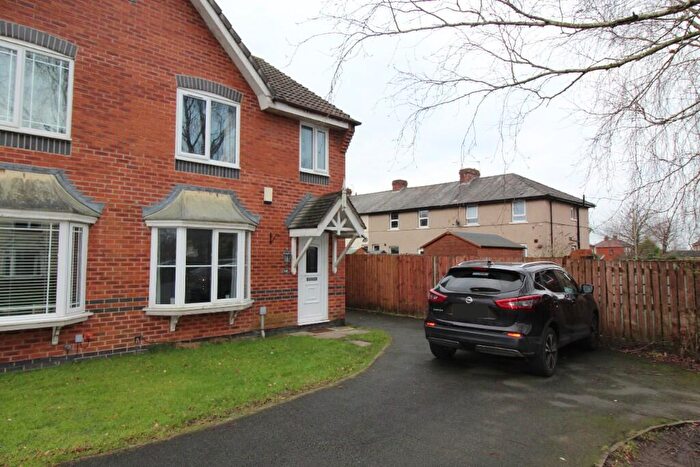
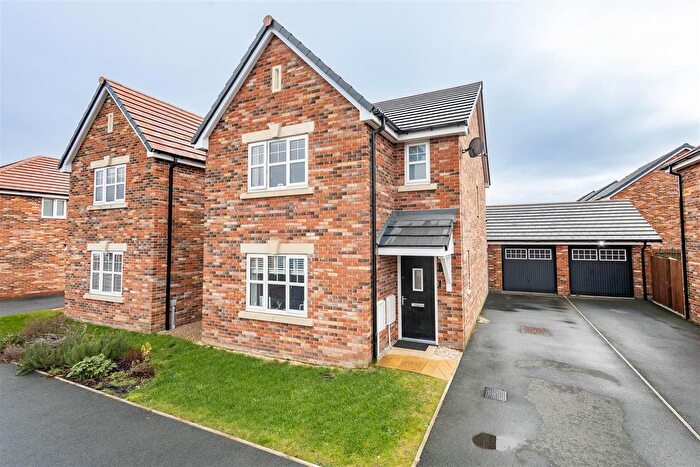
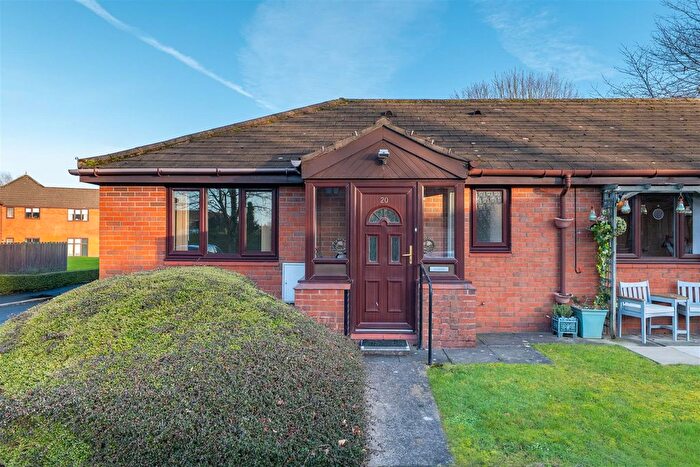
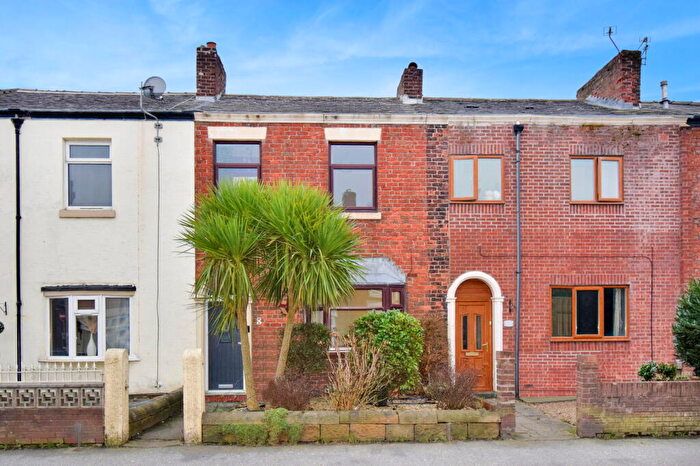
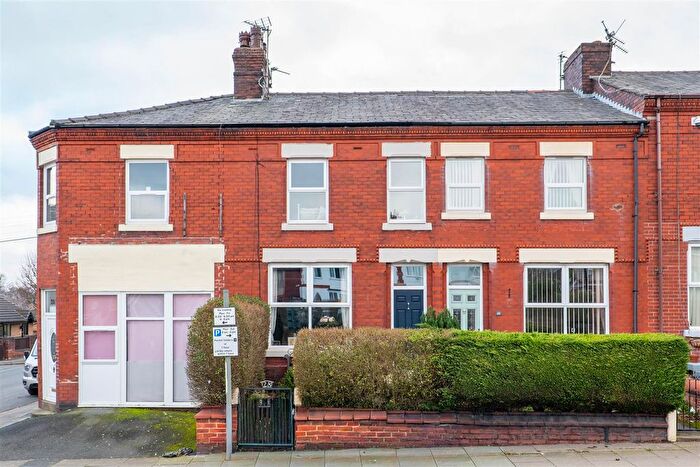
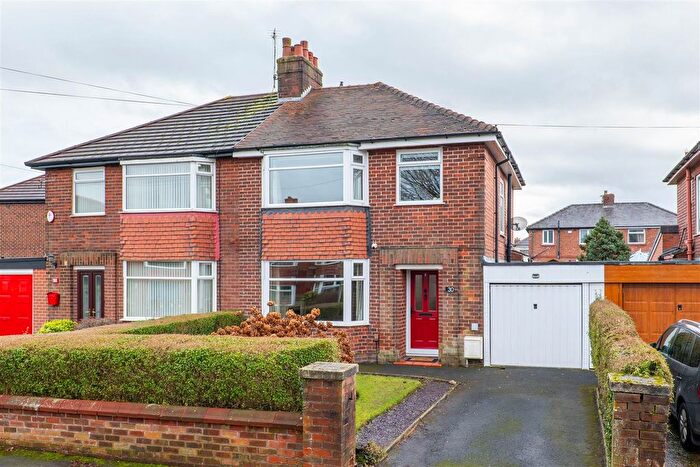
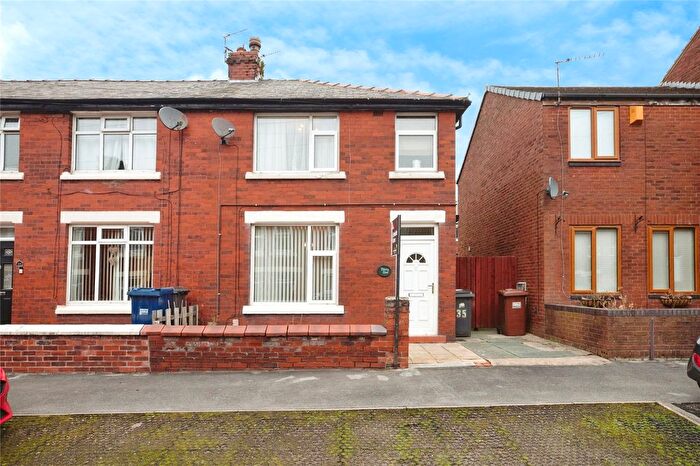
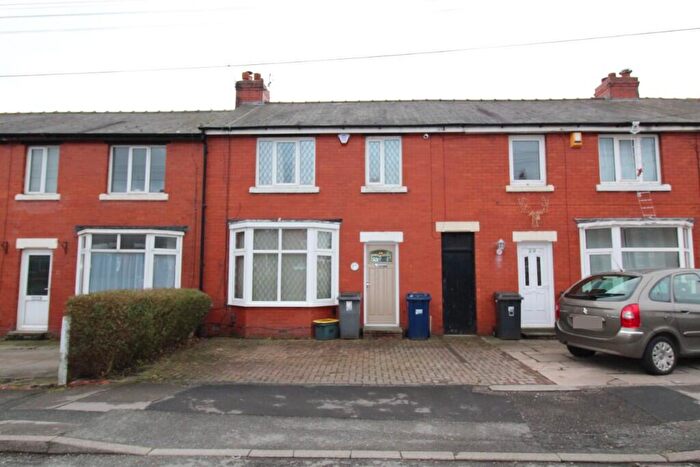
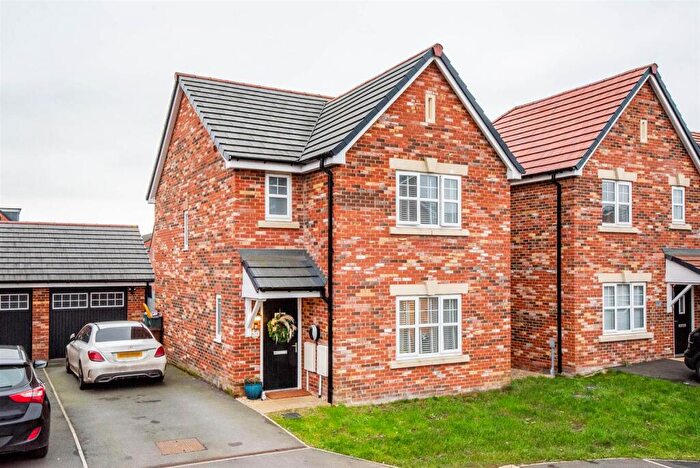
Houses for sale & to rent in Leyland Central, Leyland
House Prices in Leyland Central
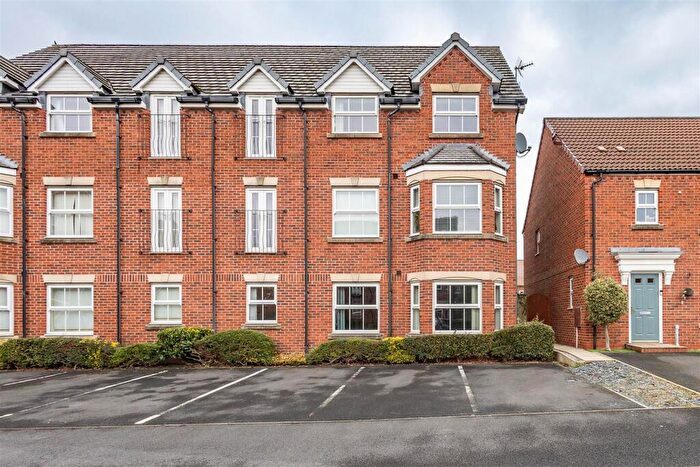
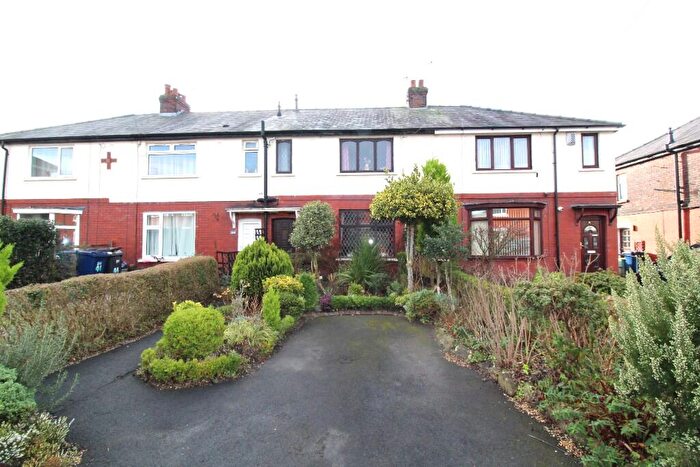
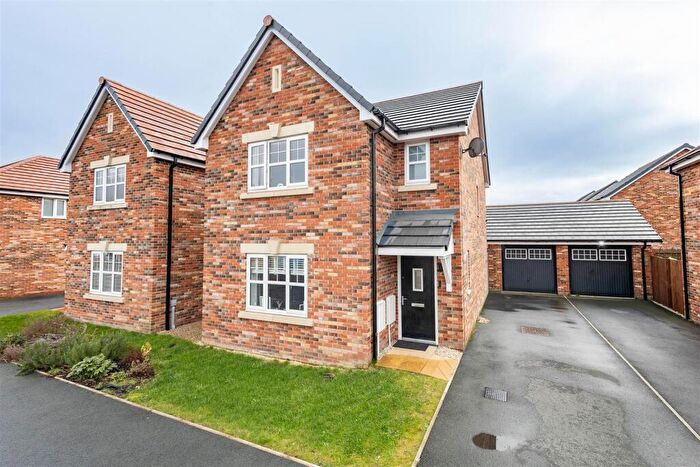
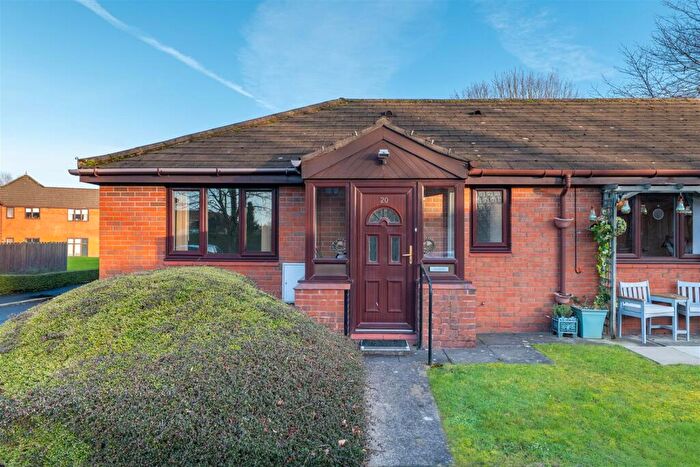
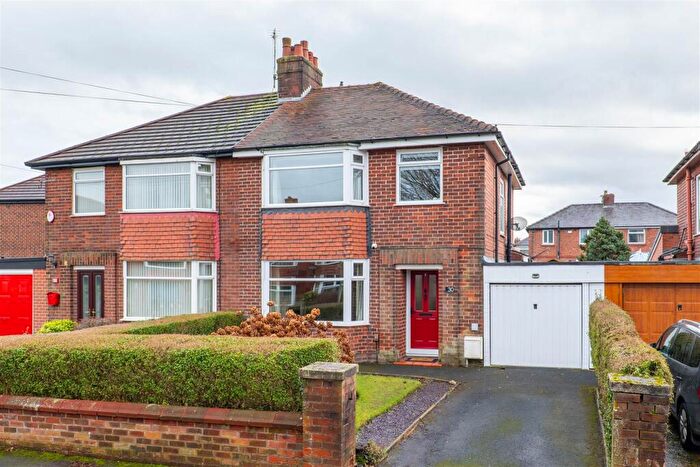
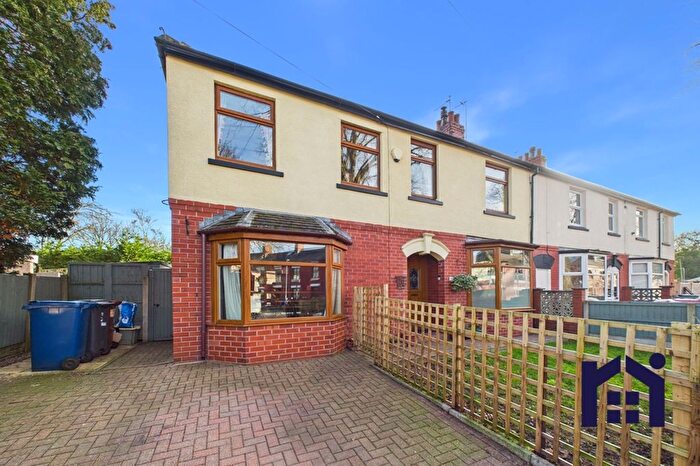
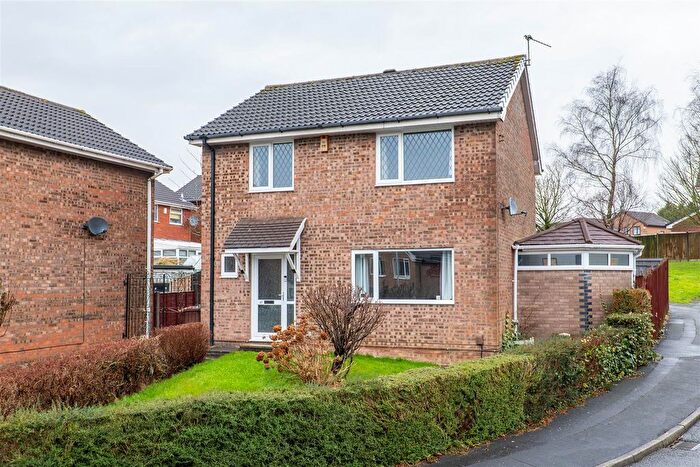
Properties in Leyland Central have an average house price of £176,932.00 and had 220 Property Transactions within the last 3 years¹.
Leyland Central is an area in Leyland, Lancashire with 1,643 households², where the most expensive property was sold for £510,000.00.
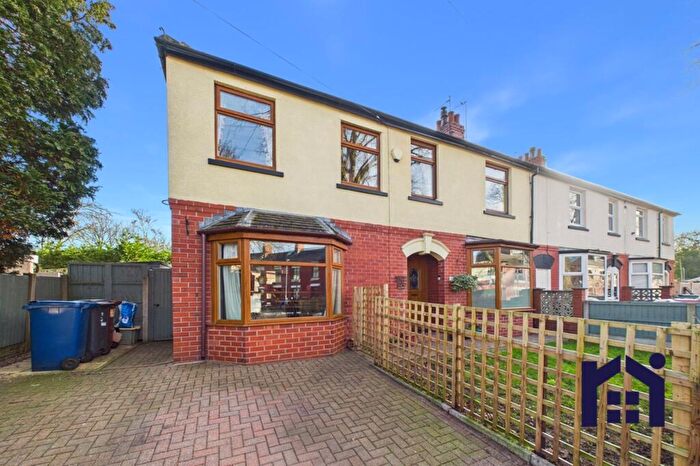
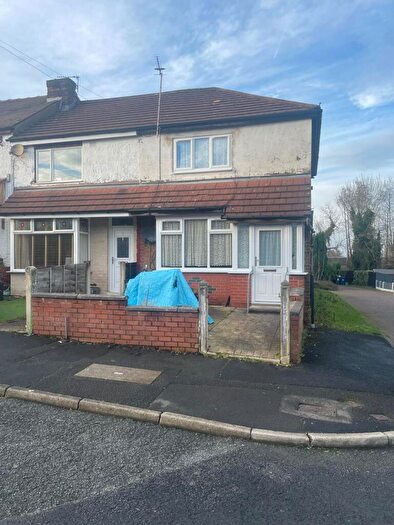
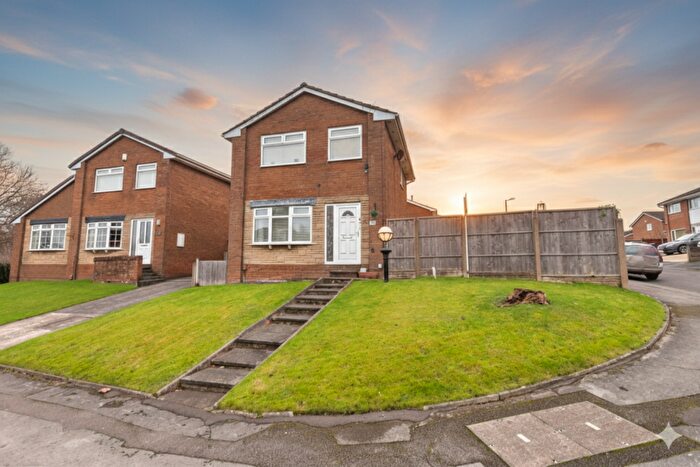
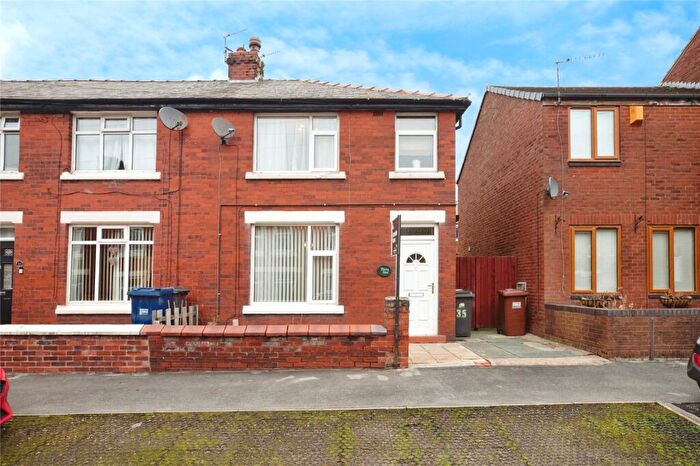
Properties for sale in Leyland Central
Roads and Postcodes in Leyland Central
Navigate through our locations to find the location of your next house in Leyland Central, Leyland for sale or to rent.
| Streets | Postcodes |
|---|---|
| Alice Avenue | PR25 3NA |
| Balcarres Close | PR25 2EF |
| Balcarres Place | PR25 2FH |
| Balcarres Road | PR25 2EJ PR25 2EL PR25 3ED |
| Balfour Court | PR25 2TF |
| Beech Road | PR25 3SS |
| Belgrave Court | PR25 2LG |
| Belgrave Road | PR25 2LZ |
| Brantwood Drive | PR25 3PF |
| Bretherton Terrace | PR25 3FB |
| Broad Square | PR25 2EA |
| Broadway | PR25 3EH |
| Burghley Court | PR25 3PT |
| Burlington Gardens | PR25 3EX |
| Canberra Road | PR25 3EQ PR25 3ER PR25 3ET PR25 3JH |
| Chapel Brow | PR25 3NE PR25 3NH |
| Charnock Street | PR25 3EB |
| Clifton Avenue | PR25 3ES |
| Crawford Avenue | PR25 3EN PR25 3FN PR25 3JP |
| Deighton Avenue | PR25 2FD |
| Denford Avenue | PR25 3JJ PR25 3JL |
| Dorothy Avenue | PR25 2YA |
| East Street | PR25 3NJ |
| Eden Street | PR25 2ET |
| Farington Gate | PR25 3NF |
| Fleetwood Street | PR25 3NL |
| Golden Hill Lane | PR25 3NP PR25 3FF |
| Goulding Avenue | PR25 3HE |
| Hampden Road | PR25 3SR |
| Hargreaves Avenue | PR25 3FS |
| Hastings Road | PR25 3SP |
| Helmsley Green | PR25 3PN |
| Herbert Street | PR25 2SL |
| Hewitt Street | PR25 3SN |
| Hough Lane | PR25 2SD PR25 2YB PR25 2SA PR25 2SR PR25 2YD |
| Hulmes Mill Close | PR25 2NF |
| Kennett Drive | PR25 3QW PR25 3QX |
| King Street | PR25 2LE PR25 2LW PR25 2NB |
| Kings Court | PR25 2SF |
| Kings Crescent | PR25 2SG |
| Lindsay Avenue | PR25 3FE |
| Mead Avenue | PR25 3FH |
| Meadow Street | PR25 2LA |
| Nelson Avenue | PR25 3EE |
| Northcote Street | PR25 2AA |
| Northgate | PR25 3NQ PR25 3NR |
| Olympian Way | PR25 3UR |
| Orchard Street | PR25 3SH |
| Pembroke Place | PR25 2EH |
| Princess Street | PR25 3HN |
| Quin Street | PR25 2TA PR25 2TB |
| Sandfield Street | PR25 3HJ |
| Sandy Lane | PR25 2EB PR25 2ED PR25 2EE |
| Sandy Place | PR25 2FE |
| Somerset Road | PR25 3SQ |
| Spring Street | PR25 3SJ |
| St Andrews Way | PR25 2ND |
| Stanley Street | PR25 3HH |
| Starkie Street | PR25 3HL |
| Stratfield Place | PR25 3PY |
| Sumner Street | PR25 2LD |
| Thurston Road | PR25 2LB PR25 2LF |
| Tomlinson Road | PR25 2AB |
| Towngate | PR25 2TE PR25 2EN PR25 2FN PR25 2FQ PR25 2NP PR25 2NT |
| Tuer Street | PR25 3US |
| Turpin Green Lane | PR25 3EA PR25 3HA PR25 3HB PR25 3HD |
| Victoria Terrace | PR25 2FB |
| Westwood Road | PR25 3NS |
| Wilton Place | PR25 3PR |
| Winsor Avenue | PR25 3EP |
| Woburn Green | PR25 3PL |
| Worcester Avenue | PR25 3JN |
Transport near Leyland Central
-
Leyland Station
-
Buckshaw Parkway Station
-
Lostock Hall Station
-
Euxton Balshaw Lane Station
-
Bamber Bridge Station
- FAQ
- Price Paid By Year
- Property Type Price
Frequently asked questions about Leyland Central
What is the average price for a property for sale in Leyland Central?
The average price for a property for sale in Leyland Central is £176,932. This amount is 21% lower than the average price in Leyland. There are 1,173 property listings for sale in Leyland Central.
What streets have the most expensive properties for sale in Leyland Central?
The streets with the most expensive properties for sale in Leyland Central are Pembroke Place at an average of £340,612, Worcester Avenue at an average of £263,000 and Clifton Avenue at an average of £258,875.
What streets have the most affordable properties for sale in Leyland Central?
The streets with the most affordable properties for sale in Leyland Central are Burghley Court at an average of £85,000, Golden Hill Lane at an average of £112,250 and Hewitt Street at an average of £116,000.
Which train stations are available in or near Leyland Central?
Some of the train stations available in or near Leyland Central are Leyland, Buckshaw Parkway and Lostock Hall.
Property Price Paid in Leyland Central by Year
The average sold property price by year was:
| Year | Average Sold Price | Price Change |
Sold Properties
|
|---|---|---|---|
| 2025 | £173,278 | -6% |
54 Properties |
| 2024 | £183,590 | 6% |
82 Properties |
| 2023 | £172,782 | -5% |
84 Properties |
| 2022 | £181,346 | 13% |
86 Properties |
| 2021 | £157,700 | 7% |
107 Properties |
| 2020 | £146,788 | 7% |
51 Properties |
| 2019 | £136,477 | -6% |
67 Properties |
| 2018 | £144,316 | 10% |
72 Properties |
| 2017 | £130,465 | 9% |
89 Properties |
| 2016 | £118,877 | -0,4% |
57 Properties |
| 2015 | £119,376 | 0,1% |
63 Properties |
| 2014 | £119,203 | 3% |
63 Properties |
| 2013 | £115,904 | -3% |
60 Properties |
| 2012 | £118,938 | 4% |
43 Properties |
| 2011 | £114,134 | -6% |
46 Properties |
| 2010 | £120,691 | 2% |
54 Properties |
| 2009 | £118,103 | -3% |
51 Properties |
| 2008 | £121,734 | -11% |
64 Properties |
| 2007 | £134,559 | 2% |
117 Properties |
| 2006 | £132,455 | 15% |
116 Properties |
| 2005 | £112,240 | 3% |
109 Properties |
| 2004 | £108,664 | 23% |
124 Properties |
| 2003 | £83,374 | 18% |
133 Properties |
| 2002 | £68,599 | 19% |
127 Properties |
| 2001 | £55,744 | 11% |
134 Properties |
| 2000 | £49,371 | -6% |
112 Properties |
| 1999 | £52,097 | 10% |
142 Properties |
| 1998 | £46,810 | 4% |
116 Properties |
| 1997 | £45,169 | -6% |
90 Properties |
| 1996 | £47,696 | 3% |
104 Properties |
| 1995 | £46,476 | - |
116 Properties |
Property Price per Property Type in Leyland Central
Here you can find historic sold price data in order to help with your property search.
The average Property Paid Price for specific property types in the last three years are:
| Property Type | Average Sold Price | Sold Properties |
|---|---|---|
| Semi Detached House | £202,686.00 | 77 Semi Detached Houses |
| Detached House | £252,000.00 | 17 Detached Houses |
| Terraced House | £139,243.00 | 79 Terraced Houses |
| Flat | £170,937.00 | 47 Flats |

