
Houses for sale & to rent in St Johns, Lytham St Annes
House Prices in St Johns
Properties in St Johns have an average house price of £314k and had 222 Property Transactions within the last 3 years¹.
St Johns is an area in Lytham St Annes, Lancashire with 2,088 households², where the most expensive property was sold for £1.4M.
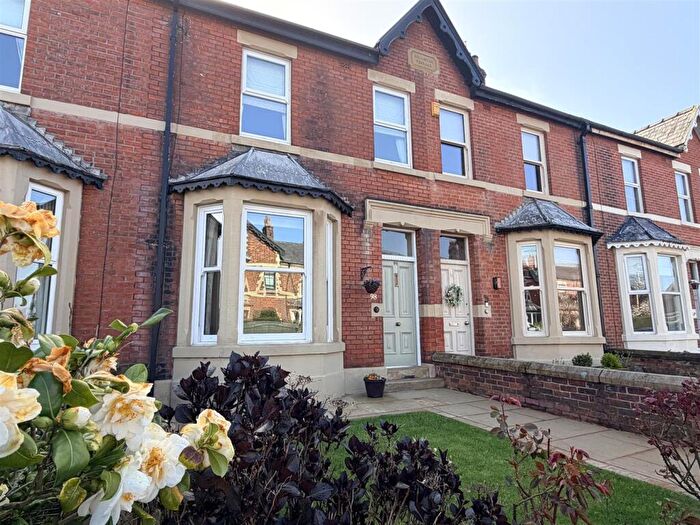
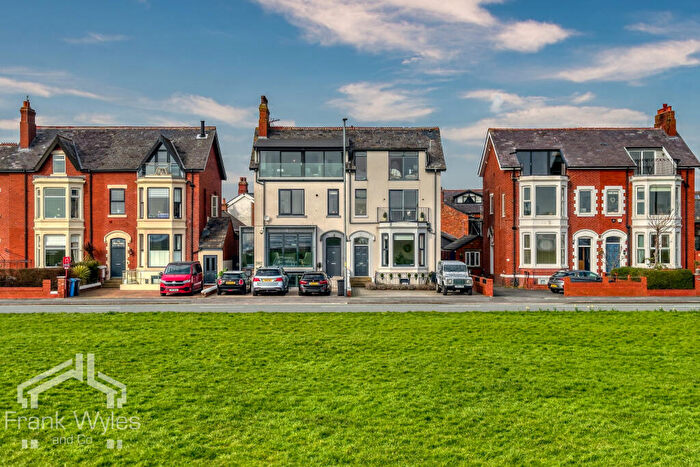
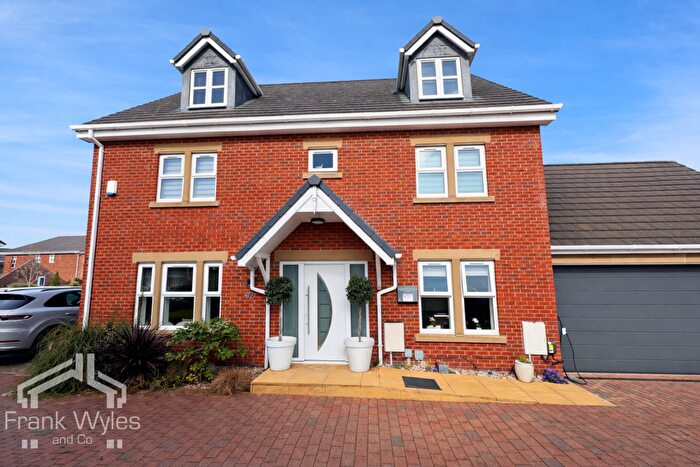
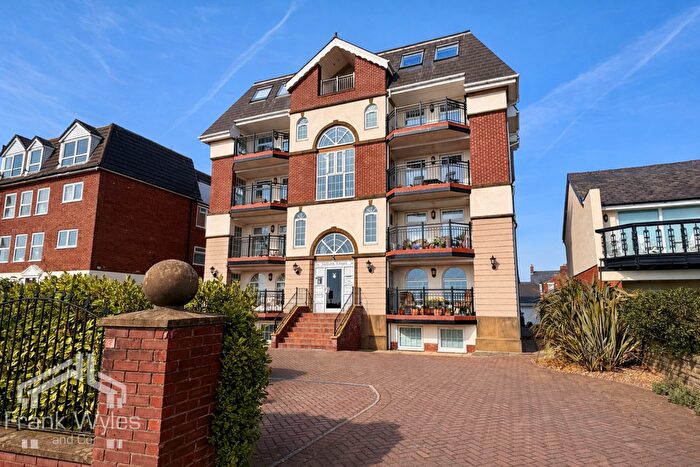
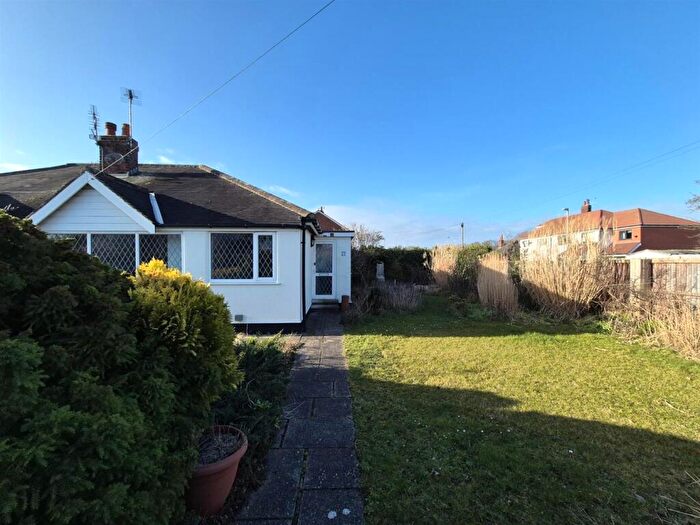
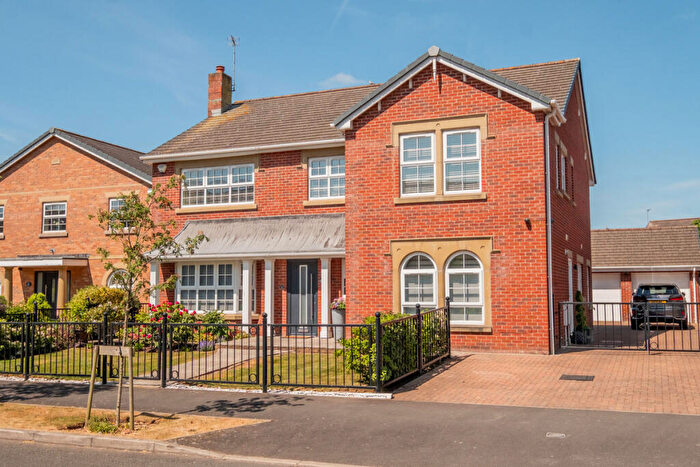
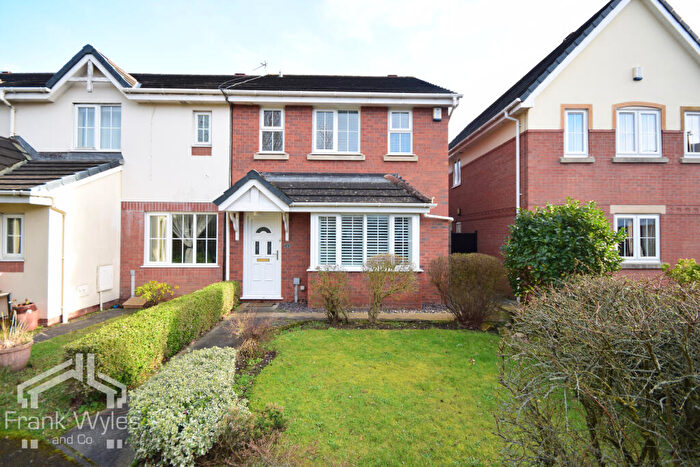
Properties for sale in St Johns
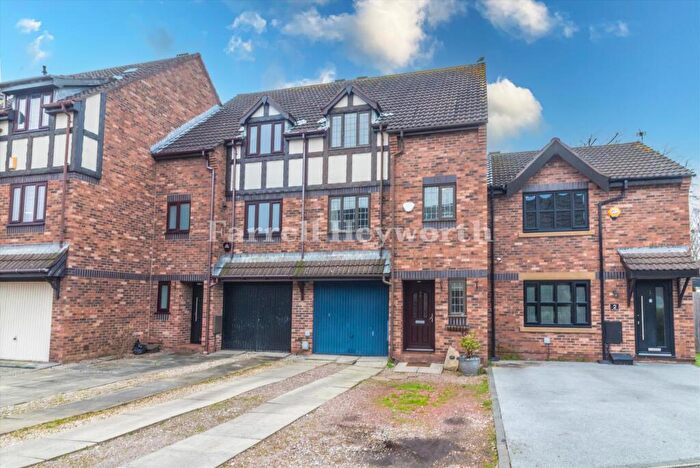
![]()
If you are looking to sell your house, let it out, or receive a property valuation, an expert can help you.
Click the button below to get started.
Roads and Postcodes in St Johns
Navigate through our locations to find the location of your next house in St Johns, Lytham St Annes for sale or to rent.
| Streets | Postcodes |
|---|---|
| Albermarle Road | FY8 5TJ |
| Albert Street | FY8 5EB |
| Arnold Road | FY8 5AR |
| Badgers Walk East | FY8 4BS |
| Badgers Walk West | FY8 4EE |
| Ballam Road | FY8 4LE |
| Bedford Road | FY8 5AP |
| Bellingham Road | FY8 4JH FY8 4JQ |
| Bleasdale Road | FY8 4JA |
| Boundary Road | FY8 5LT |
| Bredon Close | FY8 4LP |
| Brook Road | FY8 4HY |
| Brookfield Terrace | FY8 4HX |
| Browning Avenue | FY8 5BJ |
| Burnham Place | FY8 5TE |
| Burns Avenue | FY8 5BS |
| Byron Avenue | FY8 5BT |
| Chandlers Rest | FY8 5AL |
| Cheltenham Crescent | FY8 4LW |
| Cheviot Avenue | FY8 4TE |
| Chiltern Close | FY8 4TG |
| Cookson Close | FY8 5TN |
| Copeland Place | FY8 4TJ |
| Cotswold Road | FY8 4NN |
| Dock Road | FY8 5AG FY8 5FG FY8 5AQ |
| East Beach | FY8 5EY FY8 5FT |
| East Holme | FY8 4HR |
| Eastham Villas | FY8 4LR |
| Fairsnape Road | FY8 4HG |
| Freckleton Court | FY8 5DS |
| Freckleton Street | FY8 5DY |
| Gatehouse Mews | FY8 5FW |
| Gilderdale Court | FY8 4TP |
| Grampian Way | FY8 4TB |
| Graving Dock Road | FY8 5SB |
| Greenhey | FY8 4HL |
| Grosvenor Street | FY8 5HB |
| Hamilton Close | FY8 5AN |
| Hardy Court | FY8 5TD |
| Howgill Way | FY8 4TA |
| Kielder Court | FY8 4TN |
| Lidun Park Industrial Estate | FY8 5HU |
| Lorne Street | FY8 5BU |
| Lythall Avenue | FY8 4HF |
| Meadow Lane | FY8 5AZ |
| Mendip Close | FY8 4TF |
| Merton Terrace | FY8 5TL FY8 5TR |
| Millbrook Mews | FY8 5AU |
| Mornington Road | FY8 5BA |
| Mythop Avenue | FY8 4HZ |
| Mythop Close | FY8 4JS |
| Mythop Road | FY8 4JP FY8 4HJ FY8 4JD FY8 4HQ FY8 4HB FY8 4SG |
| Nelson Street | FY8 5DA |
| Nelson Way | FY8 5TF |
| Nile Close | FY8 5TS |
| Norfolk Road | FY8 4JG |
| Oswald Road | FY8 5AS |
| Park View Road | FY8 4JF FY8 4JE |
| Patterson Court | FY8 5ED |
| Pendle Place | FY8 4JB |
| Preston Road | FY8 5AT FY8 5AY FY8 5BL FY8 5AA FY8 5BN FY8 5AE FY8 5BG FY8 5FP |
| Ribchester Road | FY8 4HE |
| Rothbury Place | FY8 4TL |
| Saltcotes Place | FY8 4HP |
| Saltcotes Road | FY8 4LJ FY8 4HS FY8 4HN FY8 4HT FY8 4LL FY8 4LS |
| Santa Cruz Avenue | FY8 5TB |
| South Holme | FY8 4JR |
| South Street | FY8 5AF |
| Talbot Road | FY8 4JJ FY8 4JL |
| Tennyson Avenue | FY8 5BP |
| Tewkesbury Drive | FY8 4LN |
| The Belfry | FY8 4NW |
| The Glades | FY8 4TH |
| Trafalgar Place | FY8 5TP |
| Trent Street | FY8 5DD FY8 5DE |
| Vanguard Wharf | FY8 5FQ |
| Victoria Street | FY8 5DB FY8 5DU FY8 5DZ FY8 5EA FY8 5FA FY8 5EF |
| Victory Boulevard | FY8 5TH FY8 5TQ FY8 5TG FY8 5JD FY8 5TU |
| Warton Street | FY8 5BH FY8 5DF FY8 5EZ FY8 5EE |
| Wellington Street | FY8 5BZ |
| Whitecoats Drive | FY8 4HH |
| Wicklow Avenue | FY8 4TD |
| Wordsworth Avenue | FY8 5BW |
| Wykeham Road | FY8 4JN |
Transport near St Johns

- FAQ
- Price Paid By Year
- Property Type Price
Frequently asked questions about St Johns
What is the average price for a property for sale in St Johns?
The average price for a property for sale in St Johns is £313,940. This amount is 17% higher than the average price in Lytham St Annes. There are 773 property listings for sale in St Johns.
What streets have the most expensive properties for sale in St Johns?
The streets with the most expensive properties for sale in St Johns are Norfolk Road at an average of £1,400,000, Bellingham Road at an average of £870,000 and Park View Road at an average of £756,666.
What streets have the most affordable properties for sale in St Johns?
The streets with the most affordable properties for sale in St Johns are Kielder Court at an average of £139,975, Mythop Close at an average of £145,666 and Badgers Walk East at an average of £159,494.
Which train stations are available in or near St Johns?
Some of the train stations available in or near St Johns are Lytham, Moss Side and Ansdell and Fairhaven.
Property Price Paid in St Johns by Year
The average sold property price by year was:
| Year | Average Sold Price | Price Change |
Sold Properties
|
|---|---|---|---|
| 2026 | £360,612 | 12% |
4 Properties |
| 2025 | £317,490 | 6% |
59 Properties |
| 2024 | £299,987 | -7% |
73 Properties |
| 2023 | £321,179 | 5% |
86 Properties |
| 2022 | £304,893 | 4% |
82 Properties |
| 2021 | £293,128 | -7% |
116 Properties |
| 2020 | £313,922 | 19% |
105 Properties |
| 2019 | £254,480 | -2% |
87 Properties |
| 2018 | £259,342 | -4% |
110 Properties |
| 2017 | £270,773 | 17% |
111 Properties |
| 2016 | £223,477 | -8% |
113 Properties |
| 2015 | £241,552 | 9% |
103 Properties |
| 2014 | £220,410 | -9% |
144 Properties |
| 2013 | £239,197 | 11% |
115 Properties |
| 2012 | £213,434 | -12% |
78 Properties |
| 2011 | £239,889 | 4% |
78 Properties |
| 2010 | £230,041 | -11% |
101 Properties |
| 2009 | £254,444 | 7% |
103 Properties |
| 2008 | £236,962 | 2% |
131 Properties |
| 2007 | £233,165 | 16% |
159 Properties |
| 2006 | £196,176 | 18% |
120 Properties |
| 2005 | £161,568 | -10% |
83 Properties |
| 2004 | £177,333 | 25% |
122 Properties |
| 2003 | £133,710 | 15% |
110 Properties |
| 2002 | £113,821 | 27% |
137 Properties |
| 2001 | £83,364 | -6% |
152 Properties |
| 2000 | £88,358 | 14% |
108 Properties |
| 1999 | £76,086 | 8% |
166 Properties |
| 1998 | £70,234 | -6% |
116 Properties |
| 1997 | £74,129 | 9% |
168 Properties |
| 1996 | £67,182 | 5% |
90 Properties |
| 1995 | £63,677 | - |
72 Properties |
Property Price per Property Type in St Johns
Here you can find historic sold price data in order to help with your property search.
The average Property Paid Price for specific property types in the last three years are:
| Property Type | Average Sold Price | Sold Properties |
|---|---|---|
| Semi Detached House | £276,554.00 | 71 Semi Detached Houses |
| Detached House | £555,669.00 | 38 Detached Houses |
| Terraced House | £281,086.00 | 79 Terraced Houses |
| Flat | £198,182.00 | 34 Flats |