
Houses for sale in Lytham St Annes, Lancashire
House Prices in Lytham St Annes
Properties in Lytham St Annes have an average house price of £271k and had 2,555 Property Transactions within the last 3 years.¹
Lytham St Annes is an area in Lancashire with 22,025 households², where the most expensive property was sold for £2.05M.
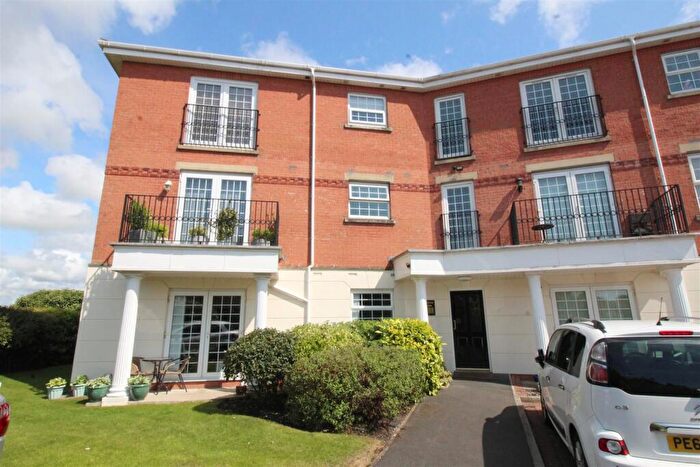
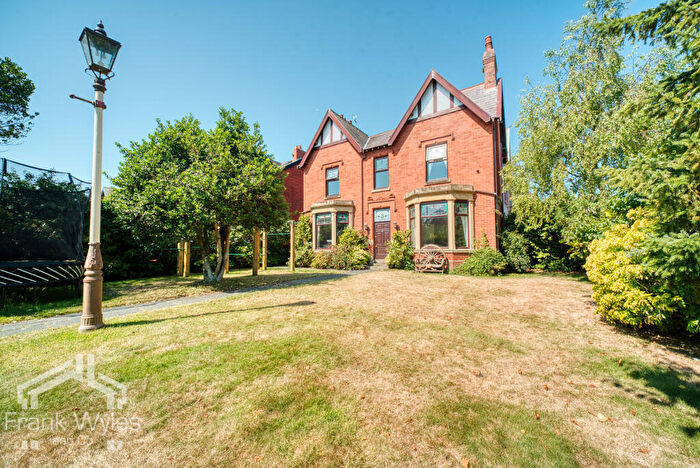
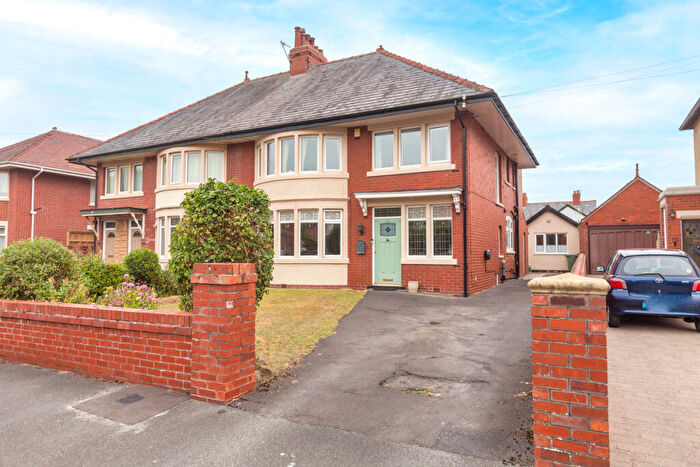
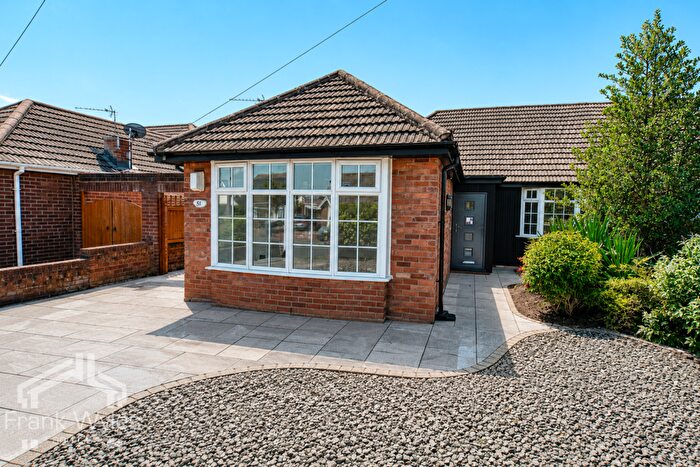
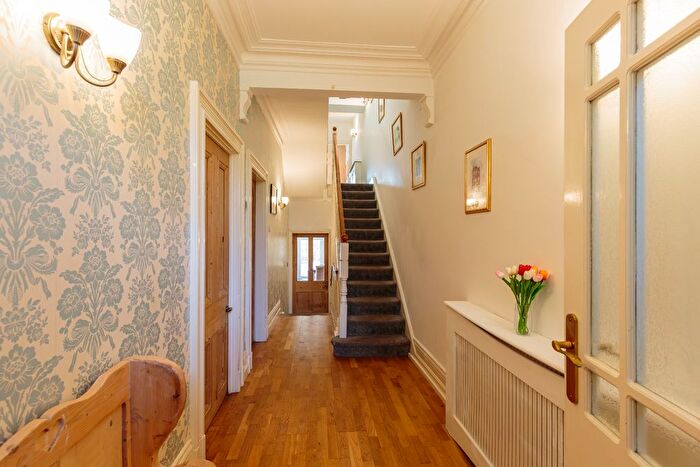
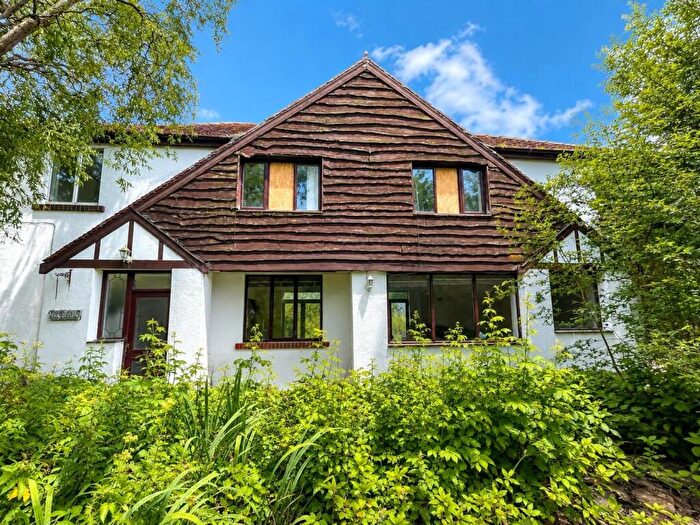
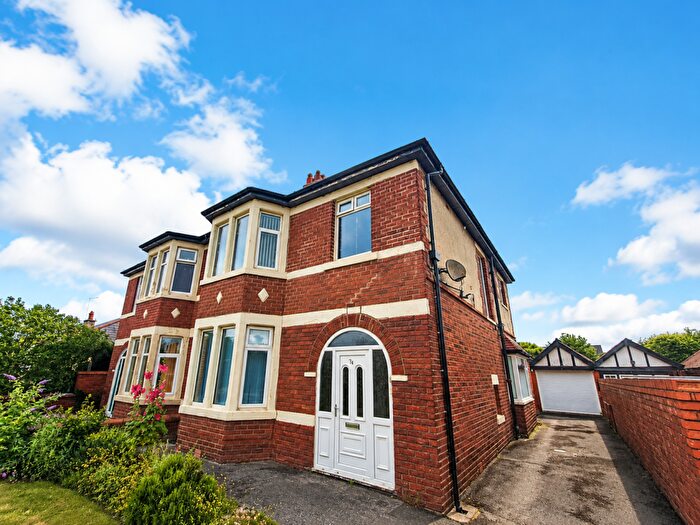
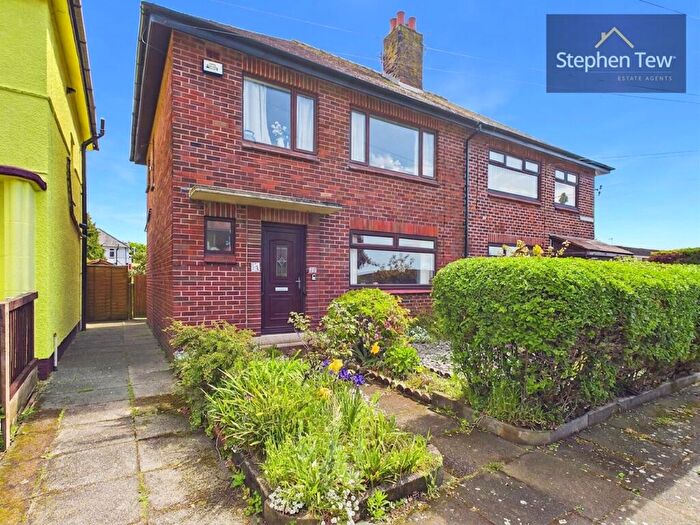
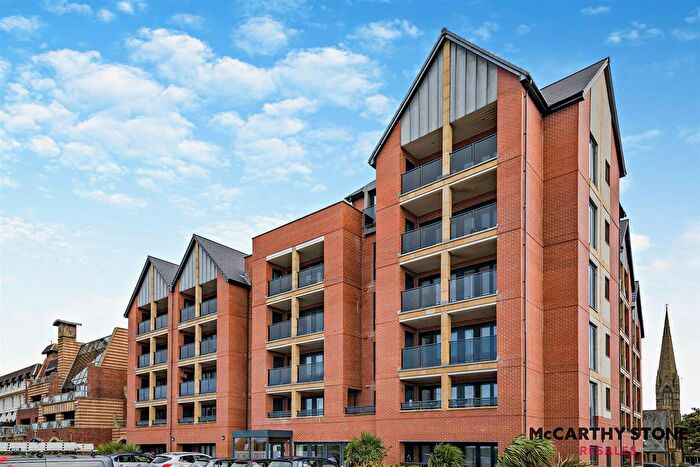
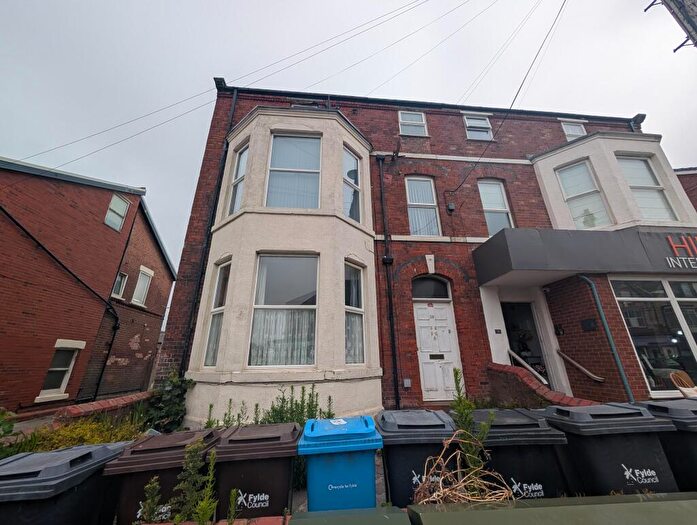
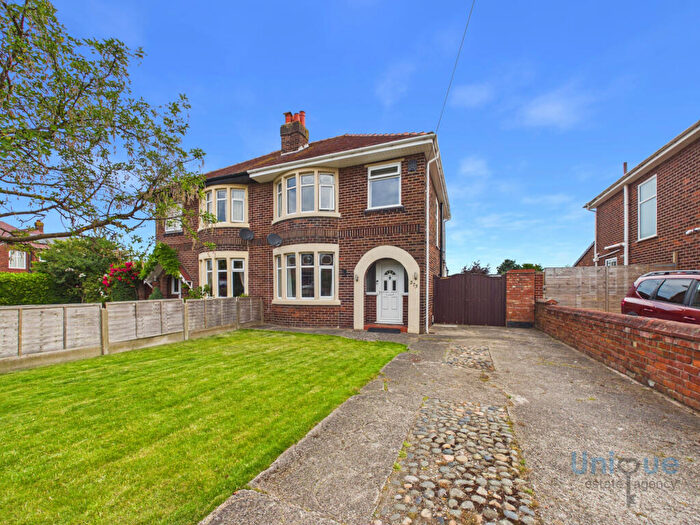
Properties for sale in Lytham St Annes
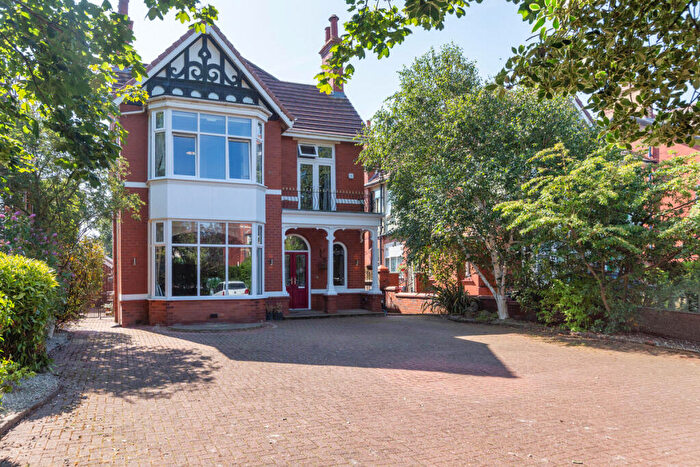
![]()
If you are looking to sell your house, let it out, or receive a property valuation, an expert can help you.
Click the button below to get started.
Neighbourhoods in Lytham St Annes
Navigate through our locations to find the location of your next house in Lytham St Annes, Lancashire for sale or to rent.
Property price trends in Lytham St Annes
According to the latest Land Registry data, the average home in Lytham St Annes sold for £286,473 in 2026. That figure comes from a substantial record of 33,143 sales logged over the past 31 years.
Prices have continued to climb over the last three years. Compared with 2023, when the typical sale came in around £260,771, that's a rise of roughly 9.9%.
Looking back five years, average prices are up about 12.3% since 2021, a gain of around £31,300 in cash terms.
Zoom out to the past decade for the fuller picture. Back in 2016, homes here averaged £212,389, so the typical sold price has climbed about 34.9% since then, roughly 3% a year. Stretch the view to fifteen years and that annual pace eases back to about 2.4%.
Frequently asked questions about Lytham St Annes
What is the average price for a property for sale in Lytham St Annes?
The average price for a property for sale in Lytham St Annes is £271,076. This amount is 29% higher than the average price in Lancashire. There are 9,126 property listings for sale in Lytham St Annes.
What locations have the most expensive properties for sale in Lytham St Annes?
The locations with the most expensive properties for sale in Lytham St Annes are Warton And Westby at an average of £566,506, Clifton at an average of £388,953 and Park at an average of £331,573.
What locations have the most affordable properties for sale in Lytham St Annes?
The locations with the most affordable properties for sale in Lytham St Annes are Kilnhouse at an average of £205,724, Central at an average of £207,597 and St Leonards at an average of £216,261.
Which train stations are available in or near Lytham St Annes?
Some of the train stations available in or near Lytham St Annes are Ansdell and Fairhaven, St.Annes-On-The-Sea and Lytham.
Property Price Paid in Lytham St Annes by Year
The average sold property price by year was:
| Year | Average Sold Price | Price Change |
Sold Properties
|
|---|---|---|---|
| 2026 | £286,473 | 1% |
50 Properties |
| 2025 | £283,861 | 6% |
796 Properties |
| 2024 | £268,235 | 3% |
893 Properties |
| 2023 | £260,771 | -4% |
816 Properties |
| 2022 | £270,985 | 6% |
1,079 Properties |
| 2021 | £255,173 | 2% |
1,275 Properties |
| 2020 | £250,472 | 9% |
907 Properties |
| 2019 | £228,860 | 2% |
1,037 Properties |
| 2018 | £224,275 | -4% |
1,000 Properties |
| 2017 | £232,267 | 9% |
1,084 Properties |
Property Price per Property Type in Lytham St Annes
Here you can find historic sold price data in order to help with your property search.
The average Property Paid Price for specific property types in the last three years are:
| Property Type | Average Sold Price | Sold Properties |
|---|---|---|
| Semi Detached House | £277,432.00 | 710 Semi Detached Houses |
| Terraced House | £253,805.00 | 412 Terraced Houses |
| Detached House | £419,410.00 | 607 Detached Houses |
| Flat | £165,222.00 | 826 Flats |
Transport in Lytham St Annes
Please see below transportation links in this area:
