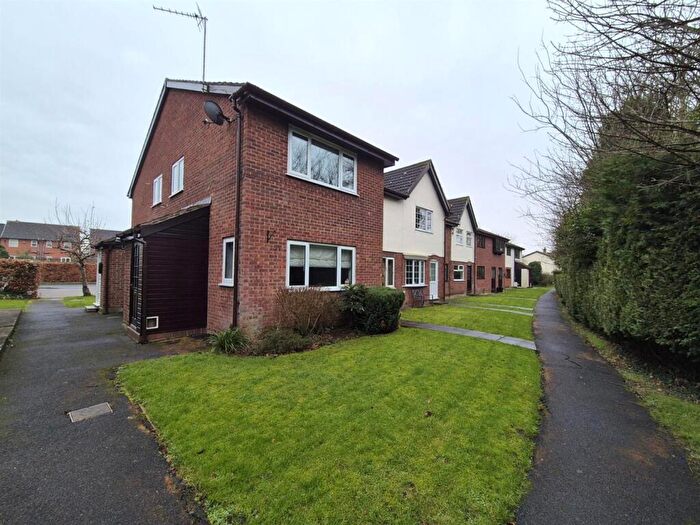
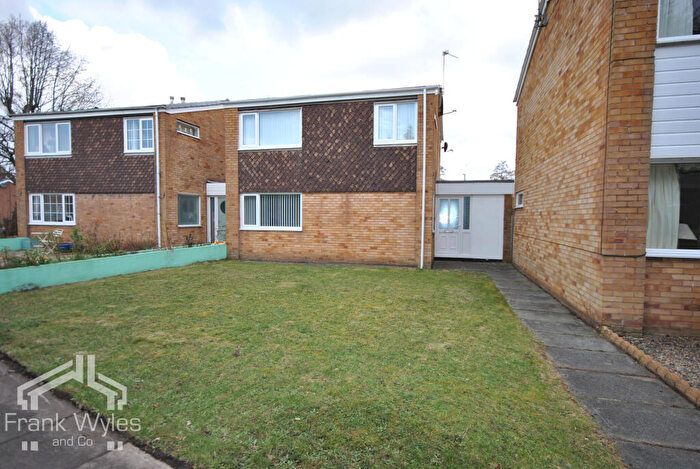
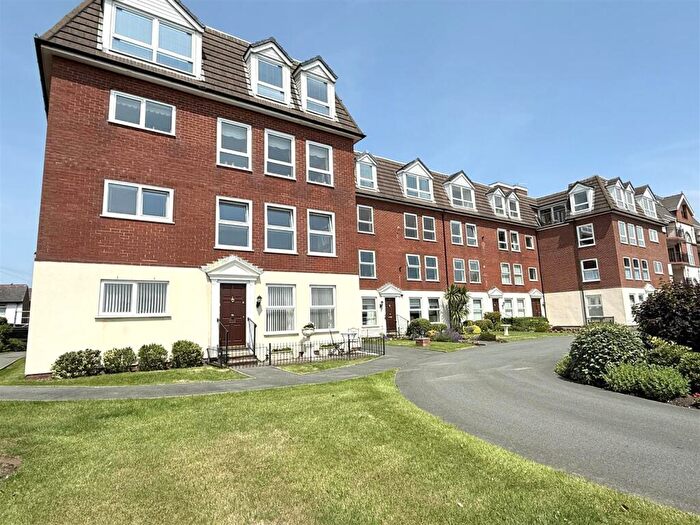
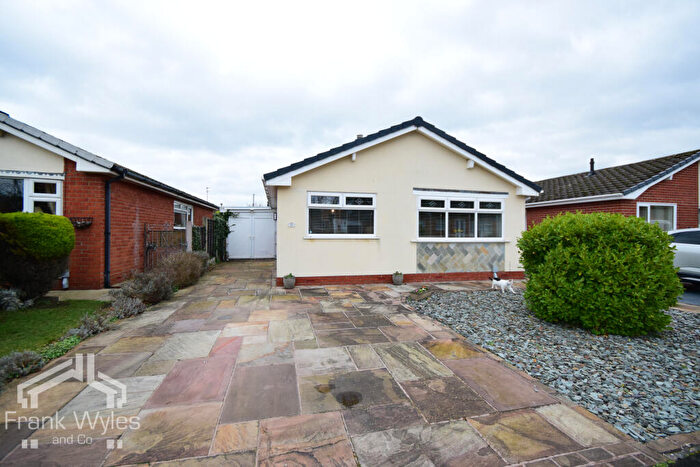
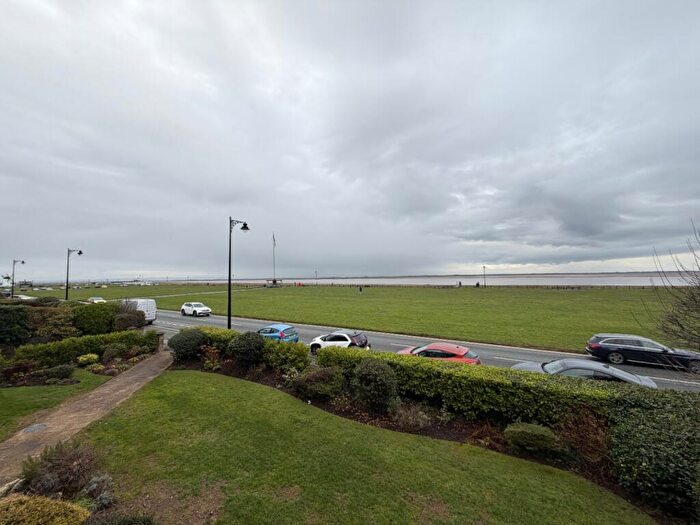
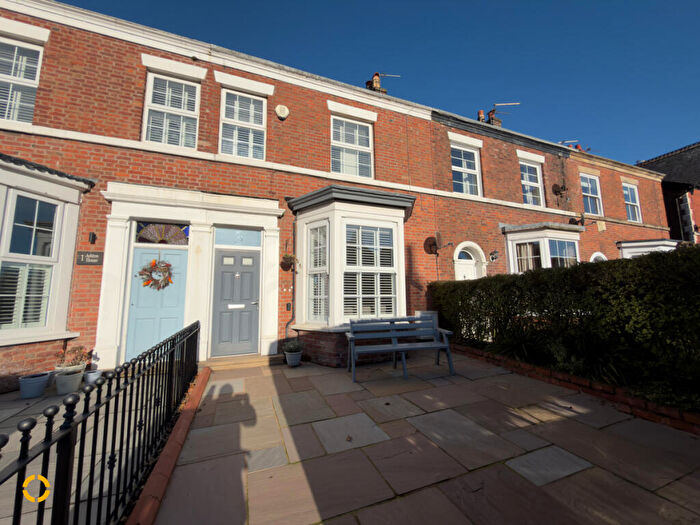
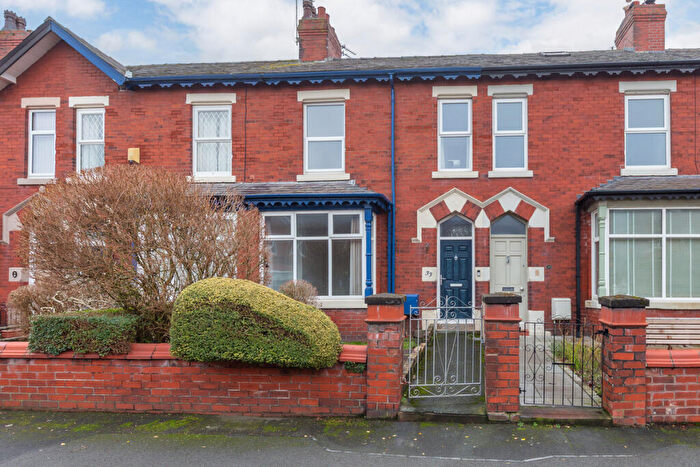
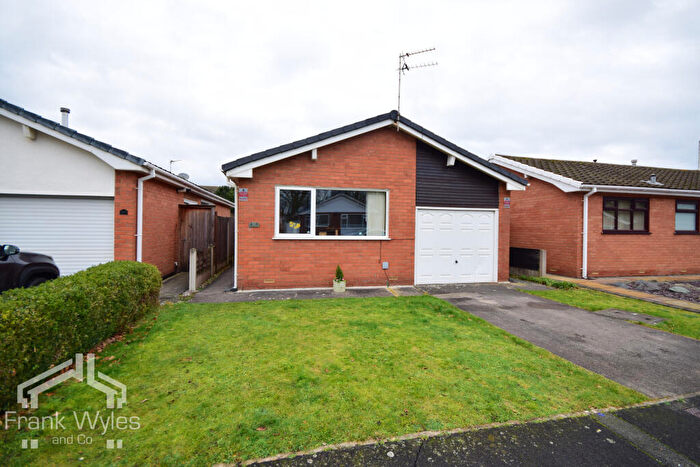
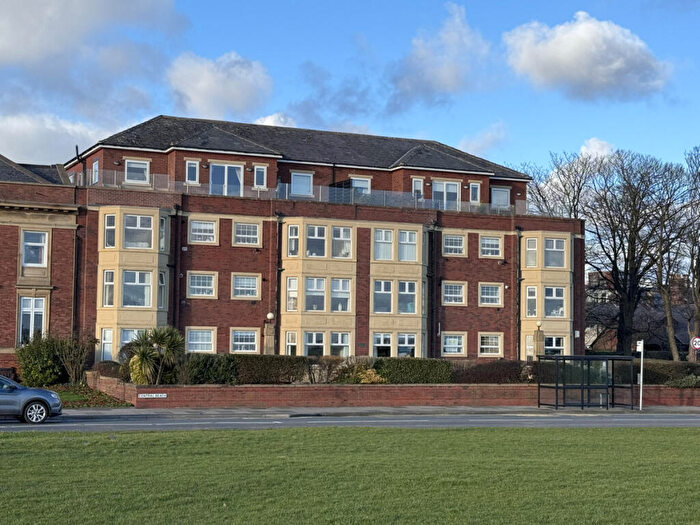
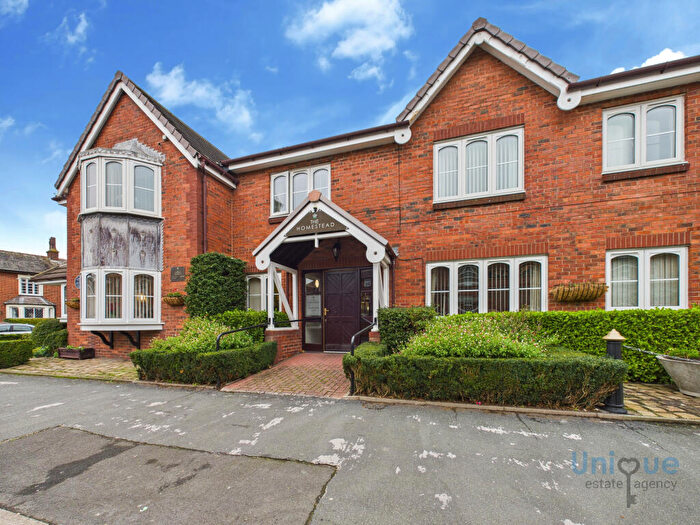
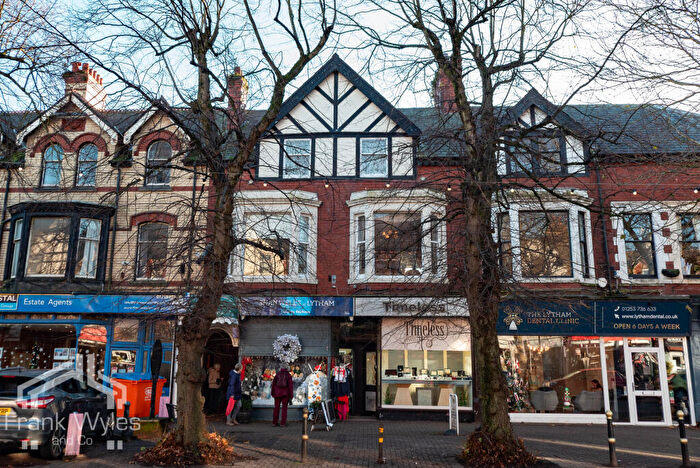
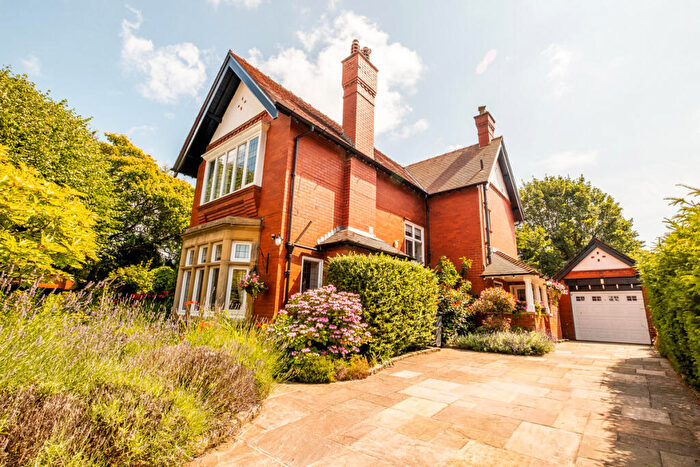
Houses for sale & to rent in Clifton, Lytham St Annes
House Prices in Clifton
Properties in Clifton have an average house price of £377,351.00 and had 212 Property Transactions within the last 3 years¹.
Clifton is an area in Lytham St Annes, Lancashire with 2,095 households², where the most expensive property was sold for £1,845,000.00.
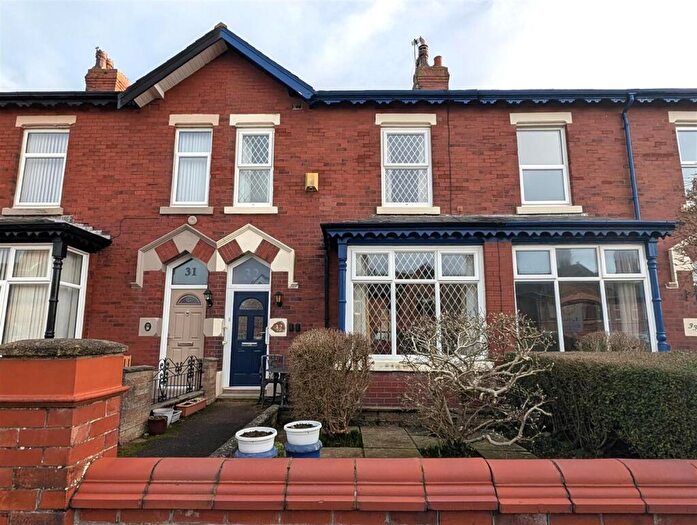
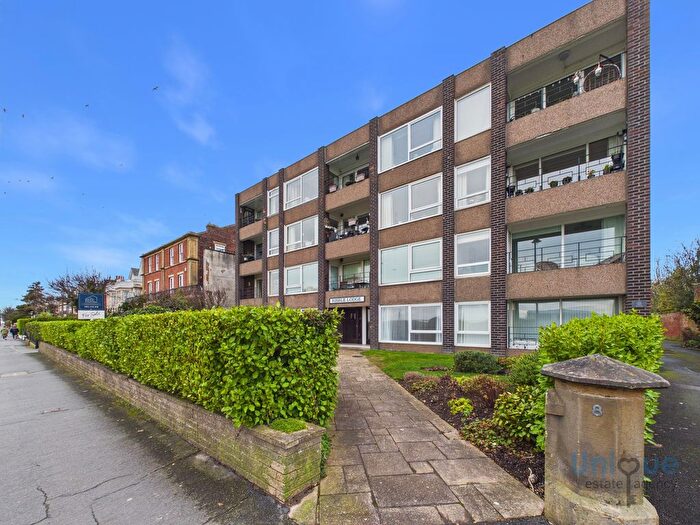
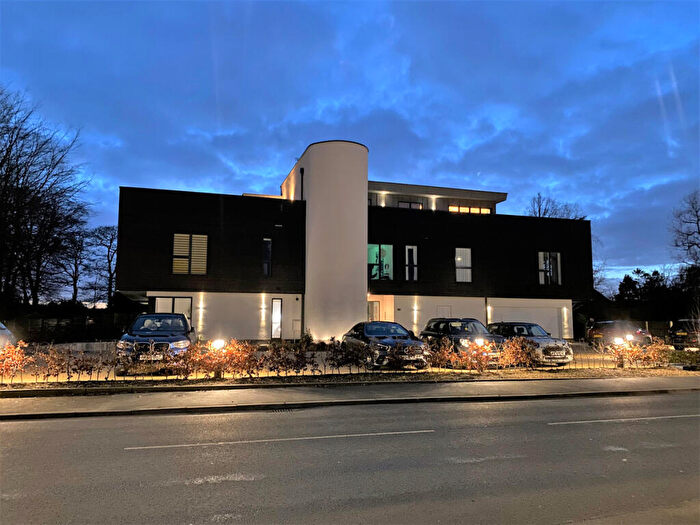
Properties for sale in Clifton
Roads and Postcodes in Clifton
Navigate through our locations to find the location of your next house in Clifton, Lytham St Annes for sale or to rent.
| Streets | Postcodes |
|---|---|
| Agnew Street | FY8 5NJ |
| Alder Grove | FY8 4LA |
| Allansons Walk | FY8 5HT |
| Ashton Street | FY8 5NT |
| Ballam Oaks | FY8 4GZ |
| Ballam Road | FY8 4LF FY8 4LD FY8 4JZ FY8 4TS |
| Bannister Street | FY8 5HQ FY8 5JJ FY8 5HP |
| Bath Road | FY8 5RL |
| Bath Street | FY8 5ES |
| Beach Street | FY8 5NS |
| Beechwood Close | FY8 4BF |
| Birch Street | FY8 5DT |
| Broadlands Place | FY8 4PX |
| Calf Croft Place | FY8 4PU |
| Cecil Street | FY8 5NN |
| Central Beach | FY8 5LB FY8 5RS FY8 5LD |
| Chapel Street | FY8 5ND |
| Church Drive | FY8 5PE |
| Church Road | FY8 5QL FY8 5JN FY8 5LH FY8 5LL FY8 5LN FY8 5QF FY8 5QN FY8 5QD |
| Cleveland Road | FY8 5JH |
| Clifton Gate | FY8 4QX |
| Clifton Square | FY8 5JP FY8 5LR |
| Clifton Street | FY8 5EP FY8 5EN FY8 5ER FY8 5EW FY8 5EH |
| Cottage Row | FY8 5FR |
| Dicconson Terrace | FY8 5JY |
| East Beach | FY8 5EQ FY8 5ET FY8 5EU FY8 5HX FY8 5EX |
| East Cliffe | FY8 5DX |
| Forest Drive | FY8 4PS FY8 4QG |
| Garlicks Cottages | FY8 5DN |
| George Street | FY8 5HS |
| Green Street | FY8 5LG |
| Gregory Place | FY8 4SB |
| Gregson Street | FY8 5NU |
| Hastings Place | FY8 5LZ FY8 5LA |
| Haven Road | FY8 5FJ FY8 5EG |
| Henry Street | FY8 5LE |
| Holcroft Place | FY8 4PW |
| Horsfall Avenue | FY8 5NP |
| Laburnum Avenue | FY8 4LH |
| Laurel Avenue | FY8 4LQ |
| Lilac Avenue | FY8 4LG |
| Livesey Street | FY8 5NY |
| Long Acre Place | FY8 4PN |
| Lowther Terrace | FY8 5QQ FY8 5QG |
| Lytham Hall Park | FY8 4JX |
| Market Square | FY8 5LW FY8 5LS |
| Molyneux Place | FY8 4PY |
| Moorfield Drive | FY8 4QB |
| Nookfield Close | FY8 4QD |
| North Clifton Street | FY8 5HR FY8 5HW FY8 5FN |
| North Warton Street | FY8 5DW FY8 5DL FY8 5FH |
| Painley Close | FY8 4QE |
| Park Street | FY8 5LU |
| Park View Road | FY8 4HA |
| Pleasant Street | FY8 5FL FY8 5JA |
| Queen Street | FY8 5LQ |
| Reedy Acre Place | FY8 4PR |
| Ring Dyke Way | FY8 4PT |
| Rogerley Close | FY8 4PL |
| School Lane | FY8 5NL |
| Seafield Road | FY8 5PY |
| Sedwell Close | FY8 4PP |
| Serpentine Walk | FY8 5PB |
| Shepherd Street | FY8 5HJ |
| South Clifton Street | FY8 5HG FY8 5HH FY8 5HL FY8 5HN |
| South Park | FY8 4QQ FY8 4QU FY8 4QH |
| South Warton Street | FY8 5HE |
| South Westby Street | FY8 5JE |
| Southfold Place | FY8 4PZ |
| St Cuthberts Close | FY8 5NR |
| St Johns Street | FY8 5HD |
| Starfield Close | FY8 4QA |
| Station Road | FY8 5HF FY8 5DH FY8 5DJ |
| Station Square | FY8 5PA FY8 5NE |
| Swainson Street | FY8 5QA |
| Talbot Terrace | FY8 5JQ |
| The Homestead | FY8 5LJ |
| The Leylands | FY8 5QS |
| The Serpentine | FY8 5NW |
| Thomas Street | FY8 5LF |
| Upper Westby Street | FY8 5NG FY8 5NH FY8 5NQ |
| Warton Street | FY8 5DG FY8 5DQ FY8 5HA FY8 5JB |
| Watchwood Drive | FY8 4NP |
| West Beach | FY8 5QH FY8 5QJ FY8 5PZ |
| West Cliffe | FY8 5DR |
| Westby Street | FY8 5JF FY8 5JG FY8 5NF |
| Westwood Mews | FY8 5QE |
| Westwood Road | FY8 5NX |
| Wharf Street | FY8 5DP |
| Woodville Terrace | FY8 5QB |
Transport near Clifton
- FAQ
- Price Paid By Year
- Property Type Price
Frequently asked questions about Clifton
What is the average price for a property for sale in Clifton?
The average price for a property for sale in Clifton is £377,351. This amount is 40% higher than the average price in Lytham St Annes. There are 830 property listings for sale in Clifton.
What streets have the most expensive properties for sale in Clifton?
The streets with the most expensive properties for sale in Clifton are Ballam Oaks at an average of £1,593,750, Seafield Road at an average of £941,666 and Station Road at an average of £877,500.
What streets have the most affordable properties for sale in Clifton?
The streets with the most affordable properties for sale in Clifton are The Homestead at an average of £151,990, Westwood Road at an average of £153,500 and Haven Road at an average of £171,200.
Which train stations are available in or near Clifton?
Some of the train stations available in or near Clifton are Lytham, Ansdell and Fairhaven and Moss Side.
Property Price Paid in Clifton by Year
The average sold property price by year was:
| Year | Average Sold Price | Price Change |
Sold Properties
|
|---|---|---|---|
| 2025 | £371,975 | -10% |
76 Properties |
| 2024 | £409,936 | 17% |
79 Properties |
| 2023 | £339,358 | -16% |
57 Properties |
| 2022 | £393,720 | 4% |
105 Properties |
| 2021 | £379,876 | 12% |
145 Properties |
| 2020 | £332,755 | 1% |
83 Properties |
| 2019 | £329,126 | -3% |
99 Properties |
| 2018 | £339,837 | 5% |
95 Properties |
| 2017 | £323,499 | 16% |
105 Properties |
| 2016 | £271,740 | 9% |
131 Properties |
| 2015 | £247,720 | -9% |
123 Properties |
| 2014 | £270,940 | 6% |
131 Properties |
| 2013 | £255,735 | -1% |
126 Properties |
| 2012 | £257,419 | 0,3% |
74 Properties |
| 2011 | £256,700 | -3% |
87 Properties |
| 2010 | £263,194 | 12% |
95 Properties |
| 2009 | £230,751 | -3% |
86 Properties |
| 2008 | £236,900 | -16% |
69 Properties |
| 2007 | £275,915 | 9% |
147 Properties |
| 2006 | £250,176 | 8% |
193 Properties |
| 2005 | £230,866 | 9% |
94 Properties |
| 2004 | £210,280 | 12% |
151 Properties |
| 2003 | £184,450 | 24% |
133 Properties |
| 2002 | £140,601 | 7% |
177 Properties |
| 2001 | £131,233 | 22% |
160 Properties |
| 2000 | £102,005 | -1% |
160 Properties |
| 1999 | £103,378 | 21% |
148 Properties |
| 1998 | £81,172 | -3% |
158 Properties |
| 1997 | £83,242 | -2% |
148 Properties |
| 1996 | £85,128 | 9% |
113 Properties |
| 1995 | £77,444 | - |
75 Properties |
Property Price per Property Type in Clifton
Here you can find historic sold price data in order to help with your property search.
The average Property Paid Price for specific property types in the last three years are:
| Property Type | Average Sold Price | Sold Properties |
|---|---|---|
| Semi Detached House | £457,462.00 | 27 Semi Detached Houses |
| Detached House | £370,169.00 | 73 Detached Houses |
| Terraced House | £422,983.00 | 60 Terraced Houses |
| Flat | £293,186.00 | 52 Flats |

