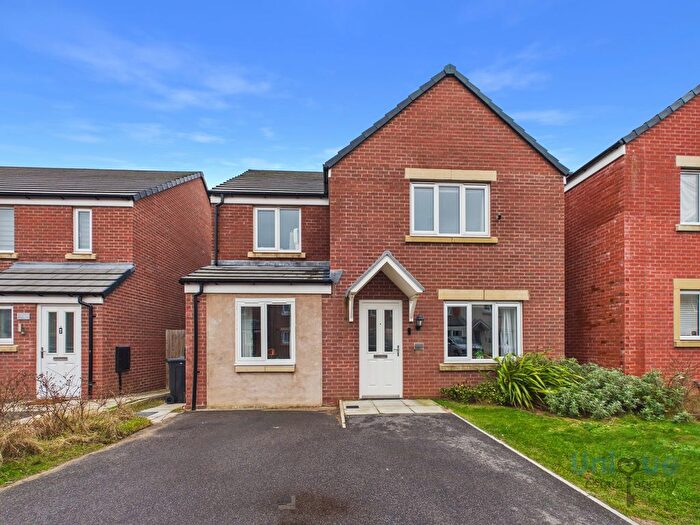
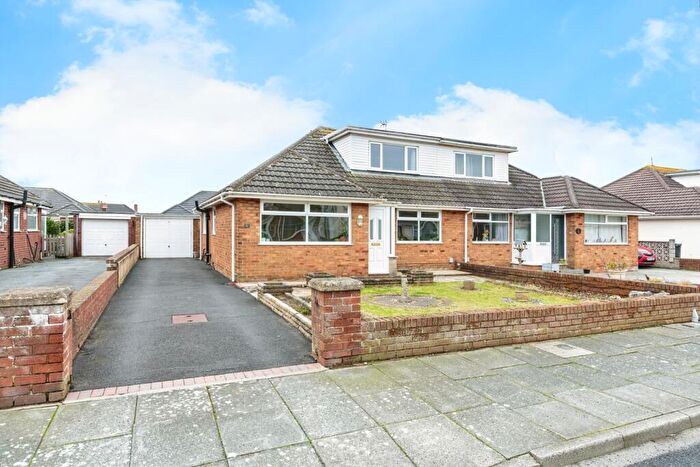
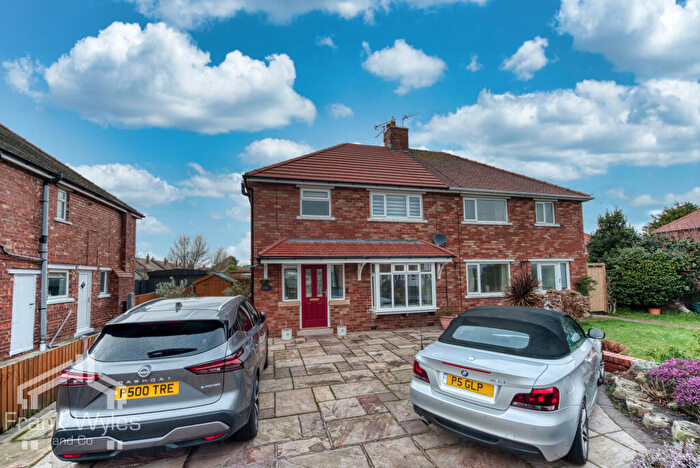
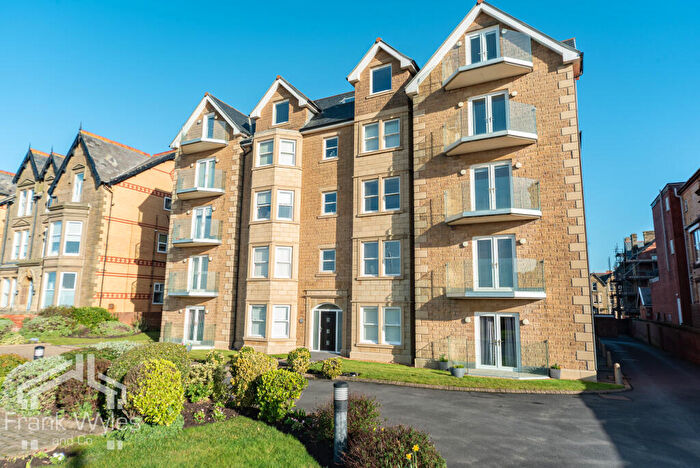
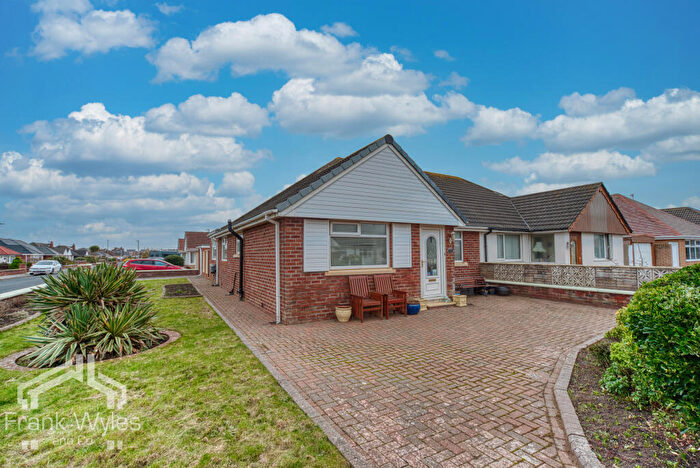
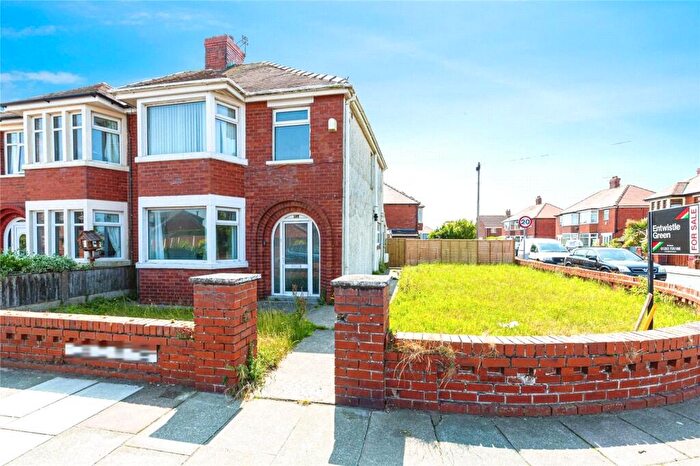
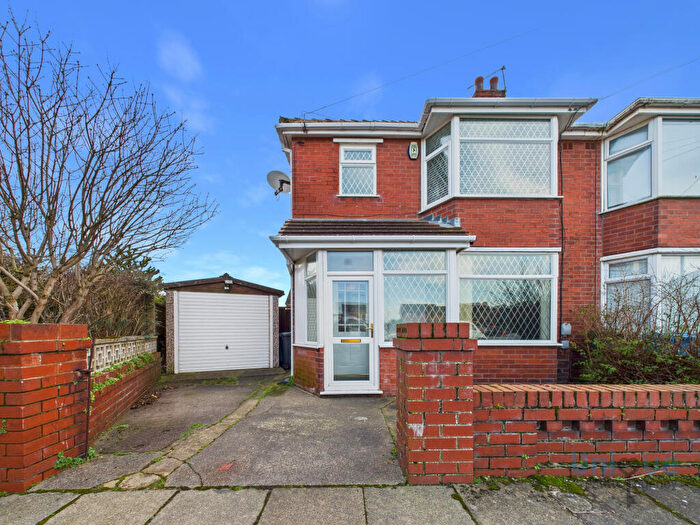
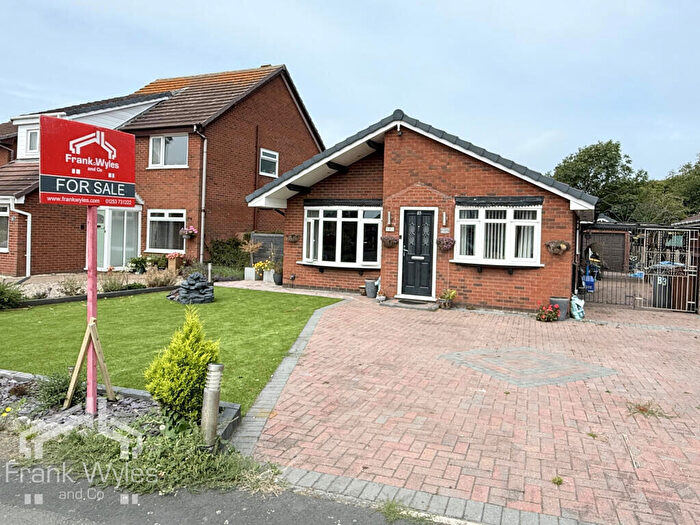
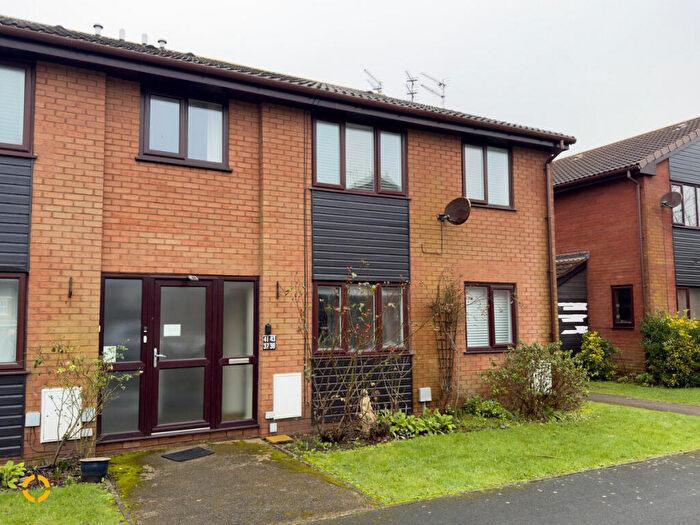
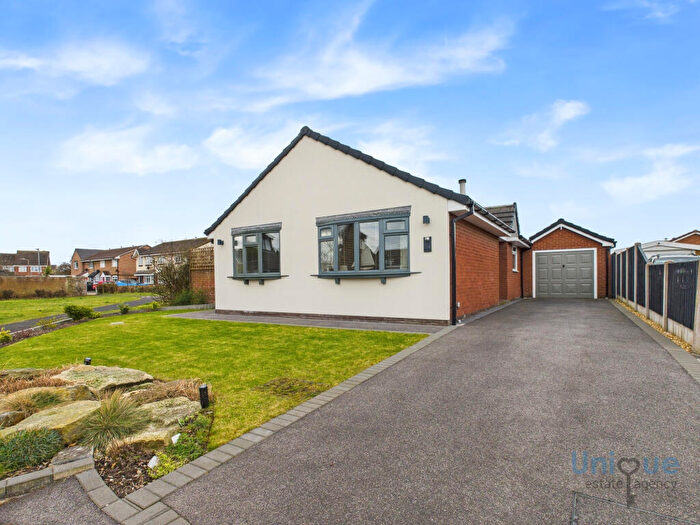
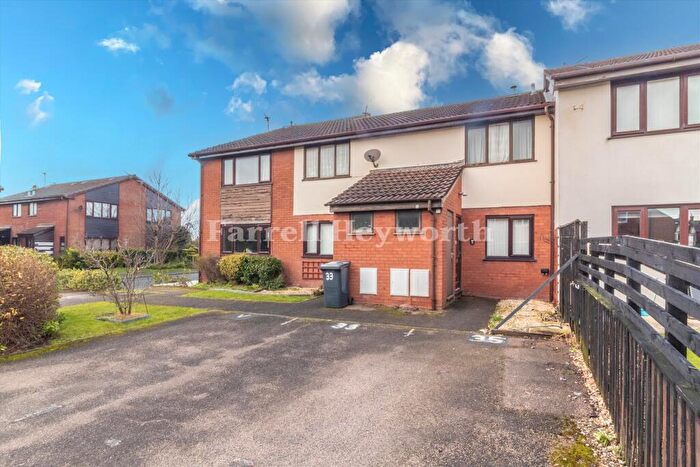
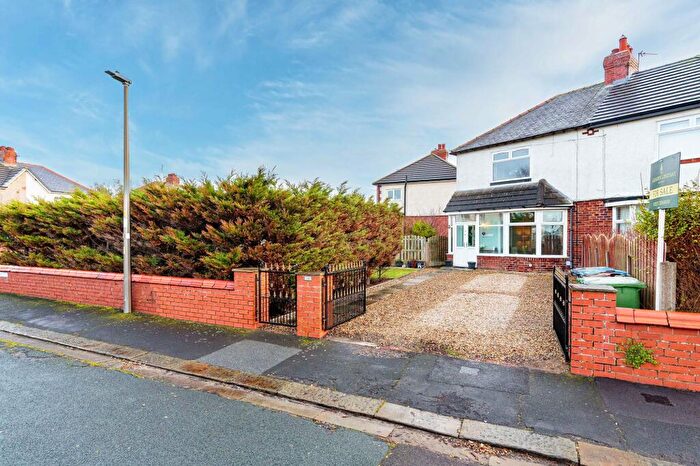
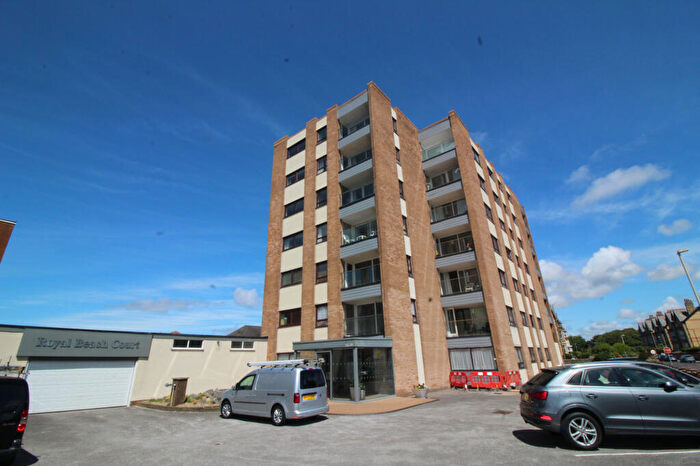
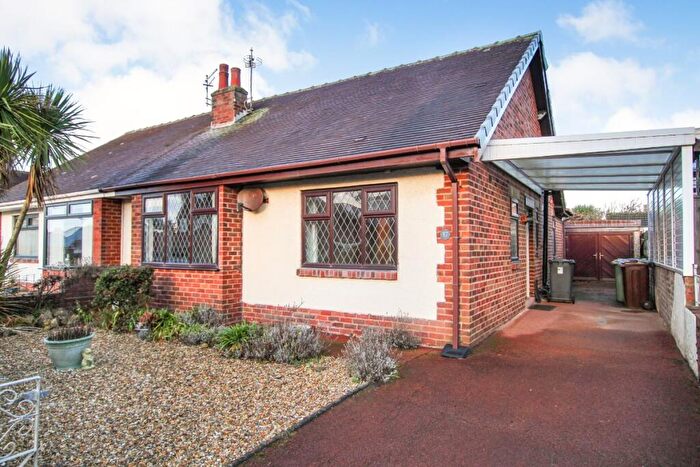
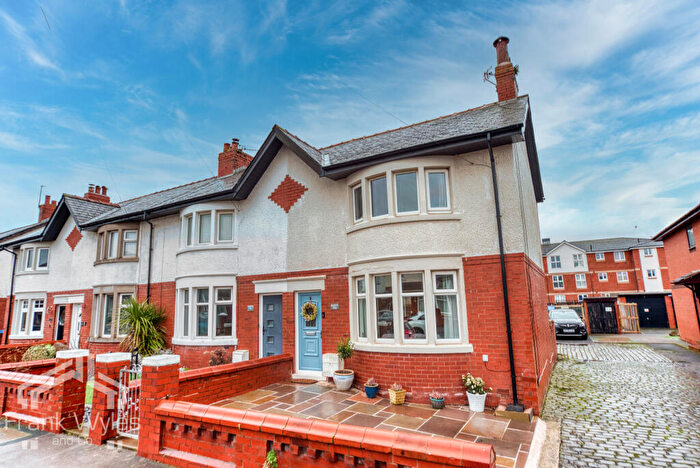
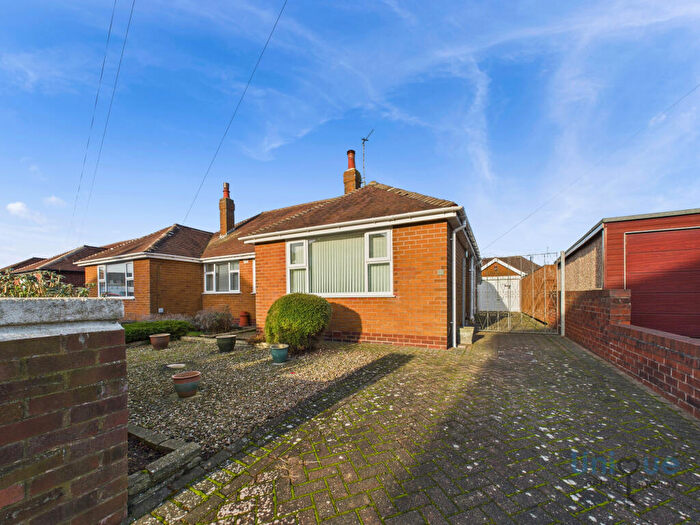
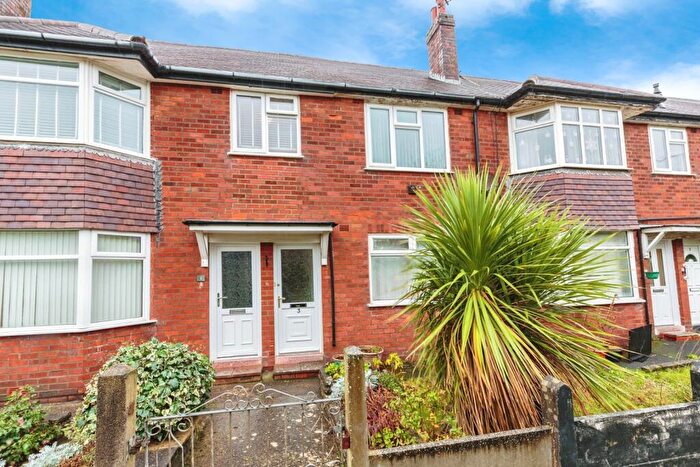
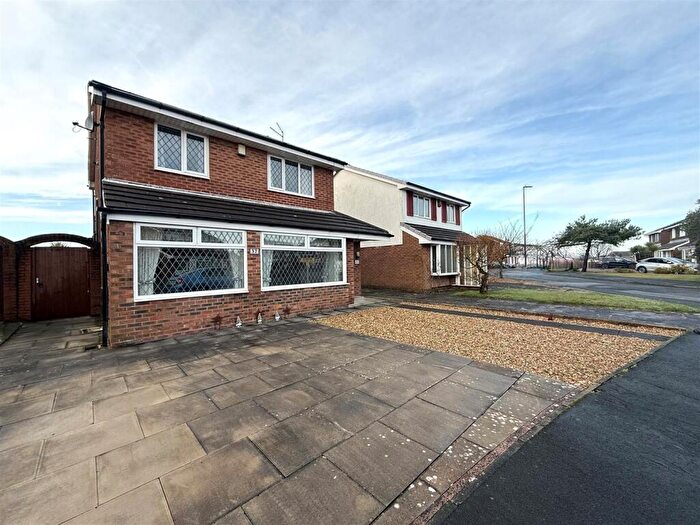
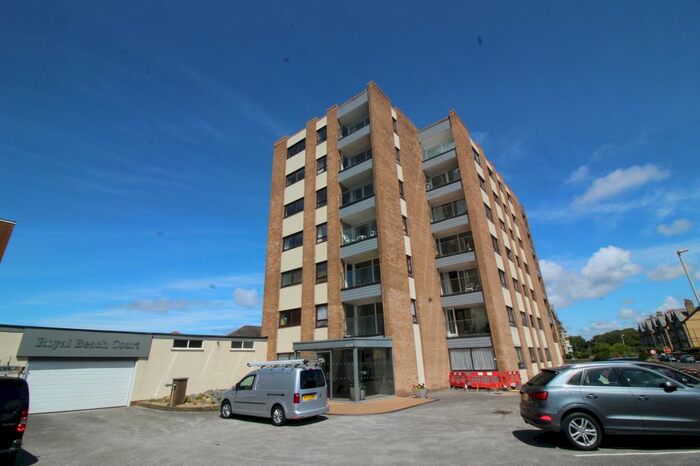
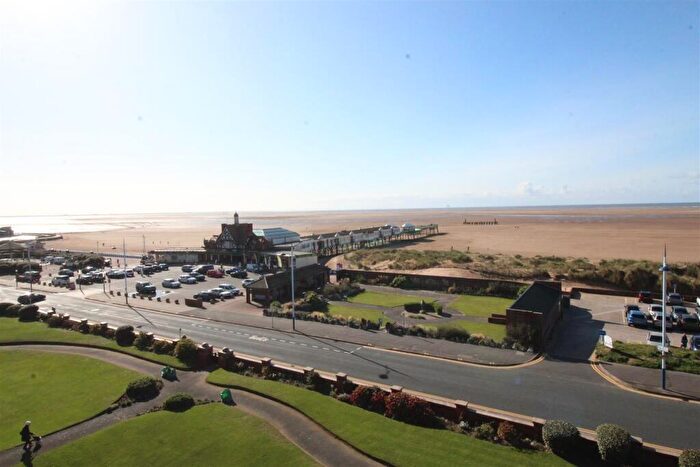
Houses for sale & to rent in St Leonards, Lytham St Annes
House Prices in St Leonards
Properties in St Leonards have an average house price of £212,975.00 and had 254 Property Transactions within the last 3 years¹.
St Leonards is an area in Lytham St Annes, Lancashire with 1,989 households², where the most expensive property was sold for £900,000.00.
Properties for sale in St Leonards
Roads and Postcodes in St Leonards
Navigate through our locations to find the location of your next house in St Leonards, Lytham St Annes for sale or to rent.
| Streets | Postcodes |
|---|---|
| Addison Way | FY8 2FL |
| Admiral Close | FY8 2TH |
| Almond Close | FY8 2FD |
| Ambleside Road | FY8 2LJ |
| Anchor Way | FY8 2TG |
| Anson Close | FY8 2SD |
| Ashworth Road | FY8 2FU FY8 2FW |
| Barton Road | FY8 2JZ |
| Beatty Close | FY8 2SZ |
| Benbow Close | FY8 2TB |
| Blenheim Place | FY8 2RY |
| Bridgeside | FY8 2SN |
| Broster Grove | FY8 2FS |
| Capstan Close | FY8 2TF |
| Chatham Avenue | FY8 2RT |
| Christal Avenue | FY8 2FB |
| Clifton Drive North | FY8 2RN FY8 2QU FY8 2QX FY8 2SU |
| Clive Avenue | FY8 2RU FY8 2RX |
| Collingwood Avenue | FY8 2SB |
| Condor Grove | FY8 2HE |
| Cross Street | FY8 2HU |
| Crystal Grove | FY8 2HG |
| Dalton Street | FY8 2HX |
| Dobson Avenue | FY8 2HH |
| Drake Close | FY8 2EX |
| Duncan Close | FY8 2RZ |
| East Gate Close | FY8 2SL |
| Fletcher Drive | FY8 2FA |
| Forshaw Avenue | FY8 2HT |
| Frobisher Drive | FY8 2RG FY8 2EW FY8 2TW |
| Grasmere Road | FY8 2HZ FY8 2RP |
| Grenville Avenue | FY8 2RR |
| Harwood Avenue | FY8 2HJ |
| Heeley Road | FY8 2JY FY8 2LH FY8 2HS FY8 2HR |
| Highbury Road East | FY8 2LE FY8 2LF FY8 2LG FY8 2RW FY8 2LB FY8 2LY FY8 2LD FY8 2LR |
| Hopwood Close | FY8 2TY |
| Hornsey Avenue | FY8 2SW |
| Horrocks Avenue | FY8 2FH |
| Howard Close | FY8 2BY |
| Howarth Road | FY8 2TZ |
| Jellicoe Close | FY8 2TA |
| Jervis Close | FY8 2RL |
| Kendal Road | FY8 2LQ |
| Kershaw Close | FY8 2FT |
| Keswick Road | FY8 2HN |
| Kilgrimol Gardens | FY8 2RB FY8 2QY FY8 2RA |
| Kirkstone Road | FY8 2LW |
| Langdale Road | FY8 2LL |
| Leach Lane | FY8 3AN FY8 3AW |
| Marlborough Road | FY8 2RS |
| Martin Avenue | FY8 2SJ |
| Myerscough Avenue | FY8 2HY |
| Napier Close | FY8 2RJ |
| New Road | FY8 2SR FY8 2SS FY8 2ST |
| Porritt Place | FY8 2EY |
| Press Road | FY8 2LU |
| Raleigh Close | FY8 2SE |
| Ramsey Close | FY8 2RH |
| Redfern Way | FY8 2FN |
| Rodney Avenue | FY8 2SA |
| Rydal Road | FY8 2HP |
| Salcombe Road | FY8 2RD |
| Seaton Crescent | FY8 2RF |
| Sidmouth Road | FY8 2QZ |
| Squires Gate Lane | FY8 2FX |
| St Davids Grove | FY8 2QR FY8 2QS |
| St Davids Road North | FY8 2JS FY8 2JU FY8 2JX |
| St Leonards Road East | FY8 2HF FY8 2HW |
| The Brambles | FY8 2SF |
| Troutbeck Road | FY8 2LN |
| Tudor Road | FY8 2LA |
| Vernon Road | FY8 2RQ |
| Westgate Road | FY8 2SG FY8 2SQ FY8 2TS |
Transport near St Leonards
-
Squires Gate Station
-
St.Annes-On-The-Sea Station
-
Blackpool Pleasure Beach Station
-
Blackpool South Station
-
Ansdell and Fairhaven Station
- FAQ
- Price Paid By Year
- Property Type Price
Frequently asked questions about St Leonards
What is the average price for a property for sale in St Leonards?
The average price for a property for sale in St Leonards is £212,975. This amount is 21% lower than the average price in Lytham St Annes. There are 1,057 property listings for sale in St Leonards.
What streets have the most expensive properties for sale in St Leonards?
The streets with the most expensive properties for sale in St Leonards are Blenheim Place at an average of £375,000, Marlborough Road at an average of £341,750 and Seaton Crescent at an average of £320,000.
What streets have the most affordable properties for sale in St Leonards?
The streets with the most affordable properties for sale in St Leonards are New Road at an average of £55,750, The Brambles at an average of £91,300 and St Davids Grove at an average of £97,958.
Which train stations are available in or near St Leonards?
Some of the train stations available in or near St Leonards are Squires Gate, St.Annes-On-The-Sea and Blackpool Pleasure Beach.
Property Price Paid in St Leonards by Year
The average sold property price by year was:
| Year | Average Sold Price | Price Change |
Sold Properties
|
|---|---|---|---|
| 2025 | £224,261 | 7% |
87 Properties |
| 2024 | £208,620 | 2% |
92 Properties |
| 2023 | £205,224 | 5% |
75 Properties |
| 2022 | £194,790 | 13% |
126 Properties |
| 2021 | £169,651 | -5% |
122 Properties |
| 2020 | £177,768 | 3% |
118 Properties |
| 2019 | £171,689 | -1% |
132 Properties |
| 2018 | £173,820 | 1% |
131 Properties |
| 2017 | £171,846 | 1% |
96 Properties |
| 2016 | £170,846 | 8% |
122 Properties |
| 2015 | £157,277 | 4% |
85 Properties |
| 2014 | £150,244 | 3% |
74 Properties |
| 2013 | £145,102 | 8% |
60 Properties |
| 2012 | £133,136 | 2% |
44 Properties |
| 2011 | £129,854 | -12% |
54 Properties |
| 2010 | £144,926 | 5% |
65 Properties |
| 2009 | £137,994 | -2% |
58 Properties |
| 2008 | £140,484 | -9% |
47 Properties |
| 2007 | £153,686 | -1% |
120 Properties |
| 2006 | £154,504 | 16% |
119 Properties |
| 2005 | £129,955 | -1% |
80 Properties |
| 2004 | £131,803 | 28% |
113 Properties |
| 2003 | £94,435 | 19% |
160 Properties |
| 2002 | £76,232 | 10% |
175 Properties |
| 2001 | £68,478 | 3% |
134 Properties |
| 2000 | £66,486 | 14% |
124 Properties |
| 1999 | £57,124 | -2% |
113 Properties |
| 1998 | £58,422 | 5% |
93 Properties |
| 1997 | £55,428 | 9% |
128 Properties |
| 1996 | £50,532 | -11% |
97 Properties |
| 1995 | £56,112 | - |
70 Properties |
Property Price per Property Type in St Leonards
Here you can find historic sold price data in order to help with your property search.
The average Property Paid Price for specific property types in the last three years are:
| Property Type | Average Sold Price | Sold Properties |
|---|---|---|
| Semi Detached House | £210,273.00 | 103 Semi Detached Houses |
| Detached House | £305,306.00 | 65 Detached Houses |
| Terraced House | £165,845.00 | 45 Terraced Houses |
| Flat | £125,109.00 | 41 Flats |

