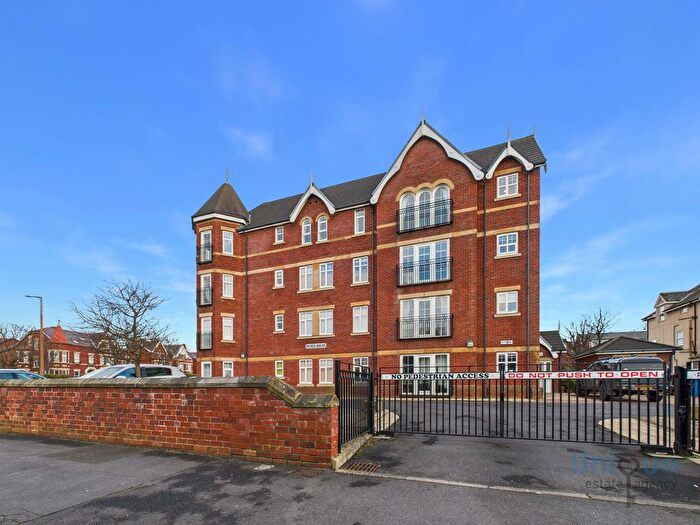
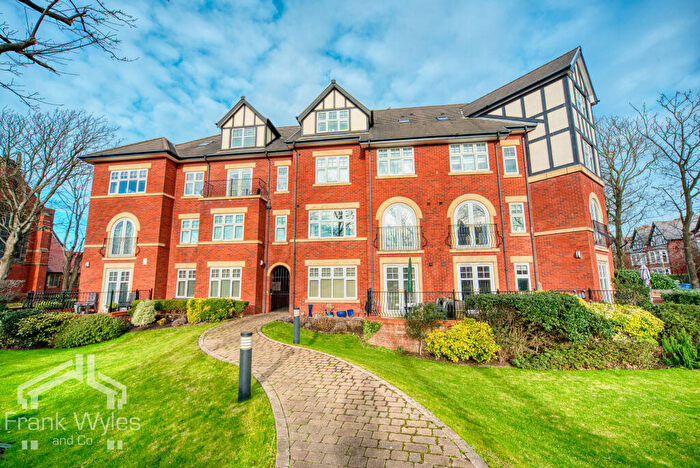
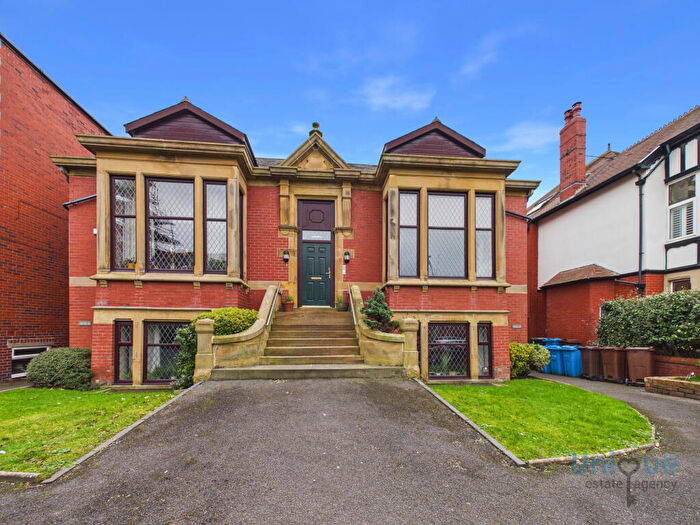
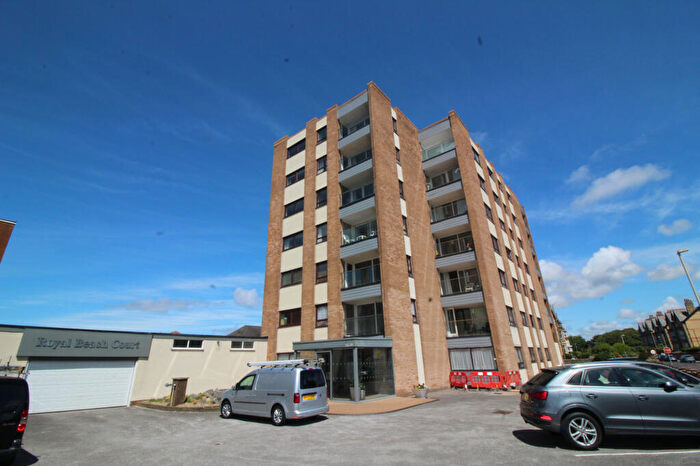
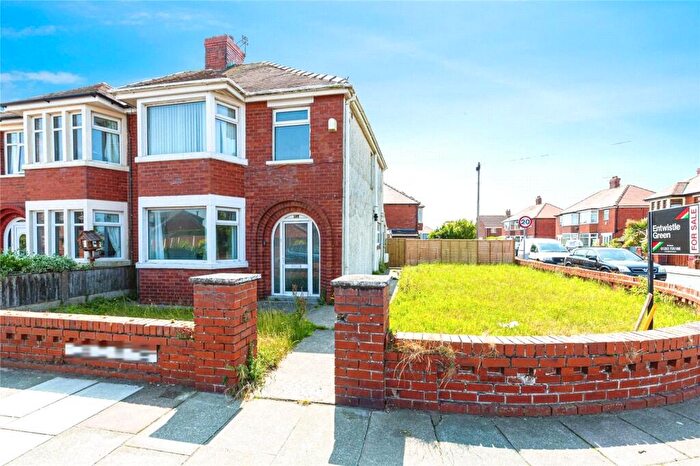
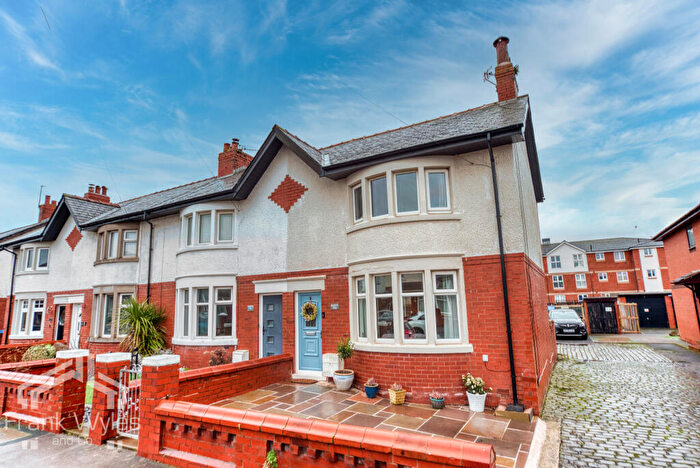
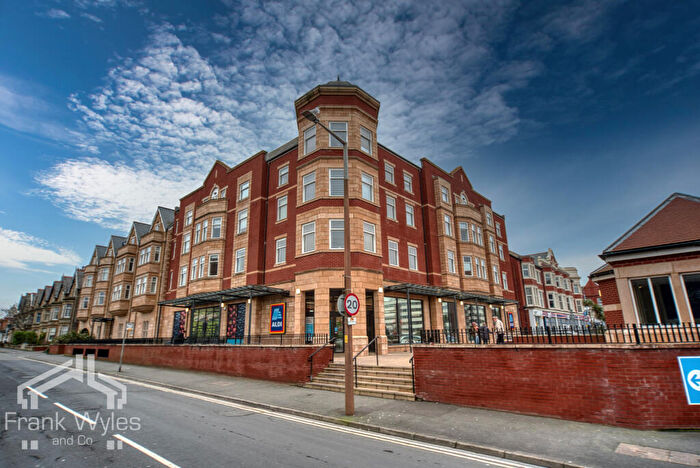
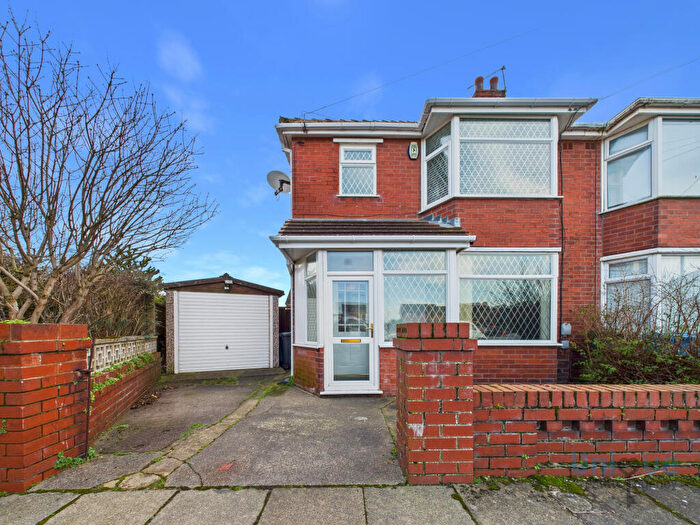
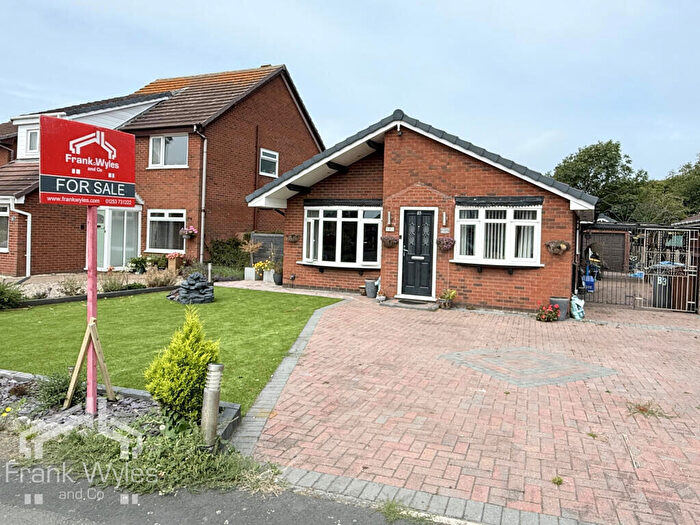
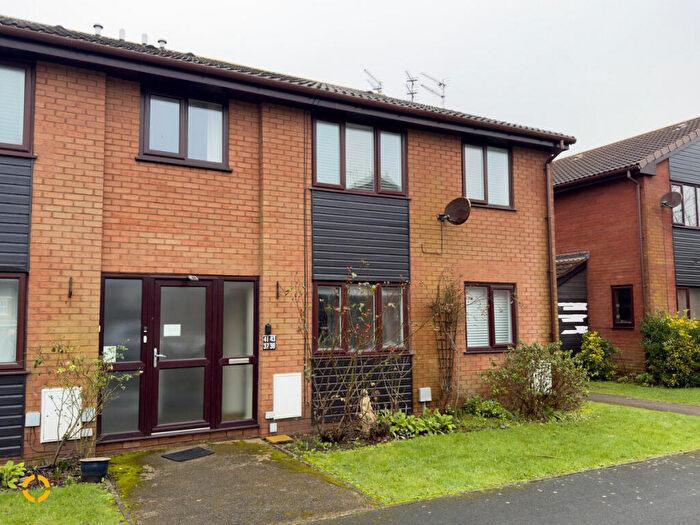
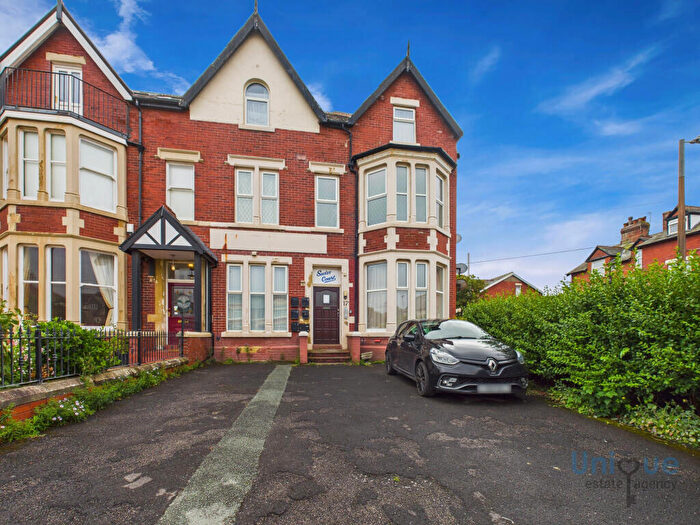
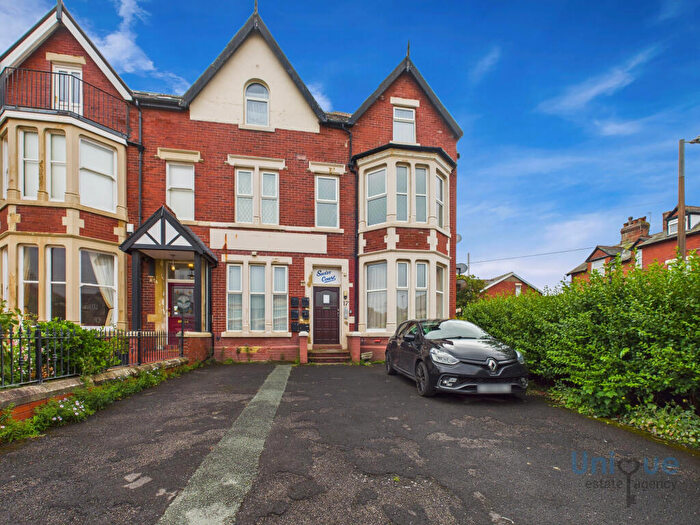
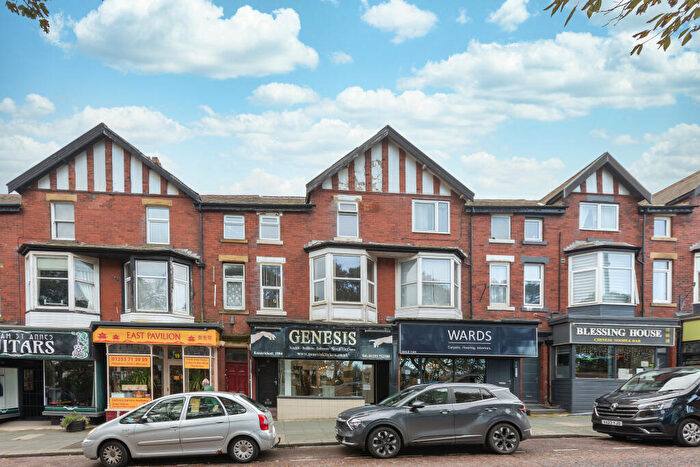
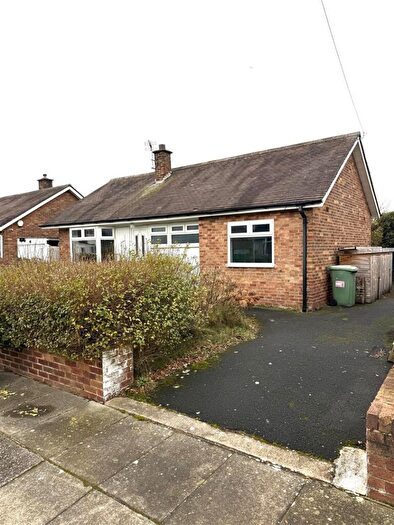
Houses for sale & to rent in Ashton, Lytham St Annes
House Prices in Ashton
Properties in Ashton have an average house price of £215,830.00 and had 330 Property Transactions within the last 3 years¹.
Ashton is an area in Lytham St Annes, Lancashire with 2,280 households², where the most expensive property was sold for £1,500,000.00.
Properties for sale in Ashton
Roads and Postcodes in Ashton
Navigate through our locations to find the location of your next house in Ashton, Lytham St Annes for sale or to rent.
| Streets | Postcodes |
|---|---|
| Allenby Road | FY8 2DL FY8 2DG |
| Avondale Road | FY8 2QJ |
| Back Glen Eldon Road | FY8 2AS |
| Back St Georges Square | FY8 2TT |
| Beach Road | FY8 2NR |
| Bentinck Road | FY8 2PU |
| Caryl Road | FY8 2PZ FY8 2QA FY8 2QB |
| Cavendish Road | FY8 2PX FY8 2PY |
| Chatsworth Road | FY8 2JL FY8 2JN |
| Claremont Place | FY8 2EG |
| Clifton Drive North | FY8 2NN FY8 2PA FY8 2PB FY8 2PH FY8 2PN FY8 2PQ FY8 2PS FY8 2NP FY8 2NW FY8 2PP FY8 2PW FY8 2NA |
| Devonshire Road | FY8 2NU FY8 2NX FY8 2JJ |
| Dorset Road | FY8 2EB FY8 2ED |
| Douglas Street | FY8 2PD |
| Durham Avenue | FY8 2BD FY8 2EP |
| Fleet Street | FY8 2DQ FY8 2SY |
| Garden Street | FY8 2AA |
| Glen Eldon Road | FY8 2AX FY8 2AU |
| Grange Road | FY8 2BN |
| Gretdale Avenue | FY8 2EE FY8 2EF |
| Headroomgate Road | FY8 3BD FY8 3BE |
| Highbury Road West | FY8 2RE |
| Knowles Road | FY8 2BG |
| Lime Grove | FY8 2QE FY8 2QF FY8 2QG FY8 2QQ |
| Litton Lane | FY8 2FG |
| Lord Street | FY8 2DF FY8 2TX |
| Mayfield Road | FY8 2DP FY8 2DR FY8 2DS FY8 2DW FY8 2DN |
| North Promenade | FY8 2LT FY8 2LZ FY8 2ND FY8 2NH FY8 2NJ FY8 2NQ FY8 2QP FY8 2QW |
| Norwood Road | FY8 2QN |
| Oxford Road | FY8 2DY FY8 2DZ FY8 2EA FY8 2DX |
| Ribble Street | FY8 2PE |
| Rowsley Road | FY8 2NS FY8 2NT |
| Rudyard Place | FY8 2EQ |
| Ryeheys Road | FY8 2HA |
| Sandgate | FY8 2NL |
| Sandhurst Avenue | FY8 2DA FY8 2DB FY8 2EH FY8 2ET |
| Shepherd Road North | FY8 3UY |
| St Andrews Road North | FY8 2AL FY8 2JA FY8 2JE FY8 2JQ FY8 2JT FY8 2JB FY8 2JF FY8 2JG FY8 2DH FY8 2FE FY8 2TU |
| St Annes Road East | FY8 1UL FY8 1BU FY8 1TA |
| St Annes Road West | FY8 2NE FY8 1RG FY8 1SA FY8 1SB |
| St Davids Road North | FY8 2AT FY8 2BL FY8 2BS FY8 2BT FY8 2DD FY8 2DE FY8 2DJ FY8 2BB |
| St Georges Avenue | FY8 2JH |
| St Georges Lane | FY8 2AD |
| St Georges Road | FY8 2AQ FY8 2AE FY8 2AG FY8 2AW FY8 2EU |
| St Georges Square | FY8 2NY |
| St Hildas Road | FY8 2PT |
| St Leonards Road East | FY8 2HD FY8 2HL FY8 2HQ |
| St Leonards Road West | FY8 2JW FY8 2PF |
| St Patricks Road North | FY8 2BA FY8 2BJ FY8 2BP FY8 2BX FY8 2DT FY8 2HB FY8 2DU |
| Stamford Court | FY8 2QD |
| Stephen Street | FY8 2BU |
| Summerfields | FY8 2TR |
| Todmorden Road | FY8 2QL |
| Westby Road | FY8 2EJ |
| Wyredale Road | FY8 2QH |
Transport near Ashton
-
St.Annes-On-The-Sea Station
-
Squires Gate Station
-
Ansdell and Fairhaven Station
-
Blackpool Pleasure Beach Station
- FAQ
- Price Paid By Year
- Property Type Price
Frequently asked questions about Ashton
What is the average price for a property for sale in Ashton?
The average price for a property for sale in Ashton is £215,830. This amount is 20% lower than the average price in Lytham St Annes. There are 1,744 property listings for sale in Ashton.
What streets have the most expensive properties for sale in Ashton?
The streets with the most expensive properties for sale in Ashton are Headroomgate Road at an average of £462,500, Westby Road at an average of £412,500 and Oxford Road at an average of £397,000.
What streets have the most affordable properties for sale in Ashton?
The streets with the most affordable properties for sale in Ashton are Fleet Street at an average of £88,351, St Georges Square at an average of £106,496 and St Andrews Road North at an average of £120,661.
Which train stations are available in or near Ashton?
Some of the train stations available in or near Ashton are St.Annes-On-The-Sea, Squires Gate and Ansdell and Fairhaven.
Property Price Paid in Ashton by Year
The average sold property price by year was:
| Year | Average Sold Price | Price Change |
Sold Properties
|
|---|---|---|---|
| 2025 | £223,462 | -11% |
90 Properties |
| 2024 | £247,014 | 27% |
119 Properties |
| 2023 | £179,486 | -11% |
121 Properties |
| 2022 | £199,224 | -10% |
139 Properties |
| 2021 | £218,856 | 3% |
164 Properties |
| 2020 | £212,743 | 15% |
91 Properties |
| 2019 | £180,676 | -7% |
109 Properties |
| 2018 | £194,113 | 4% |
111 Properties |
| 2017 | £186,815 | 6% |
117 Properties |
| 2016 | £175,204 | 11% |
138 Properties |
| 2015 | £156,651 | -11% |
105 Properties |
| 2014 | £173,881 | 3% |
115 Properties |
| 2013 | £168,648 | 6% |
123 Properties |
| 2012 | £158,010 | 0,3% |
74 Properties |
| 2011 | £157,564 | -14% |
72 Properties |
| 2010 | £180,183 | 3% |
90 Properties |
| 2009 | £174,649 | -8% |
79 Properties |
| 2008 | £188,680 | -3% |
73 Properties |
| 2007 | £194,273 | 2% |
150 Properties |
| 2006 | £190,056 | 7% |
163 Properties |
| 2005 | £177,028 | 9% |
102 Properties |
| 2004 | £161,811 | 15% |
165 Properties |
| 2003 | £137,340 | 12% |
151 Properties |
| 2002 | £121,311 | 22% |
165 Properties |
| 2001 | £94,127 | 14% |
138 Properties |
| 2000 | £81,391 | 3% |
138 Properties |
| 1999 | £78,671 | 10% |
128 Properties |
| 1998 | £70,761 | -8% |
103 Properties |
| 1997 | £76,610 | 15% |
137 Properties |
| 1996 | £65,174 | 1% |
106 Properties |
| 1995 | £64,369 | - |
81 Properties |
Property Price per Property Type in Ashton
Here you can find historic sold price data in order to help with your property search.
The average Property Paid Price for specific property types in the last three years are:
| Property Type | Average Sold Price | Sold Properties |
|---|---|---|
| Semi Detached House | £283,251.00 | 74 Semi Detached Houses |
| Detached House | £423,225.00 | 40 Detached Houses |
| Terraced House | £215,325.00 | 28 Terraced Houses |
| Flat | £145,241.00 | 188 Flats |

