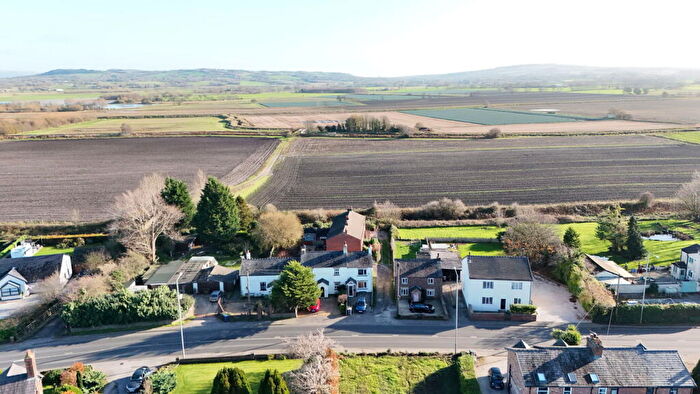
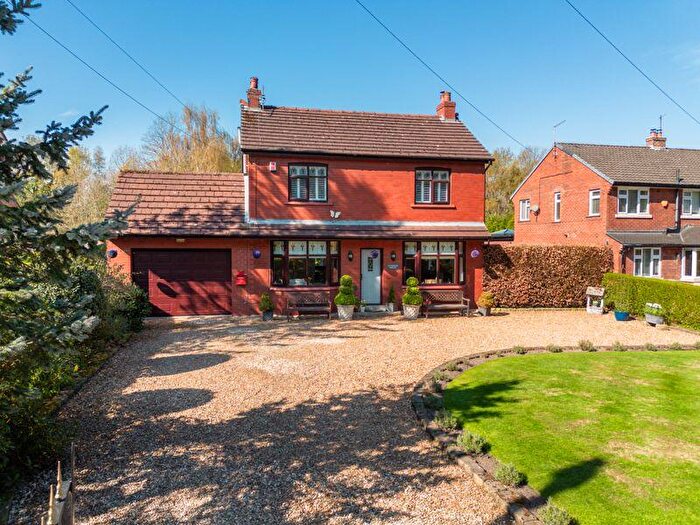
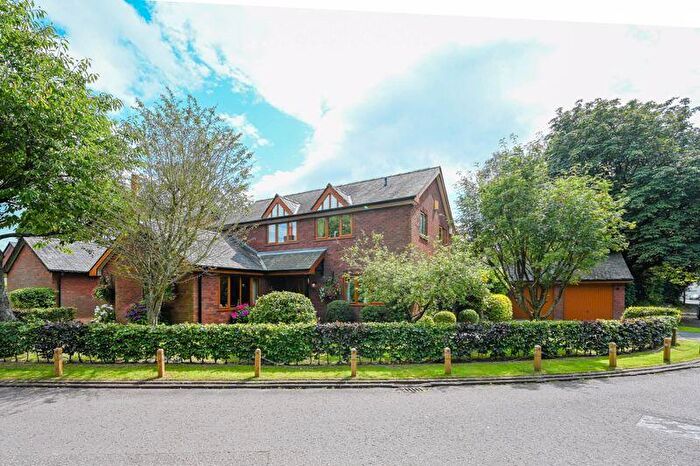
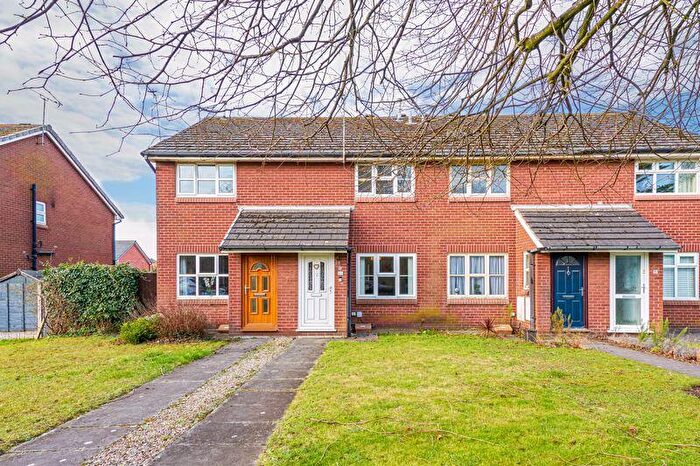
Houses for sale & to rent in Rufford, Ormskirk
House Prices in Rufford
Properties in Rufford have an average house price of £386,628.00 and had 78 Property Transactions within the last 3 years¹.
Rufford is an area in Ormskirk, Lancashire with 825 households², where the most expensive property was sold for £1,100,000.00.
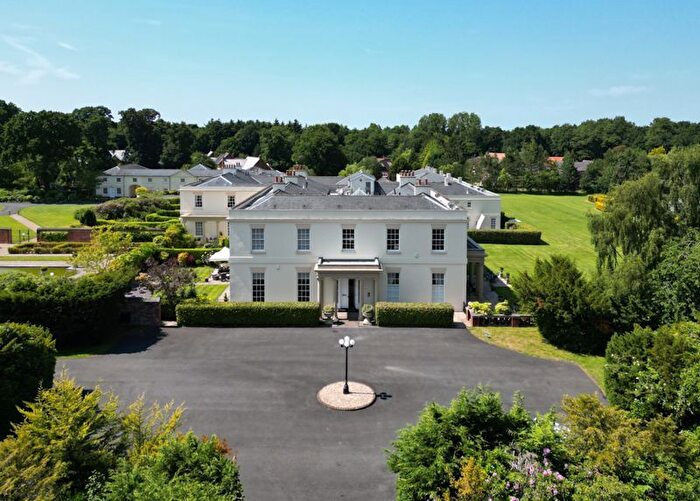
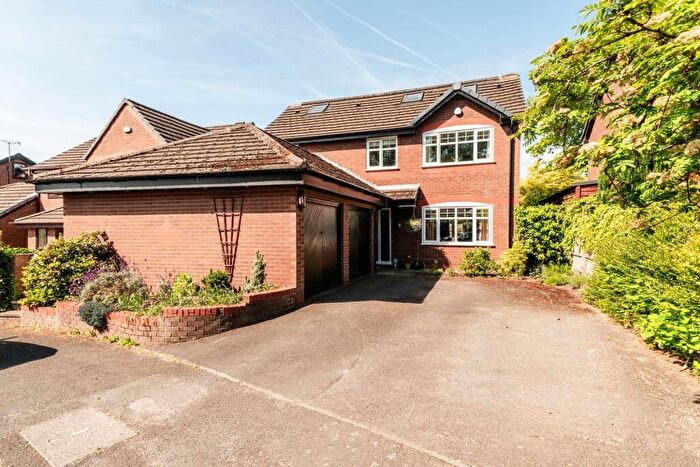
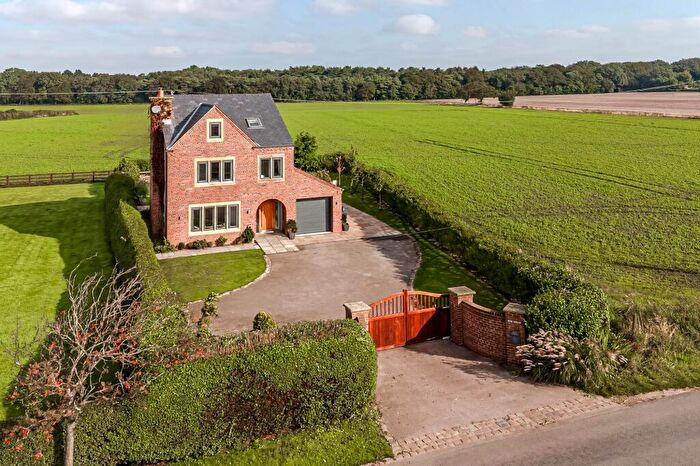
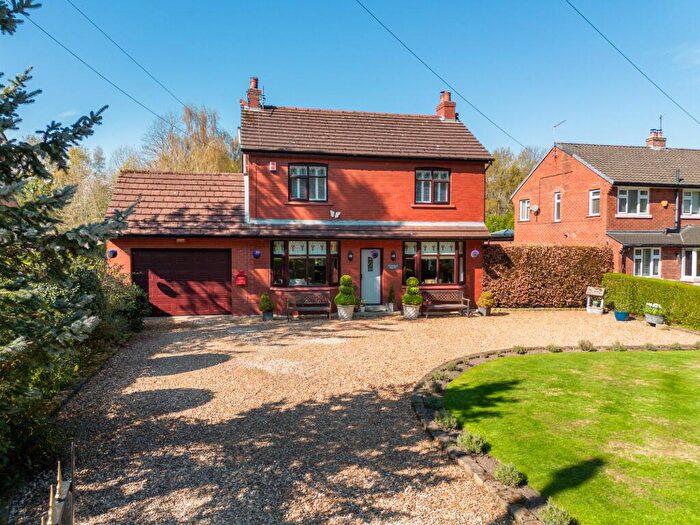
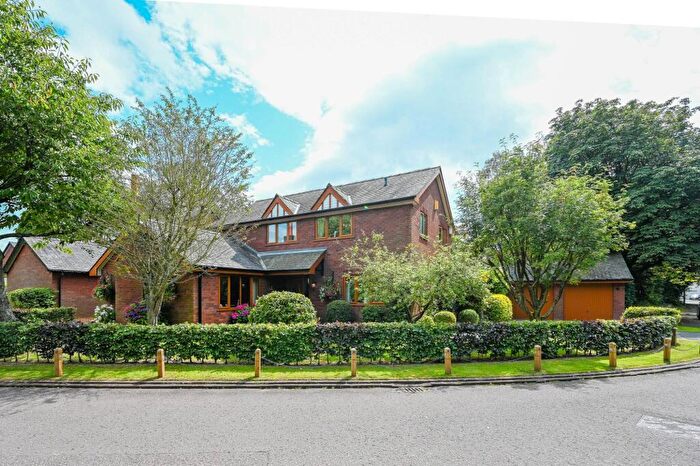
Properties for sale in Rufford
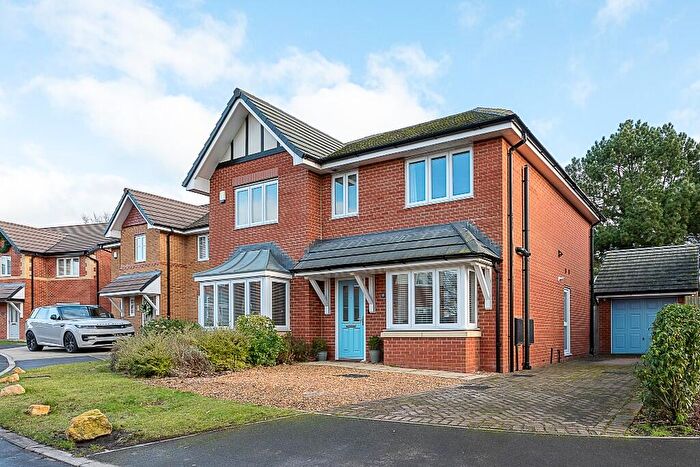
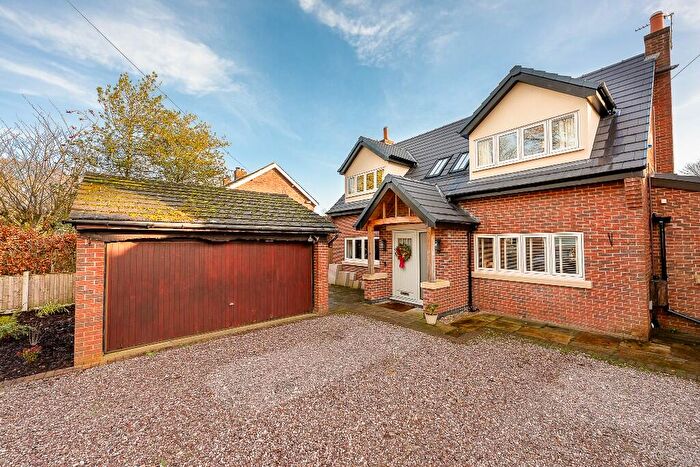
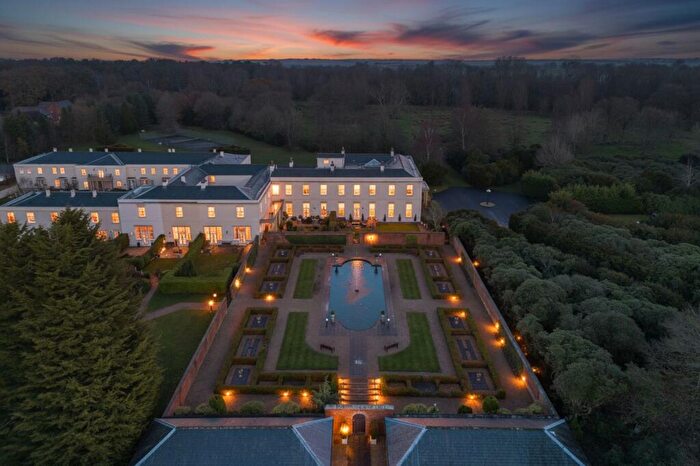
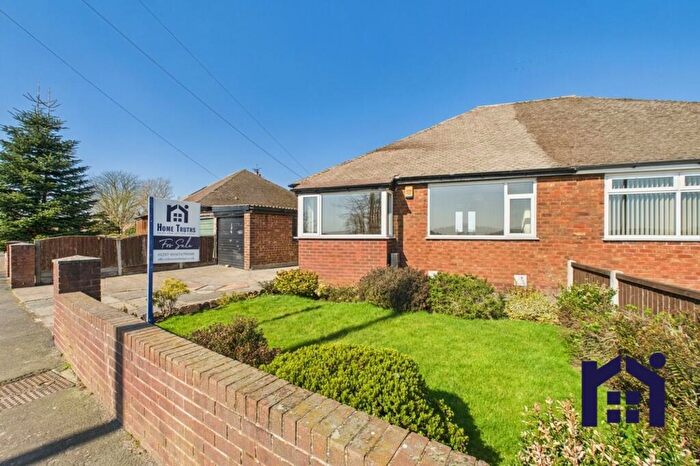
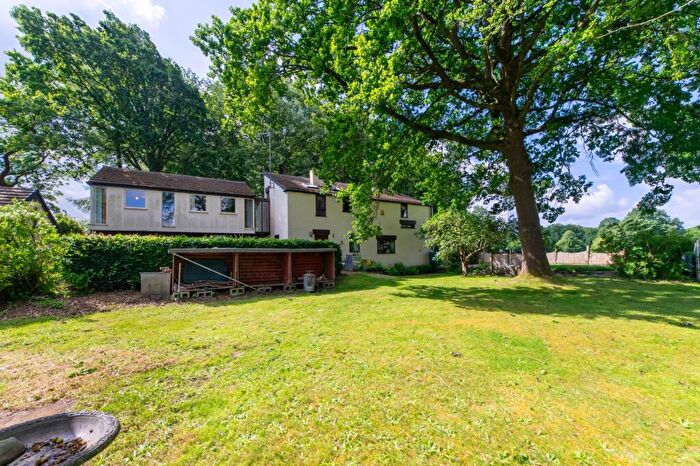
Previously listed properties in Rufford
Roads and Postcodes in Rufford
Navigate through our locations to find the location of your next house in Rufford, Ormskirk for sale or to rent.
| Streets | Postcodes |
|---|---|
| Albert Road | L40 1TU |
| Beech Close | L40 1TH |
| Brick Kiln Lane | L40 1SY L40 1SZ |
| Causeway Lane | L40 1SL |
| Chapel Lane | L40 1UD |
| Church Road | L40 1TA |
| Cousins Lane | L40 1TN L40 1TW |
| Croft Hey | L40 1UX |
| Croston Drive | L40 1ST |
| Croston Road | L40 1RB |
| Diamond Jubilee Road | L40 1TD |
| Douglas Close | L40 1UT |
| Flash Lane | L40 1SN L40 1SW |
| Hesketh Drive | L40 1TS |
| Hesketh Green | L40 1UN |
| Highsands Avenue | L40 1TE L40 1TF |
| Holly Lane | L40 1SH |
| Holmeswood Road | L40 1RZ L40 1SS L40 1TG L40 1TX L40 1TY L40 1TZ L40 1UA |
| Liverpool Road | L40 1SA L40 1SB L40 1SD L40 1SE L40 1SF L40 1SG L40 1SQ |
| Longshaw Close | L40 1XD |
| Manor House Close | L40 1BB |
| Mere Lane | L40 1TL |
| Mill Hey Lane | L40 1SJ |
| New Road | L40 1SR L40 1UY |
| Prescott Avenue | L40 1TT |
| Roseacre Gardens | L40 1AA |
| Rufford Park Lane | L40 1XE L40 1XH |
| Sandy Lane | L40 1UE L40 1UF L40 1SX |
| Sandy Way | L40 1UB |
| Sluice Lane | L40 1SP |
| Smithy Lane | L40 1UH |
| Spark Lane | L40 1SU |
| Springwood Drive | L40 1XB |
| Station Road | L40 1TB |
| The Grove | L40 1TR |
| The Hawthornes | L40 1UP |
| The Paddock | L40 1UL |
| Thornton Close | L40 1UW |
| Tootle Lane | L40 1TJ |
| Watersedge Drive | L40 1BJ |
| Wheatsheaf Mews | L40 1AB |
| Whitefield Close | L40 1US |
| Wiggins Lane | L40 1UJ |
| Willow Green | L40 1UR |
Transport near Rufford
-
Rufford Station
-
Burscough Bridge Station
-
New Lane Station
-
Burscough Junction Station
-
Hoscar Station
-
Croston Station
- FAQ
- Price Paid By Year
- Property Type Price
Frequently asked questions about Rufford
What is the average price for a property for sale in Rufford?
The average price for a property for sale in Rufford is £386,628. This amount is 23% higher than the average price in Ormskirk. There are 128 property listings for sale in Rufford.
What streets have the most expensive properties for sale in Rufford?
The streets with the most expensive properties for sale in Rufford are Longshaw Close at an average of £1,100,000, Springwood Drive at an average of £950,000 and Holly Lane at an average of £700,000.
What streets have the most affordable properties for sale in Rufford?
The streets with the most affordable properties for sale in Rufford are Hesketh Green at an average of £131,500, Cousins Lane at an average of £200,000 and Highsands Avenue at an average of £213,166.
Which train stations are available in or near Rufford?
Some of the train stations available in or near Rufford are Rufford, Burscough Bridge and New Lane.
Property Price Paid in Rufford by Year
The average sold property price by year was:
| Year | Average Sold Price | Price Change |
Sold Properties
|
|---|---|---|---|
| 2025 | £304,497 | -47% |
18 Properties |
| 2024 | £447,514 | 17% |
32 Properties |
| 2023 | £369,843 | 6% |
28 Properties |
| 2022 | £349,272 | -3% |
37 Properties |
| 2021 | £358,405 | 8% |
33 Properties |
| 2020 | £328,775 | 11% |
29 Properties |
| 2019 | £293,650 | -1% |
37 Properties |
| 2018 | £296,462 | -5% |
39 Properties |
| 2017 | £311,741 | -13% |
46 Properties |
| 2016 | £352,788 | 17% |
26 Properties |
| 2015 | £294,277 | -2% |
18 Properties |
| 2014 | £300,757 | 11% |
33 Properties |
| 2013 | £269,134 | 5% |
26 Properties |
| 2012 | £255,881 | -64% |
30 Properties |
| 2011 | £420,125 | 42% |
20 Properties |
| 2010 | £244,889 | 10% |
24 Properties |
| 2009 | £220,335 | -96% |
17 Properties |
| 2008 | £431,583 | 24% |
6 Properties |
| 2007 | £328,395 | 7% |
35 Properties |
| 2006 | £306,820 | 19% |
31 Properties |
| 2005 | £248,693 | 7% |
23 Properties |
| 2004 | £230,111 | -15% |
38 Properties |
| 2003 | £265,355 | 41% |
35 Properties |
| 2002 | £156,507 | -19% |
59 Properties |
| 2001 | £185,765 | 16% |
48 Properties |
| 2000 | £155,845 | 4% |
57 Properties |
| 1999 | £149,942 | 31% |
48 Properties |
| 1998 | £103,952 | 9% |
23 Properties |
| 1997 | £95,010 | 18% |
32 Properties |
| 1996 | £77,794 | -10% |
26 Properties |
| 1995 | £85,835 | - |
24 Properties |
Property Price per Property Type in Rufford
Here you can find historic sold price data in order to help with your property search.
The average Property Paid Price for specific property types in the last three years are:
| Property Type | Average Sold Price | Sold Properties |
|---|---|---|
| Semi Detached House | £273,826.00 | 23 Semi Detached Houses |
| Detached House | £537,957.00 | 35 Detached Houses |
| Terraced House | £240,666.00 | 12 Terraced Houses |
| Flat | £267,812.00 | 8 Flats |

