
Houses for sale in Ormskirk, Lancashire
House Prices in Ormskirk
Properties in Ormskirk have an average house price of £315k and had 2,131 Property Transactions within the last 3 years.¹
Ormskirk is an area in Lancashire with 18,747 households², where the most expensive property was sold for £2.95M.
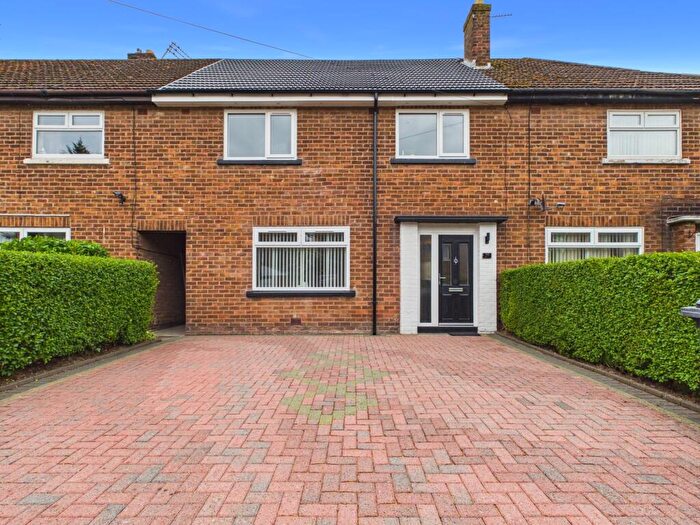
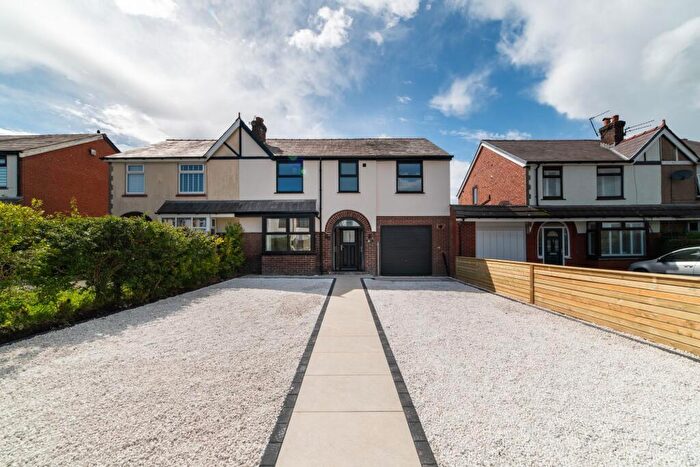
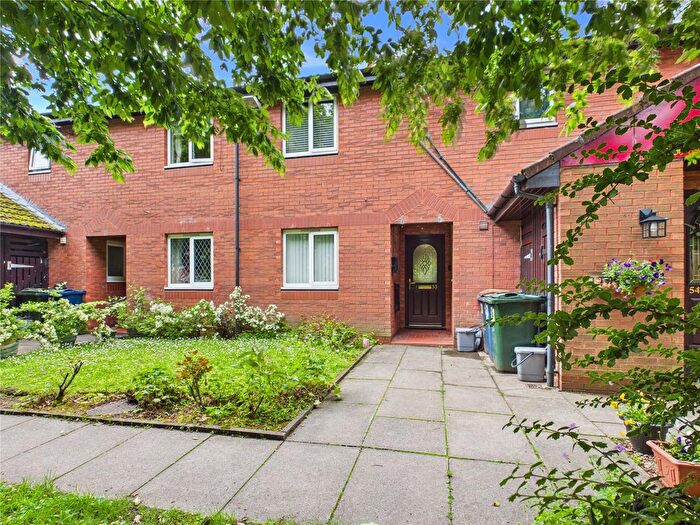
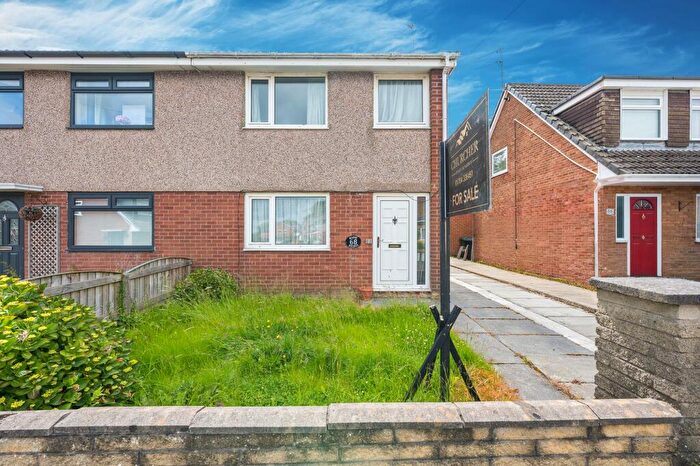
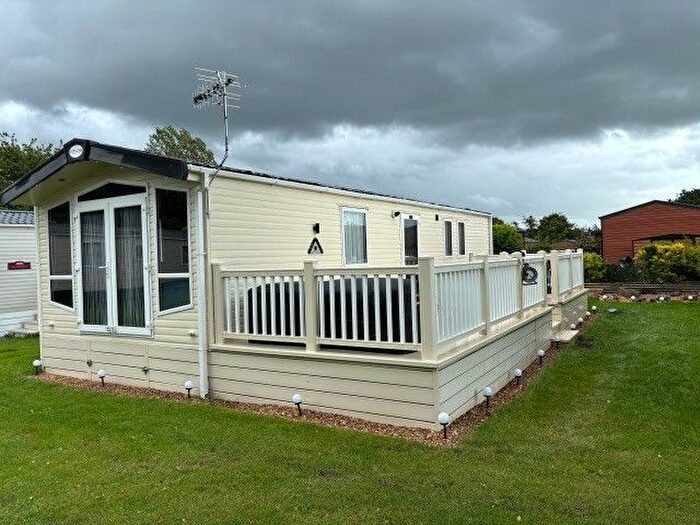
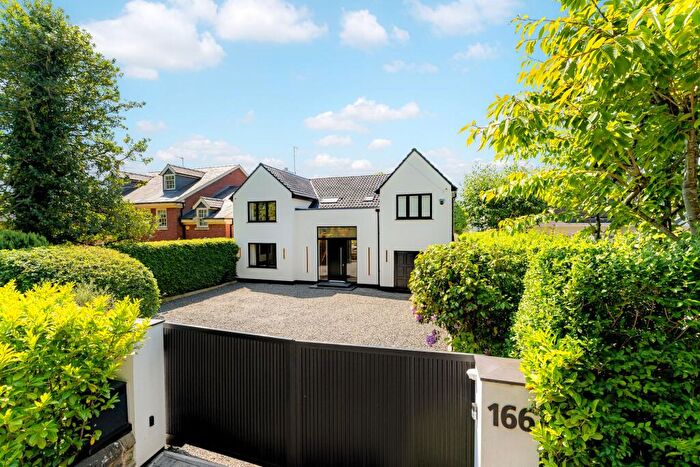
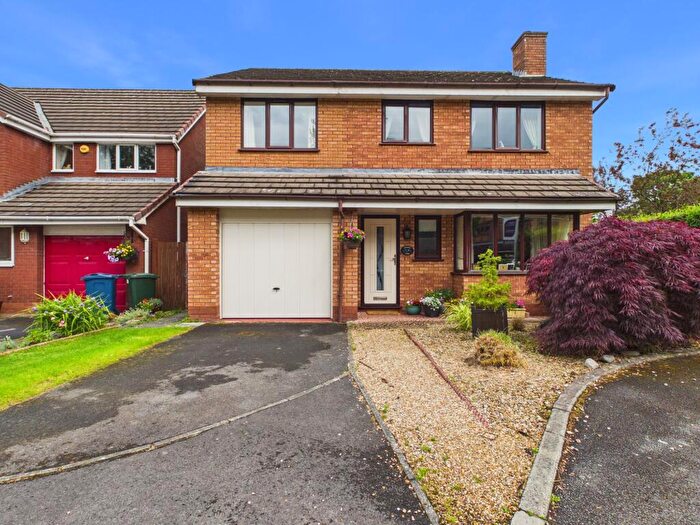
Properties for sale in Ormskirk
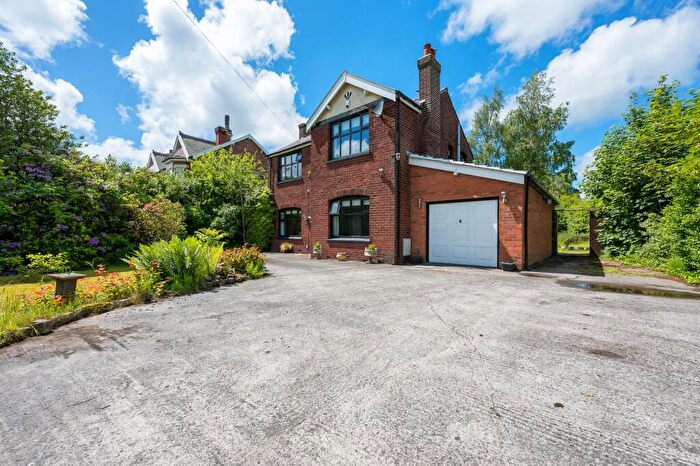
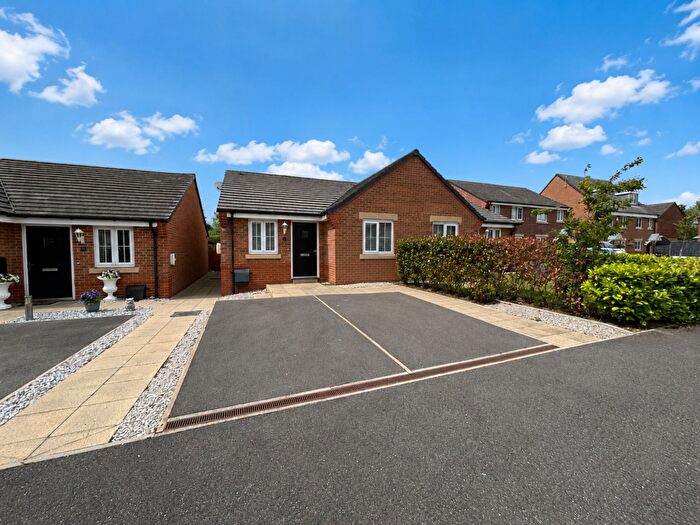
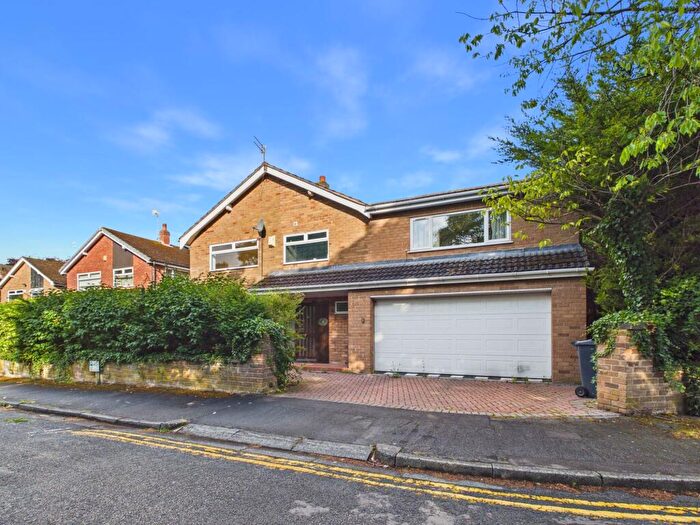
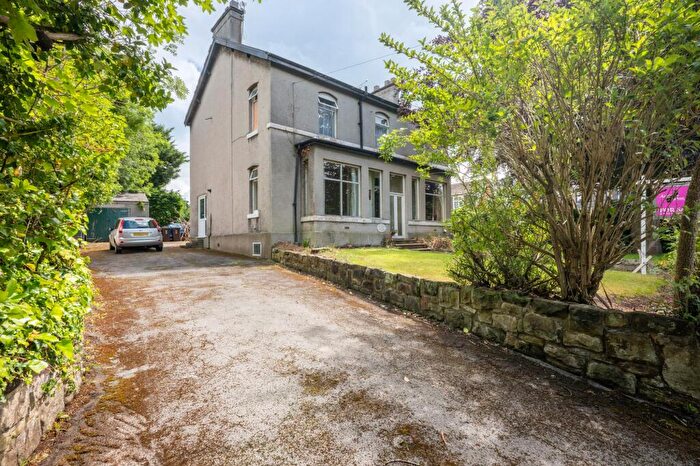
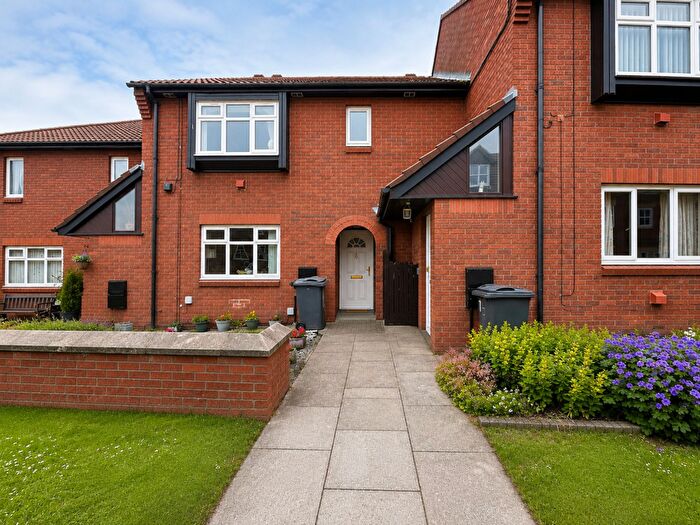
![]()
If you are looking to sell your house, let it out, or receive a property valuation, an expert can help you.
Click the button below to get started.


Neighbourhoods in Ormskirk
Navigate through our locations to find the location of your next house in Ormskirk, Lancashire for sale or to rent.
- Ashurst
- Aughton And Downholland
- Aughton Park
- Bickerstaffe
- Burscough East
- Burscough West
- Derby
- Eccleston And Mawdesley
- Halsall
- Knowsley
- Newburgh
- Parbold
- Rufford
- Scarisbrick
- Scott
- Croston, Mawdesley & Euxton South
- Ormskirk West
- Ormskirk East
- Aughton & Holborn
- Rural West
- Burscough Bridge & Rufford
- Rural South
- Burscough Town
Property price trends in Ormskirk
According to the latest Land Registry data, the average home in Ormskirk sold for £349,546 in 2026. That figure comes from a substantial record of 22,449 sales logged over the past 31 years.
Prices have continued to climb over the last three years. Compared with 2023, when the typical sale came in around £312,879, that's a rise of roughly 11.7%.
Looking back five years, average prices are up about 19.5% since 2021, a gain of around £57,075 in cash terms.
Zoom out to the past decade for the fuller picture. Back in 2016, homes here averaged £240,309, so the typical sold price has climbed about 45.5% since then, roughly 3.8% a year. Stretch the view to fifteen years and that annual pace eases back to about 3%.
Frequently asked questions about Ormskirk
What is the average price for a property for sale in Ormskirk?
The average price for a property for sale in Ormskirk is £315,010. This amount is 50% higher than the average price in Lancashire. There are more than 10,000 property listings for sale in Ormskirk.
What locations have the most expensive properties for sale in Ormskirk?
The locations with the most expensive properties for sale in Ormskirk are Croston, Mawdesley & Euxton South at an average of £539,158, Eccleston And Mawdesley at an average of £478,819 and Parbold at an average of £439,922.
What locations have the most affordable properties for sale in Ormskirk?
The locations with the most affordable properties for sale in Ormskirk are Scott at an average of £237,418, Burscough East at an average of £243,515 and Knowsley at an average of £258,964.
Which train stations are available in or near Ormskirk?
Some of the train stations available in or near Ormskirk are Ormskirk, Burscough Junction and Aughton Park.
Property Price Paid in Ormskirk by Year
The average sold property price by year was:
| Year | Average Sold Price | Price Change |
Sold Properties
|
|---|---|---|---|
| 2026 | £349,546 | 12% |
43 Properties |
| 2025 | £308,848 | -4% |
681 Properties |
| 2024 | £320,533 | 2% |
746 Properties |
| 2023 | £312,879 | 5% |
661 Properties |
| 2022 | £297,765 | 2% |
802 Properties |
| 2021 | £292,471 | 6% |
951 Properties |
| 2020 | £274,210 | 8% |
687 Properties |
| 2019 | £252,075 | -4% |
801 Properties |
| 2018 | £262,210 | 6% |
769 Properties |
| 2017 | £247,424 | 3% |
776 Properties |
Property Price per Property Type in Ormskirk
Here you can find historic sold price data in order to help with your property search.
The average Property Paid Price for specific property types in the last three years are:
| Property Type | Average Sold Price | Sold Properties |
|---|---|---|
| Semi Detached House | £264,057.00 | 921 Semi Detached Houses |
| Terraced House | £214,672.00 | 356 Terraced Houses |
| Detached House | £488,614.00 | 650 Detached Houses |
| Flat | £166,999.00 | 204 Flats |
Transport in Ormskirk
Please see below transportation links in this area:
