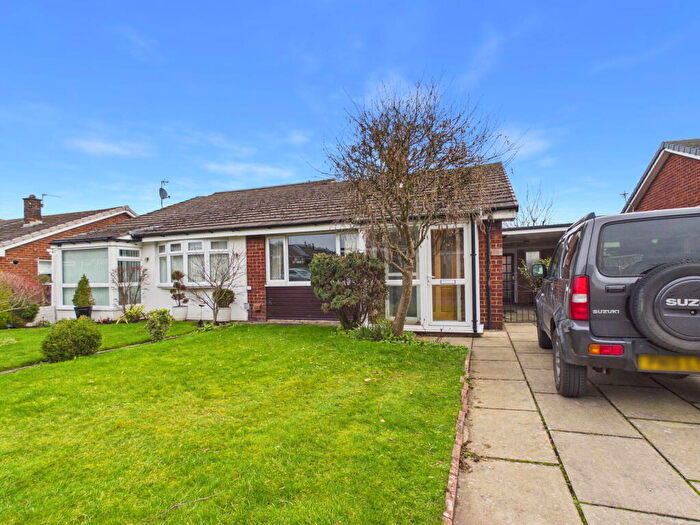
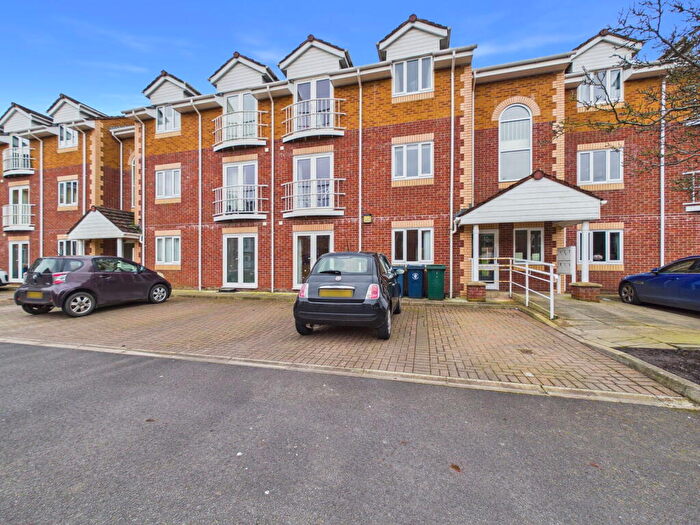
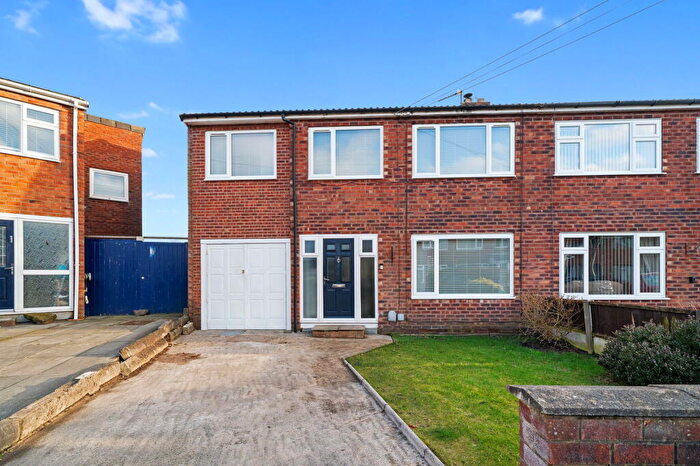
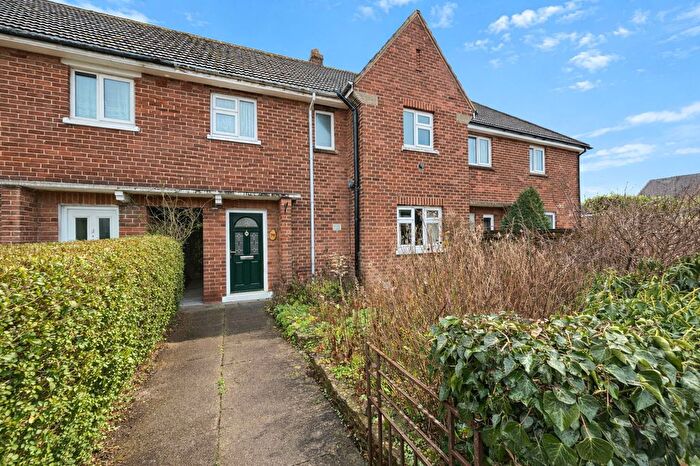
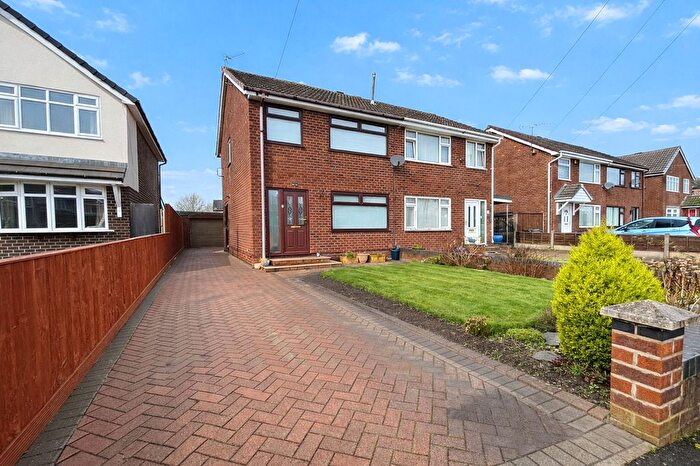
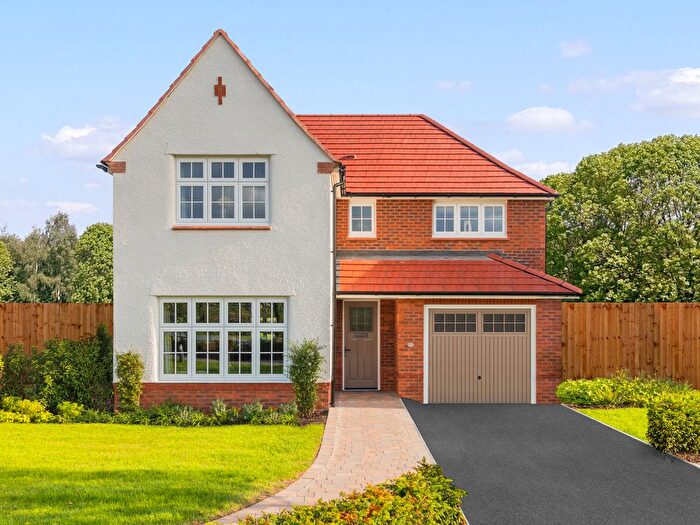
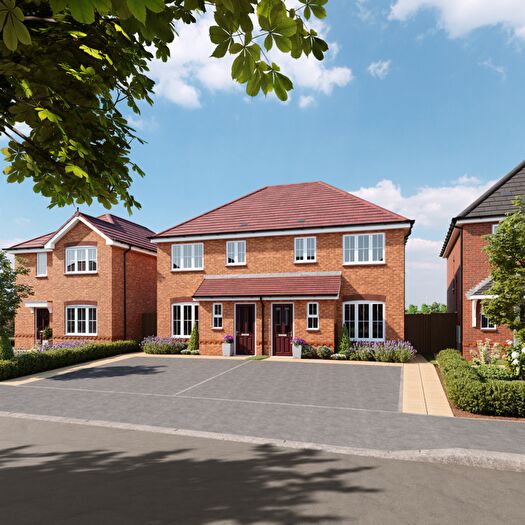
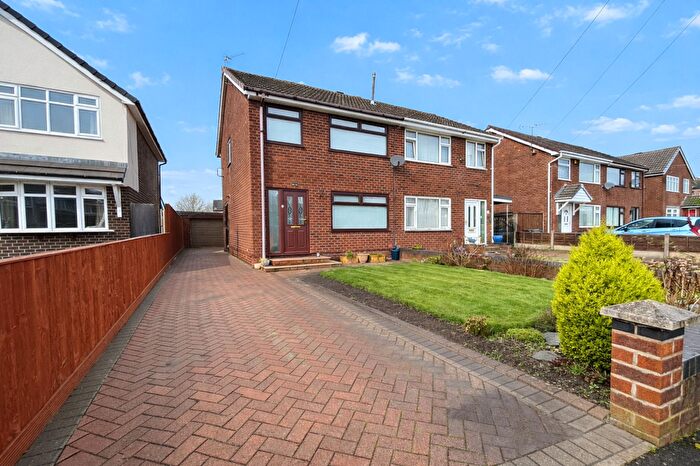
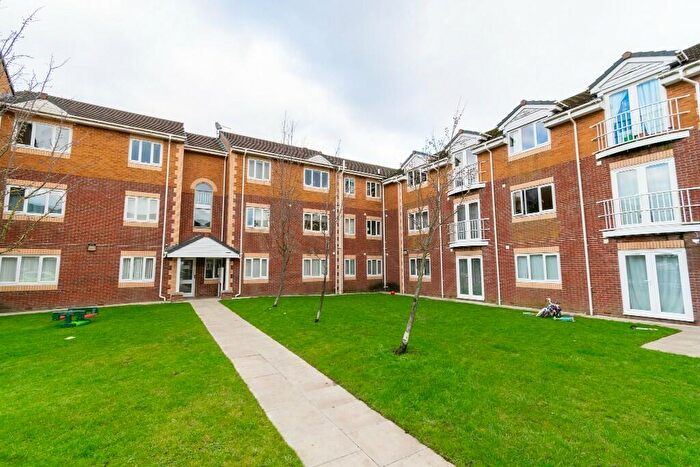
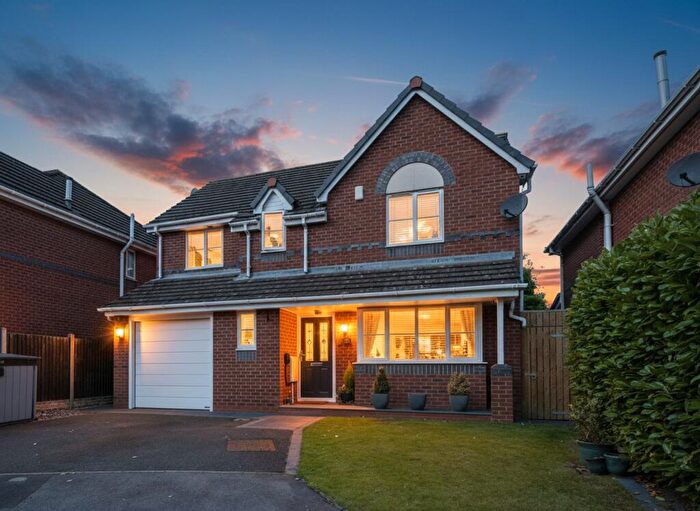
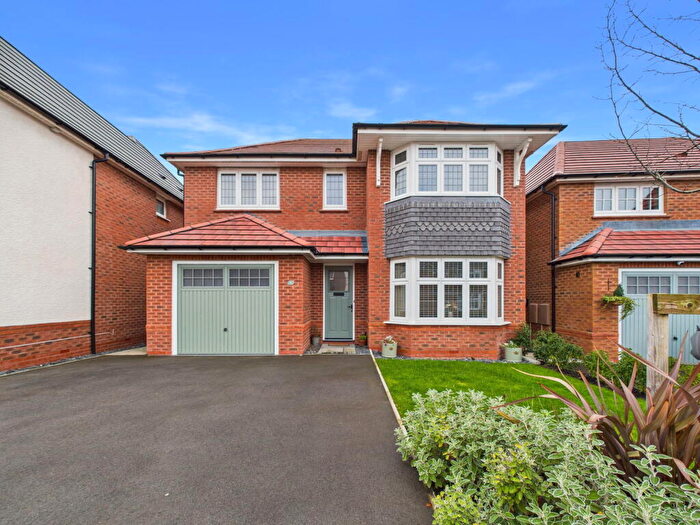
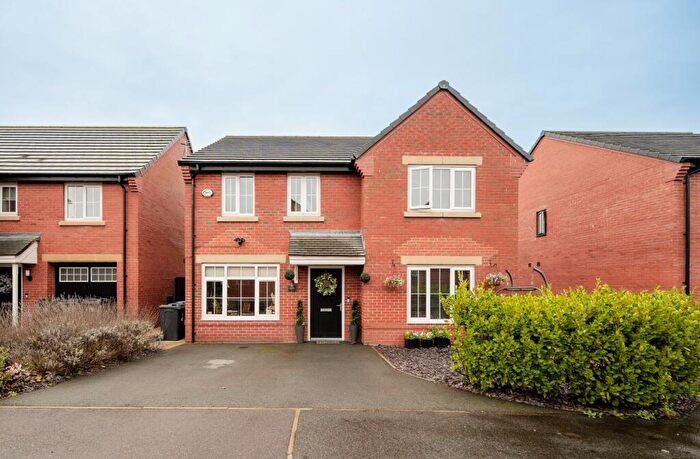
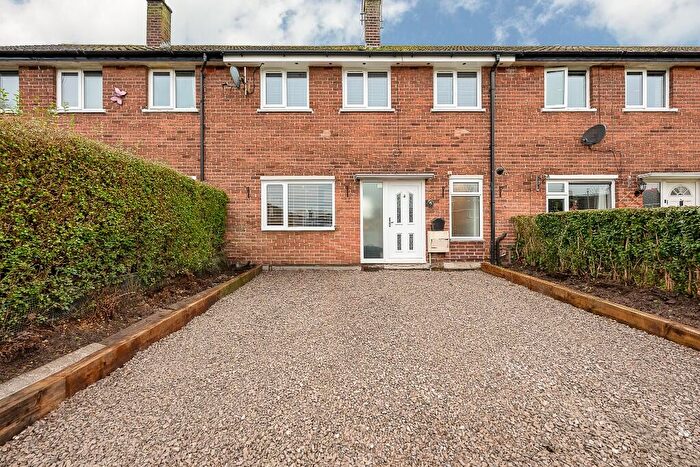
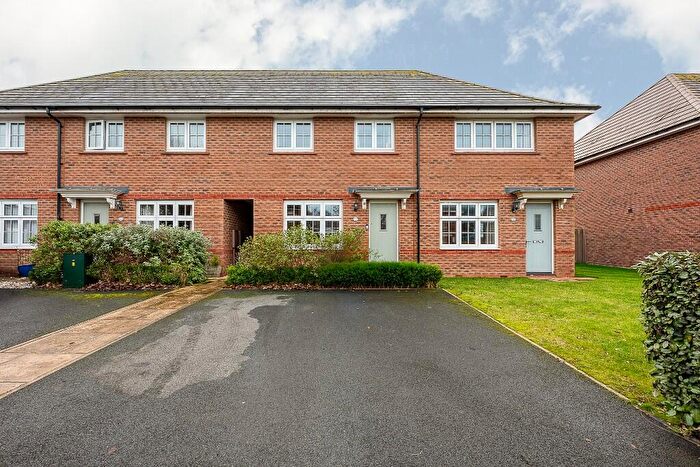
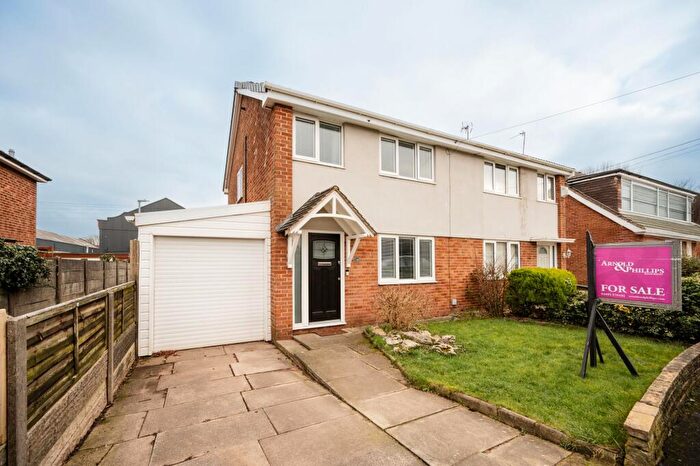
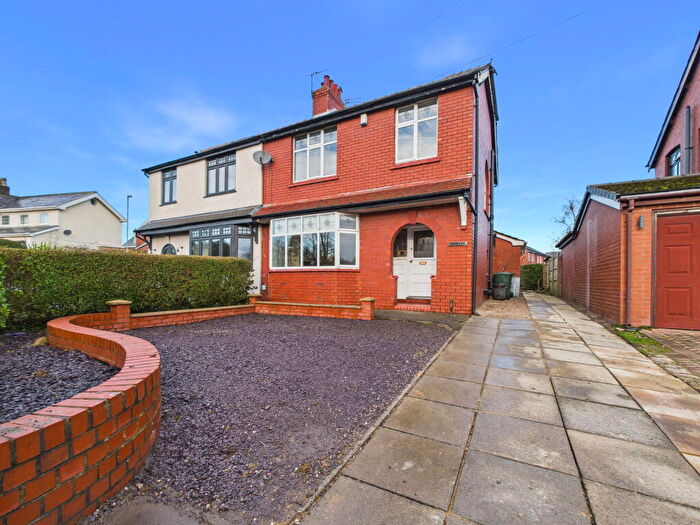
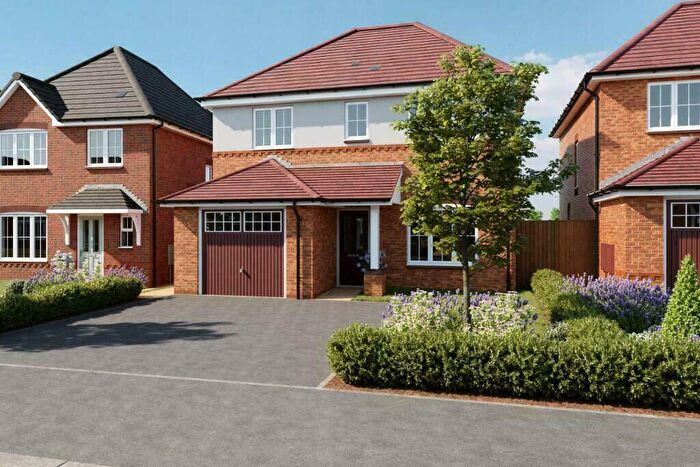
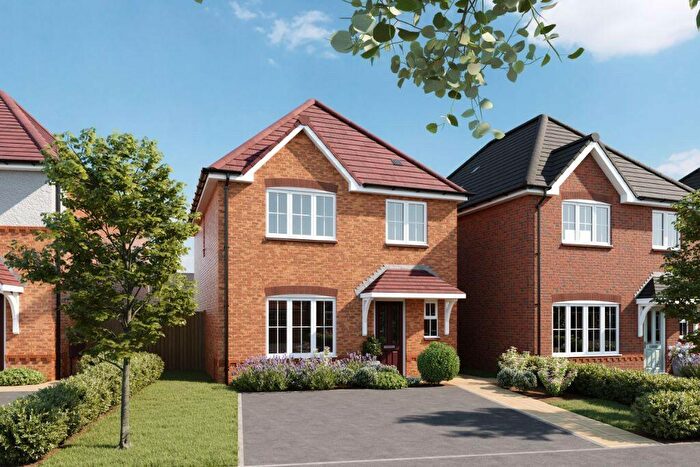
Houses for sale & to rent in Burscough East, Ormskirk
House Prices in Burscough East
Properties in Burscough East have an average house price of £243,806.00 and had 234 Property Transactions within the last 3 years¹.
Burscough East is an area in Ormskirk, Lancashire with 1,743 households², where the most expensive property was sold for £785,000.00.
Properties for sale in Burscough East
Roads and Postcodes in Burscough East
Navigate through our locations to find the location of your next house in Burscough East, Ormskirk for sale or to rent.
| Streets | Postcodes |
|---|---|
| Abbeydale | L40 5SU |
| Ainscough Drive | L40 5SQ |
| Alexander Close | L40 5SR |
| Birch Avenue | L40 5SA |
| Boundary Lane | L40 5XT |
| Bramble Way | L40 5BP |
| Bretherton Court | L40 5UZ |
| Briars Lane | L40 5TG |
| Brooklands Grove | L40 5UT |
| Broom Close | L40 5BN |
| Carvel Way | L40 5BF |
| Chapel Lane | L40 7RA |
| Charnwood Close | L40 7SZ |
| Clarkfield Close | L40 5XU |
| Clough Avenue | L40 5BG |
| Coach House Court | L40 7XB |
| Colburne Close | L40 4LB L40 4LD |
| Croft Avenue | L40 5TB |
| Delph Drive | L40 5BD L40 5BE |
| Delph Mews | L40 5BT |
| Elder Avenue | L40 5BS |
| Ellerbrook Drive | L40 5SY L40 5SZ |
| Elm Road | L40 7RJ L40 7RL |
| Field Close | L40 5XY |
| Flax Lane | L40 5TD |
| Flaxfields | L40 5YF |
| Fletchers Drive | L40 5UY |
| Flour Mill Close | L40 5TL |
| Foxglove Avenue | L40 5BJ |
| Glenroyd Drive | L40 5SJ |
| Glovers Way | L40 5AA |
| Gower Gardens | L40 5SP |
| Hawthorn Avenue | L40 5BL |
| Hazelwood Avenue | L40 5SD |
| Ivy Close | L40 5BR |
| Junction Lane | L40 5SN L40 5SW L40 5XH |
| Langdale Drive | L40 5SE L40 5SF |
| Lathom Close | L40 5XW |
| Liverpool Road North | L40 4BY L40 5TP L40 5RZ |
| Lord Street | L40 4BZ L40 4LA |
| Maple Avenue | L40 5SL |
| Meadow Lane | L40 4BB |
| Mill Lane | L40 5SG L40 5TJ L40 5UX |
| Millbank Brow | L40 5TA |
| Millstone Court | L40 5ST |
| Moss Lane | L40 4AU L40 4AX L40 4AY L40 4AZ L40 4BA |
| Newlands Avenue | L40 5SH |
| Oak Drive | L40 5BQ |
| Oak Mews | L40 5BU |
| Orchid Way | L40 5BX |
| Primrose Close | L40 5BW |
| Rees Park | L40 5SX |
| Richmond Avenue | L40 7RB L40 7RD L40 7UA |
| School Lane | L40 4AE L40 4AF |
| Smithy Walk | L40 5UU |
| Square Lane | L40 7RG L40 7RQ |
| Staveley Avenue | L40 5SB |
| The Green Lane | L40 5XS |
| The Poplars | L40 7XG |
| The Woodlands | L40 5RS |
| Trent Close | L40 4LG |
| Warpers Moss Close | L40 4LQ |
| Warpers Moss Lane | L40 4AG L40 4AH L40 4AJ L40 4AQ |
| Weaver Avenue | L40 4LE L40 4LF |
| Wheat Lane | L40 4BF |
| Willow End | L40 5XX |
| Windsor Close | L40 7RH |
Transport near Burscough East
-
Burscough Junction Station
-
Burscough Bridge Station
-
Hoscar Station
-
New Lane Station
-
Rufford Station
-
Ormskirk Station
-
Parbold Station
- FAQ
- Price Paid By Year
- Property Type Price
Frequently asked questions about Burscough East
What is the average price for a property for sale in Burscough East?
The average price for a property for sale in Burscough East is £243,806. This amount is 23% lower than the average price in Ormskirk. There are 1,106 property listings for sale in Burscough East.
What streets have the most expensive properties for sale in Burscough East?
The streets with the most expensive properties for sale in Burscough East are Bretherton Court at an average of £785,000, Oak Drive at an average of £575,000 and Bramble Way at an average of £400,000.
What streets have the most affordable properties for sale in Burscough East?
The streets with the most affordable properties for sale in Burscough East are Lord Street at an average of £144,285, Alexander Close at an average of £150,000 and Warpers Moss Close at an average of £170,000.
Which train stations are available in or near Burscough East?
Some of the train stations available in or near Burscough East are Burscough Junction, Burscough Bridge and Hoscar.
Property Price Paid in Burscough East by Year
The average sold property price by year was:
| Year | Average Sold Price | Price Change |
Sold Properties
|
|---|---|---|---|
| 2025 | £257,489 | 12% |
74 Properties |
| 2024 | £226,629 | -9% |
79 Properties |
| 2023 | £248,059 | 8% |
81 Properties |
| 2022 | £228,092 | -0,3% |
90 Properties |
| 2021 | £228,763 | 5% |
112 Properties |
| 2020 | £216,704 | -4% |
56 Properties |
| 2019 | £226,183 | 10% |
91 Properties |
| 2018 | £204,015 | 11% |
68 Properties |
| 2017 | £181,181 | -8% |
70 Properties |
| 2016 | £196,008 | 9% |
119 Properties |
| 2015 | £179,314 | -8% |
89 Properties |
| 2014 | £193,198 | 12% |
106 Properties |
| 2013 | £170,080 | 2% |
55 Properties |
| 2012 | £166,183 | -5% |
31 Properties |
| 2011 | £174,988 | -2% |
42 Properties |
| 2010 | £179,209 | 1% |
37 Properties |
| 2009 | £176,980 | -0,4% |
33 Properties |
| 2008 | £177,626 | -0,3% |
53 Properties |
| 2007 | £178,203 | -1% |
109 Properties |
| 2006 | £179,665 | 4% |
90 Properties |
| 2005 | £173,146 | 6% |
121 Properties |
| 2004 | £163,407 | 3% |
190 Properties |
| 2003 | £157,895 | 26% |
153 Properties |
| 2002 | £116,563 | 22% |
93 Properties |
| 2001 | £91,079 | 15% |
86 Properties |
| 2000 | £77,644 | 10% |
62 Properties |
| 1999 | £69,947 | 9% |
80 Properties |
| 1998 | £63,763 | -4% |
45 Properties |
| 1997 | £66,137 | 20% |
53 Properties |
| 1996 | £52,679 | -14% |
60 Properties |
| 1995 | £59,851 | - |
33 Properties |
Property Price per Property Type in Burscough East
Here you can find historic sold price data in order to help with your property search.
The average Property Paid Price for specific property types in the last three years are:
| Property Type | Average Sold Price | Sold Properties |
|---|---|---|
| Semi Detached House | £235,039.00 | 109 Semi Detached Houses |
| Detached House | £376,726.00 | 43 Detached Houses |
| Terraced House | £214,023.00 | 42 Terraced Houses |
| Flat | £156,081.00 | 40 Flats |

