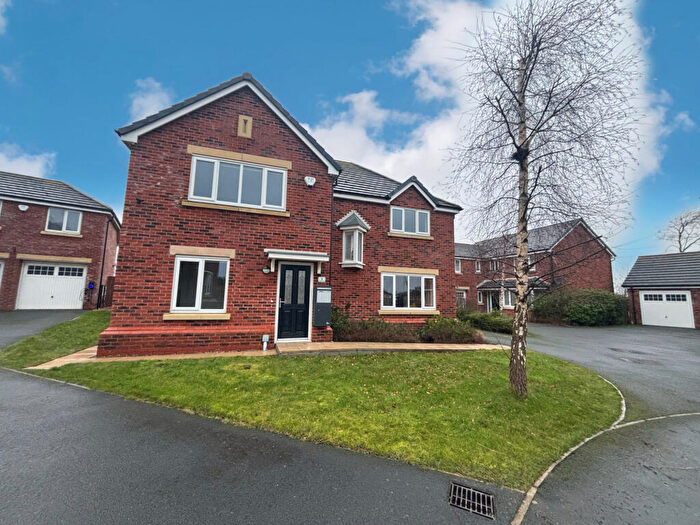
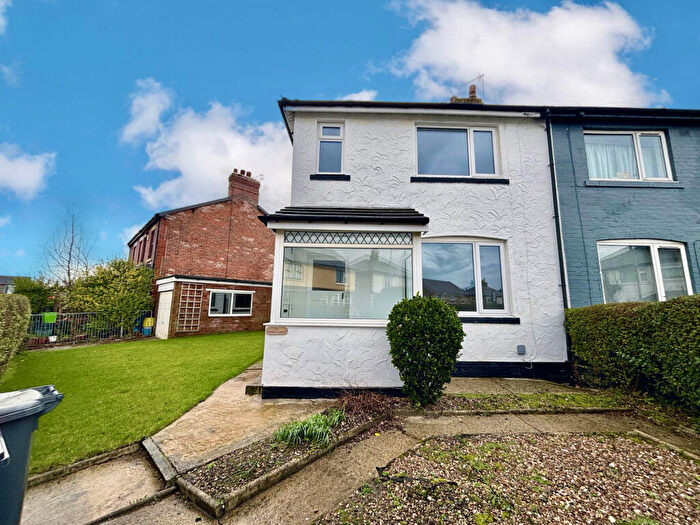
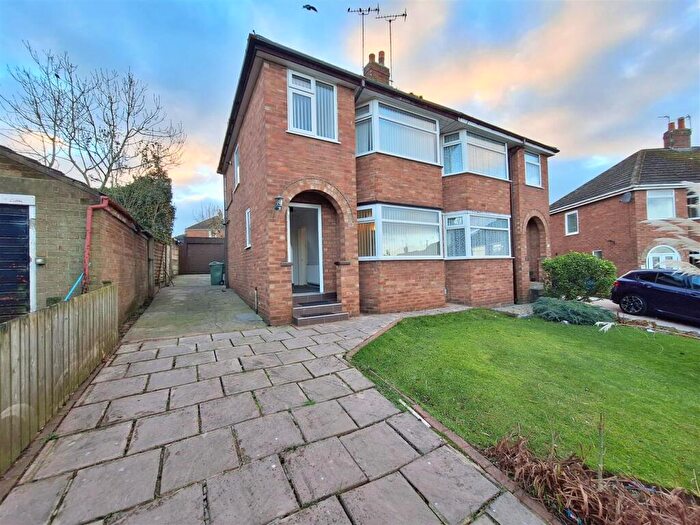
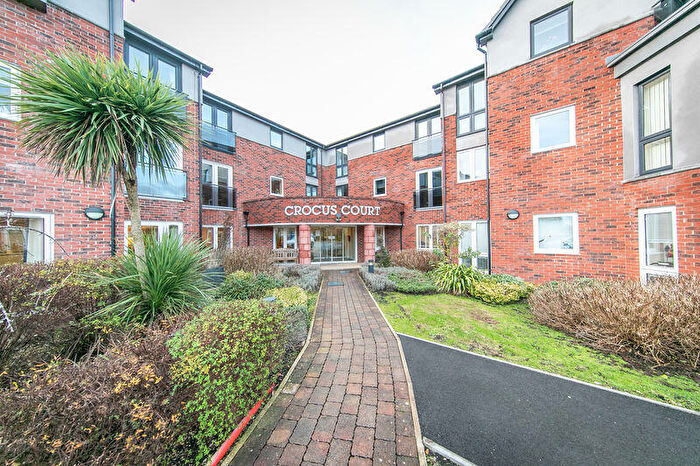
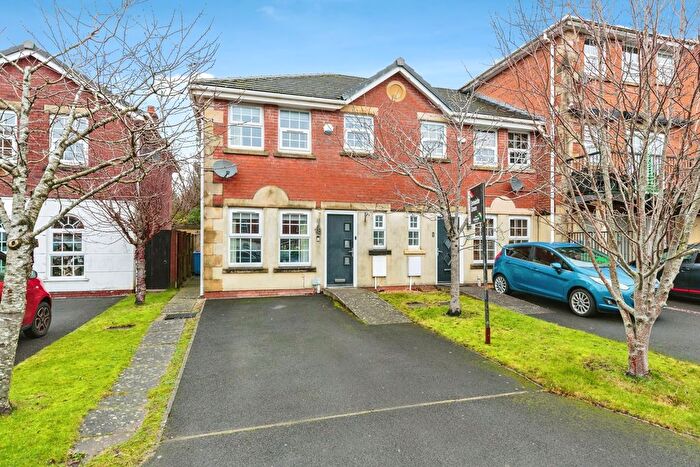
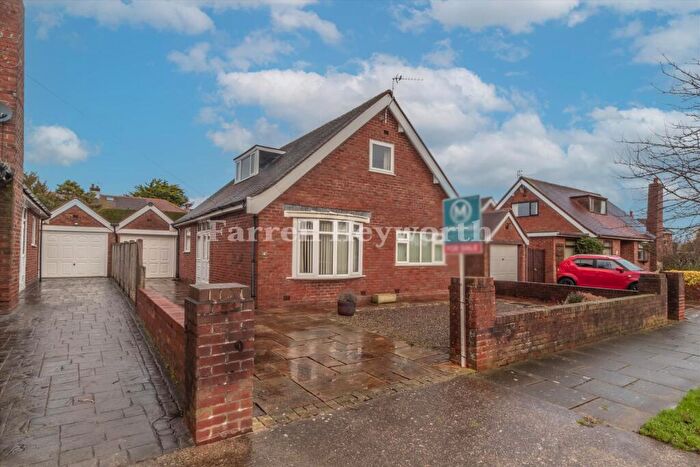
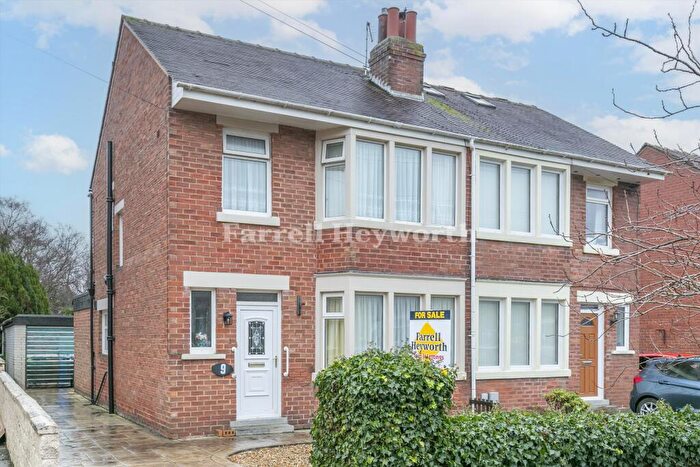
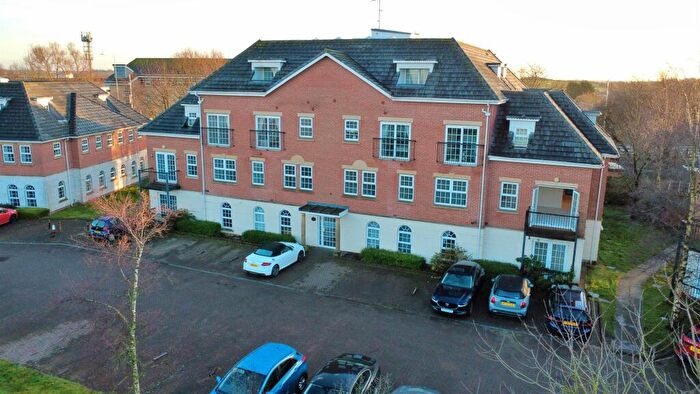
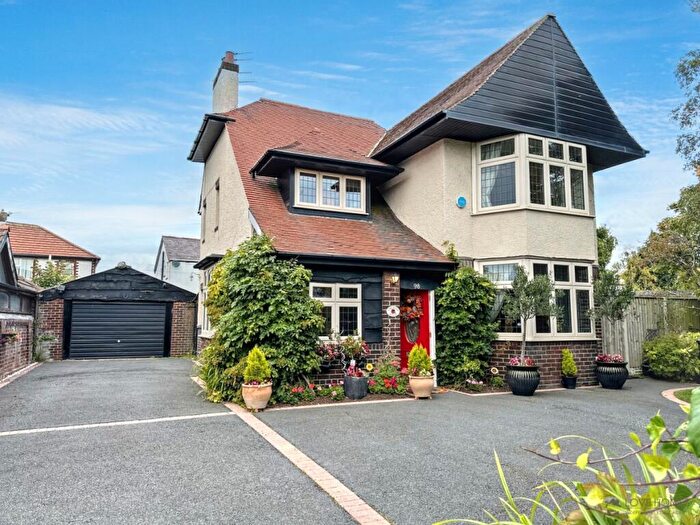
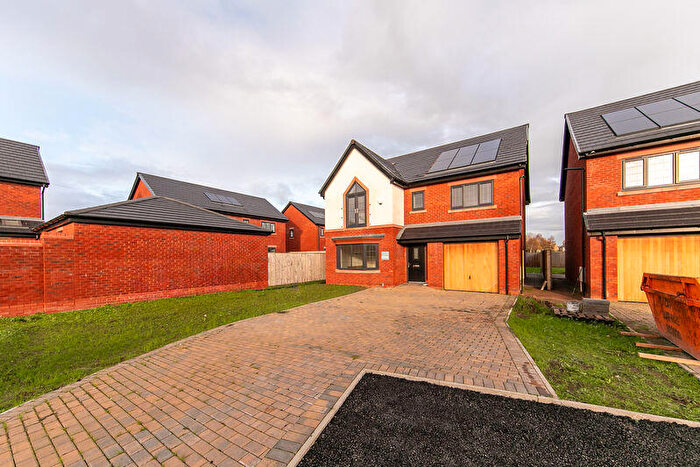
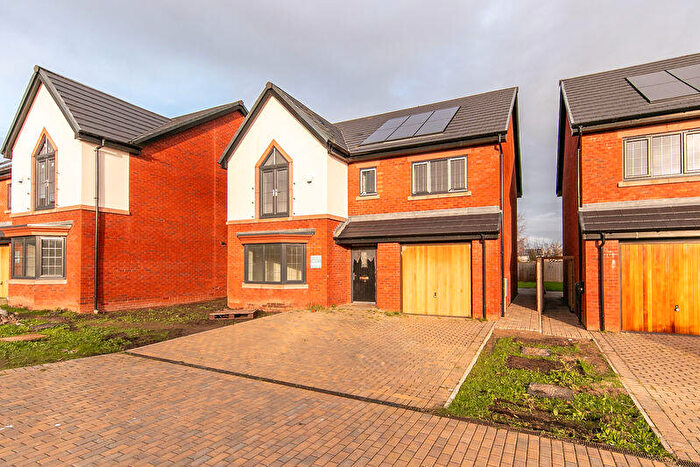
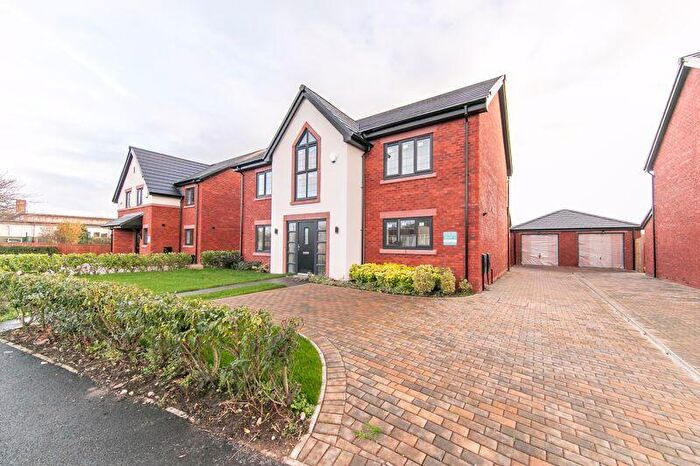
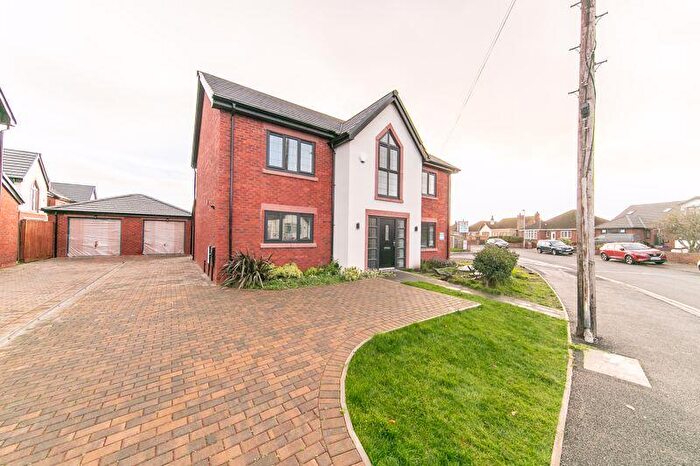
Houses for sale & to rent in Hardhorn, Poulton-le-fylde
House Prices in Hardhorn
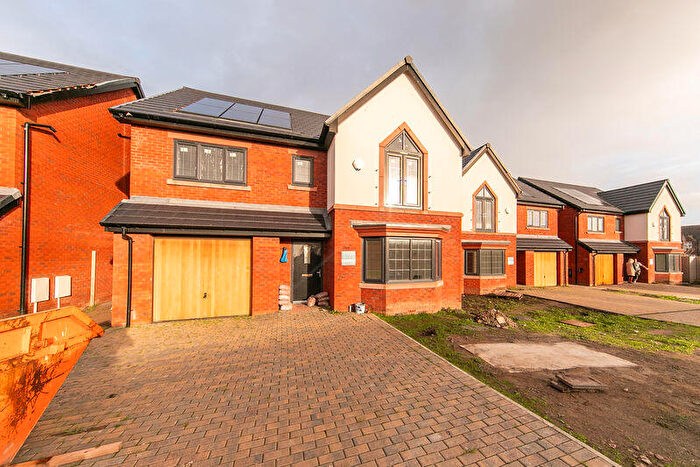
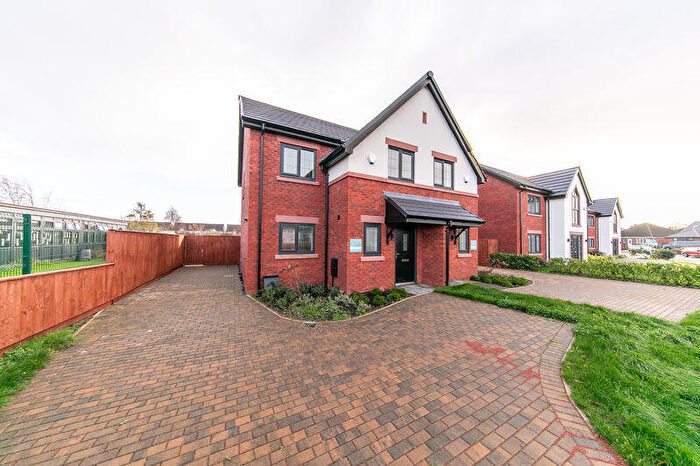
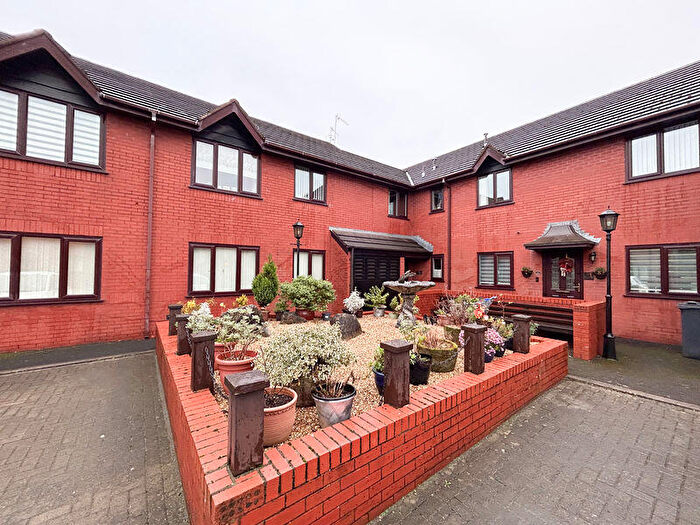
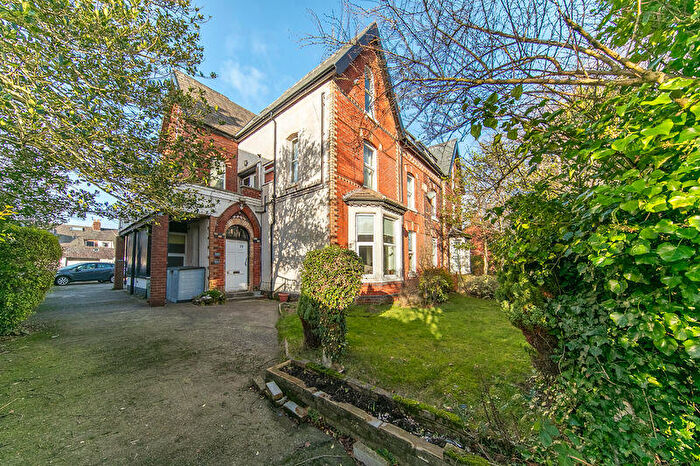
Properties in Hardhorn have an average house price of £291,496.00 and had 173 Property Transactions within the last 3 years¹.
Hardhorn is an area in Poulton-le-fylde, Lancashire with 1,544 households², where the most expensive property was sold for £1,250,000.00.
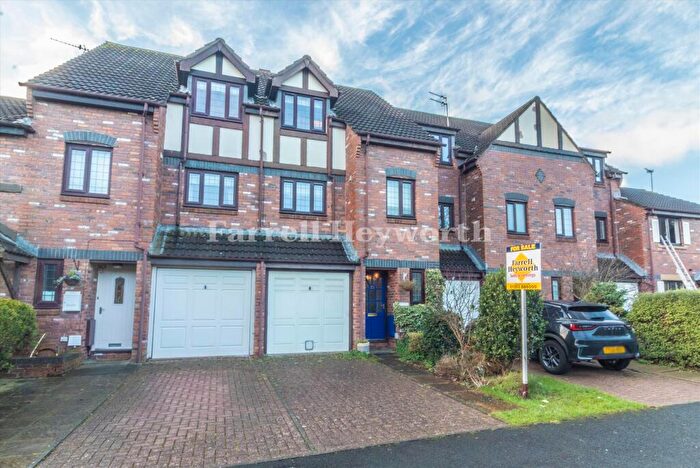
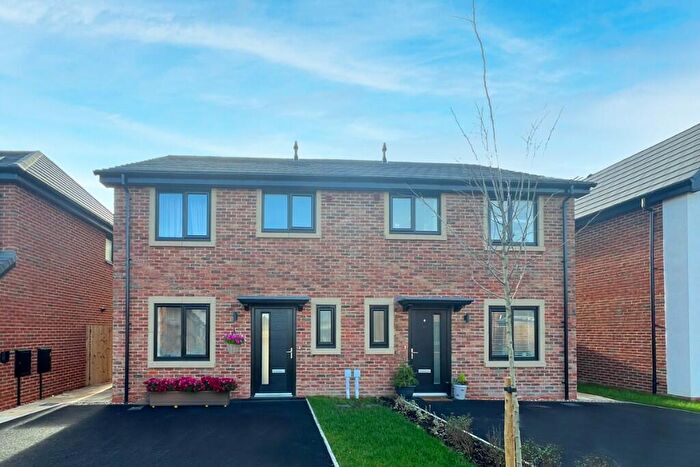
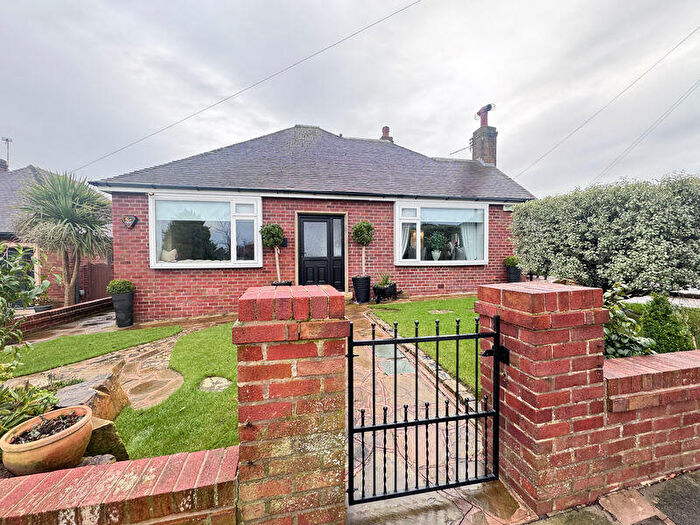
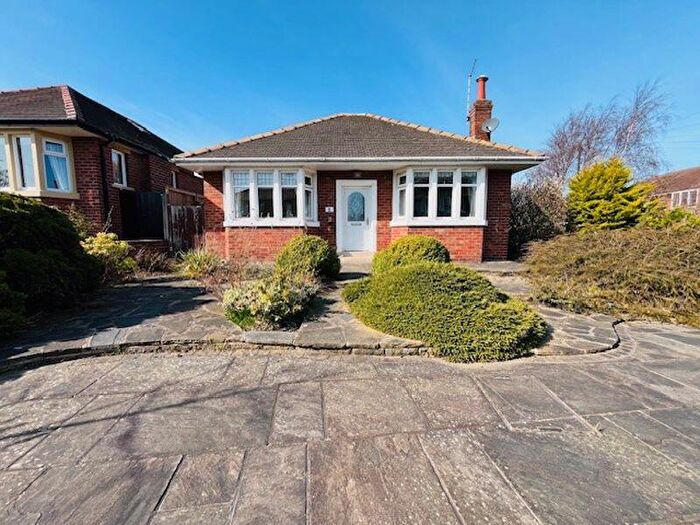
Properties for sale in Hardhorn
Roads and Postcodes in Hardhorn
Navigate through our locations to find the location of your next house in Hardhorn, Poulton-le-fylde for sale or to rent.
| Streets | Postcodes |
|---|---|
| Albany Close | FY6 8DT |
| Alder Grove | FY6 8EH FY6 8EJ |
| Argyle Road | FY6 7EW |
| Ash Drive | FY6 8DZ |
| Bainesfield | FY6 8HE |
| Beech Drive | FY6 8EF |
| Broadfield Avenue | FY6 8HT |
| Brockholes Crescent | FY6 8HU FY6 8HX |
| Brocklewood Avenue | FY6 8BZ |
| Carr Close | FY6 8HY |
| Carr Head Lane | FY6 8EG FY6 8JA FY6 8JB |
| Cedar Avenue | FY6 8DQ |
| Coppins Green | FY6 8EP |
| Curzon Road | FY6 7EL |
| Eaton Way | FY6 8DS |
| Edenfield Avenue | FY6 8HS |
| Eildon Drive | FY6 8EX |
| Fairfield Road | FY6 8DN FY6 8LD |
| First Avenue | FY6 7JW |
| Foxglove Dell | FY6 8FG |
| Garstang Road East | FY6 7EH FY6 7EP FY6 8HJ FY6 8HL |
| Grange Gardens | FY6 8AS |
| Green Drive | FY6 8DP |
| Hardhorn Road | FY6 8AY FY6 8DH FY6 8DW FY6 8ES |
| Hardhorn Village | FY6 8DL |
| High Cross Avenue | FY6 8BY |
| Highcross Road | FY6 8BB FY6 8DB |
| Higher Green | FY6 7AW |
| Holts Lane | FY6 8BU FY6 8HN FY6 8HP FY6 8HW |
| Levens Close | FY6 8NJ |
| Levens Drive | FY6 8EY FY6 8EZ |
| Lime Grove | FY6 8EL |
| Linderbreck Lane | FY6 8FJ |
| Little Coppins Lane | FY6 8FL |
| Longhouse Lane | FY6 8DE FY6 8DF |
| Low Cross Road | FY6 8EA |
| Lower Green | FY6 7EJ FY6 7JL |
| Lowick Drive | FY6 8HB |
| Main Drive | FY6 8HZ |
| Maple Drive | FY6 8EQ |
| Mill Hey Avenue | FY6 8DR |
| Moreton Drive | FY6 8ED |
| Newby Avenue | FY6 8HA |
| Oldfield Carr Lane | FY6 8EN FY6 8EW |
| Oldfield Close | FY6 8ER |
| Oldfield Crescent | FY6 8HR |
| Orchard Avenue | FY6 8EU |
| Pine Crescent | FY6 8EB |
| Poplar Avenue | FY6 8JD |
| Puddle House Lane | FY6 8LB |
| Regents Terrace | FY6 7JN |
| Snowdrop Dell | FY6 8FH |
| The Croft | FY6 8EE |
| The Hamptons | FY6 8NH |
| Towbreck Gardens | FY6 8FF |
| Waterleat Glade | FY6 8FE |
| Westwood Avenue | FY6 7EN |
| Willow Drive | FY6 8DG |
| Woodland Drive | FY6 8ET |
Transport near Hardhorn
- FAQ
- Price Paid By Year
- Property Type Price
Frequently asked questions about Hardhorn
What is the average price for a property for sale in Hardhorn?
The average price for a property for sale in Hardhorn is £291,496. This amount is 23% higher than the average price in Poulton-le-fylde. There are 974 property listings for sale in Hardhorn.
What streets have the most expensive properties for sale in Hardhorn?
The streets with the most expensive properties for sale in Hardhorn are Fairfield Road at an average of £950,000, Hardhorn Road at an average of £611,181 and Poplar Avenue at an average of £505,000.
What streets have the most affordable properties for sale in Hardhorn?
The streets with the most affordable properties for sale in Hardhorn are Argyle Road at an average of £102,243, Oldfield Crescent at an average of £124,000 and Westwood Avenue at an average of £132,881.
Which train stations are available in or near Hardhorn?
Some of the train stations available in or near Hardhorn are Poulton-Le-Fylde, Layton and Blackpool North.
Property Price Paid in Hardhorn by Year
The average sold property price by year was:
| Year | Average Sold Price | Price Change |
Sold Properties
|
|---|---|---|---|
| 2025 | £278,618 | -12% |
29 Properties |
| 2024 | £310,991 | -8% |
42 Properties |
| 2023 | £336,636 | 24% |
40 Properties |
| 2022 | £255,190 | -22% |
62 Properties |
| 2021 | £311,097 | 10% |
90 Properties |
| 2020 | £279,066 | 23% |
50 Properties |
| 2019 | £213,967 | -21% |
55 Properties |
| 2018 | £258,499 | 1% |
66 Properties |
| 2017 | £256,575 | 13% |
80 Properties |
| 2016 | £224,379 | -0,3% |
67 Properties |
| 2015 | £225,083 | 10% |
67 Properties |
| 2014 | £202,178 | 3% |
48 Properties |
| 2013 | £196,512 | 0,1% |
52 Properties |
| 2012 | £196,296 | -11% |
46 Properties |
| 2011 | £218,813 | -8% |
43 Properties |
| 2010 | £235,773 | -11% |
29 Properties |
| 2009 | £262,848 | 14% |
33 Properties |
| 2008 | £225,570 | -10% |
47 Properties |
| 2007 | £247,587 | -3% |
72 Properties |
| 2006 | £254,413 | 20% |
91 Properties |
| 2005 | £203,543 | 10% |
63 Properties |
| 2004 | £182,225 | 6% |
82 Properties |
| 2003 | £171,328 | 13% |
89 Properties |
| 2002 | £149,765 | 25% |
91 Properties |
| 2001 | £112,868 | 19% |
97 Properties |
| 2000 | £91,137 | 1% |
69 Properties |
| 1999 | £90,090 | 8% |
94 Properties |
| 1998 | £83,094 | 4% |
57 Properties |
| 1997 | £79,497 | -4% |
69 Properties |
| 1996 | £82,869 | -1% |
58 Properties |
| 1995 | £83,648 | - |
52 Properties |
Property Price per Property Type in Hardhorn
Here you can find historic sold price data in order to help with your property search.
The average Property Paid Price for specific property types in the last three years are:
| Property Type | Average Sold Price | Sold Properties |
|---|---|---|
| Semi Detached House | £223,591.00 | 40 Semi Detached Houses |
| Detached House | £421,243.00 | 81 Detached Houses |
| Terraced House | £152,821.00 | 39 Terraced Houses |
| Flat | £108,030.00 | 13 Flats |

