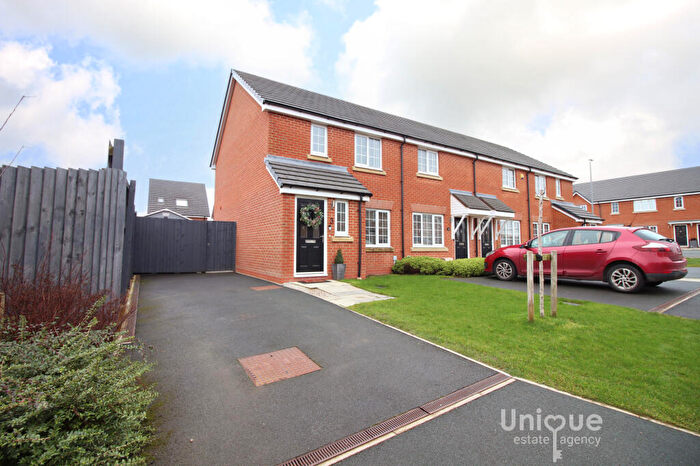
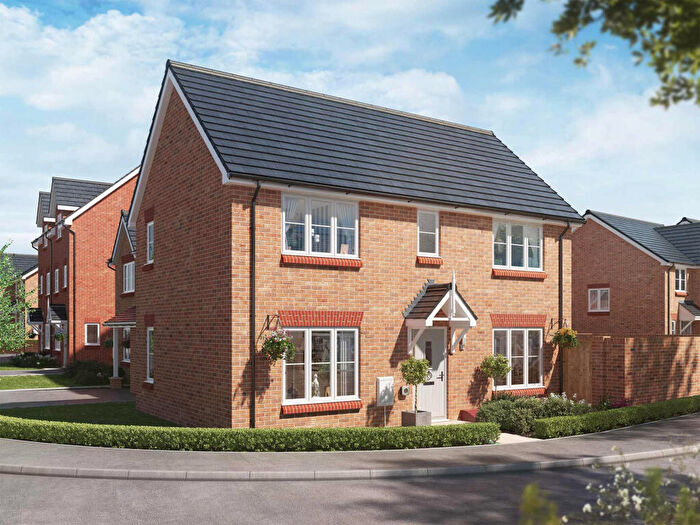
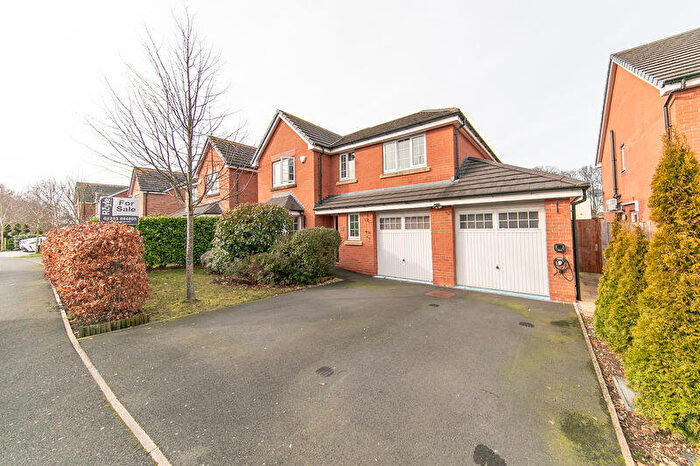
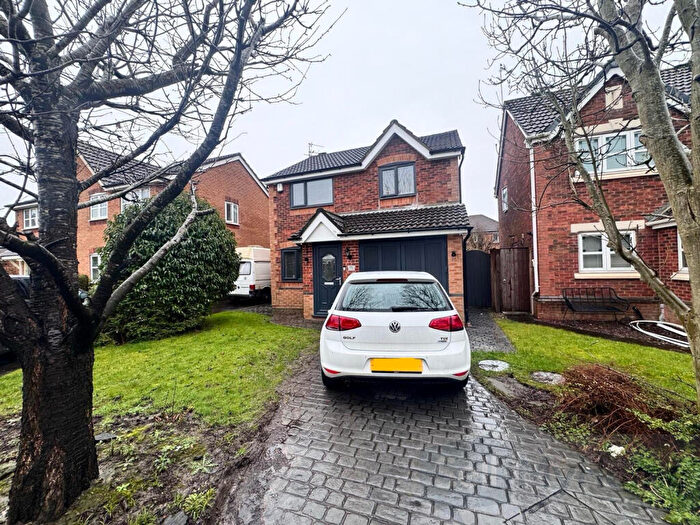
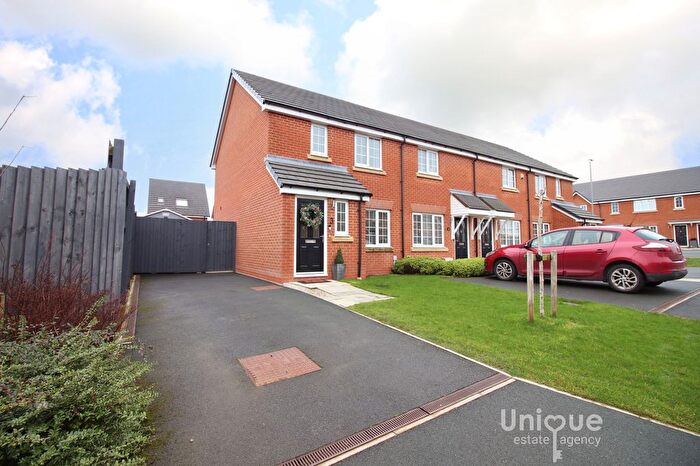
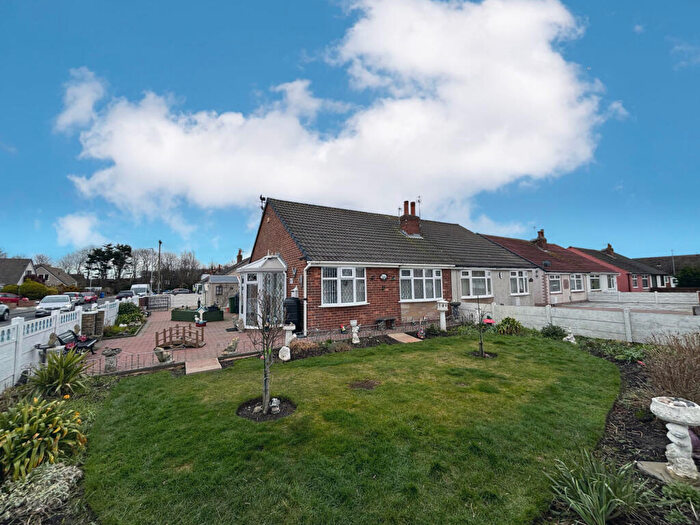
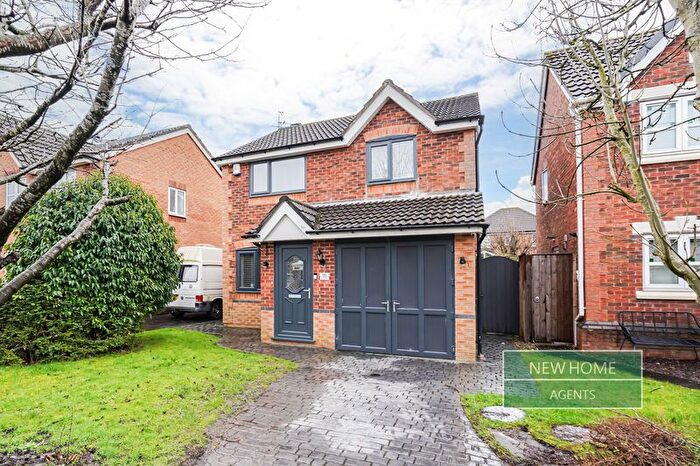
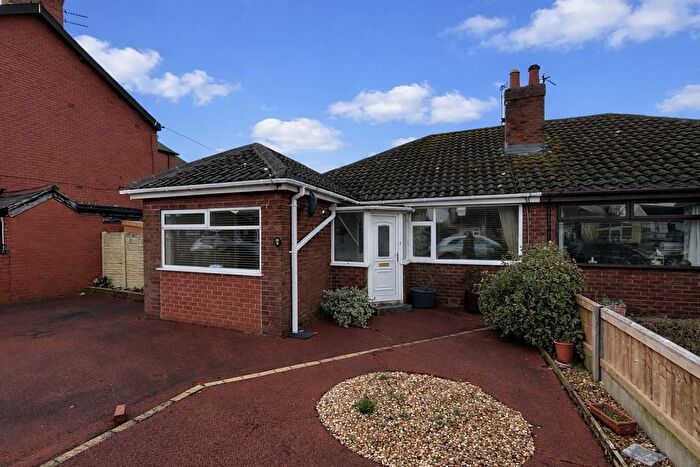
Houses for sale & to rent in Poulton-le-fylde, Lancashire
House Prices in Poulton-le-fylde
Properties in Poulton-le-fylde have an average house price of £236,731.00 and had 1,347 Property Transactions within the last 3 years.¹
Poulton-le-fylde is an area in Lancashire with 12,427 households², where the most expensive property was sold for £1,250,000.00.
Properties for sale in Poulton-le-fylde
Neighbourhoods in Poulton-le-fylde
Navigate through our locations to find the location of your next house in Poulton-le-fylde, Lancashire for sale or to rent.
Transport in Poulton-le-fylde
Please see below transportation links in this area:
- FAQ
- Price Paid By Year
- Property Type Price
Frequently asked questions about Poulton-le-fylde
What is the average price for a property for sale in Poulton-le-fylde?
The average price for a property for sale in Poulton-le-fylde is £236,731. This amount is 14% higher than the average price in Lancashire. There are more than 10,000 property listings for sale in Poulton-le-fylde.
What locations have the most expensive properties for sale in Poulton-le-fylde?
The locations with the most expensive properties for sale in Poulton-le-fylde are Elswick And Little Eccleston at an average of £810,000, Singleton And Greenhalgh at an average of £444,703 and Staining And Weeton at an average of £442,250.
What locations have the most affordable properties for sale in Poulton-le-fylde?
The locations with the most affordable properties for sale in Poulton-le-fylde are Preesall at an average of £195,288, Carleton at an average of £222,408 and Tithebarn at an average of £225,022.
Which train stations are available in or near Poulton-le-fylde?
Some of the train stations available in or near Poulton-le-fylde are Poulton-Le-Fylde, Layton and Blackpool North.
Property Price Paid in Poulton-le-fylde by Year
The average sold property price by year was:
| Year | Average Sold Price | Price Change |
Sold Properties
|
|---|---|---|---|
| 2025 | £239,728 | 2% |
401 Properties |
| 2024 | £235,128 | -0,3% |
495 Properties |
| 2023 | £235,825 | -0,1% |
451 Properties |
| 2022 | £236,078 | -1% |
578 Properties |
| 2021 | £238,164 | 8% |
841 Properties |
| 2020 | £217,940 | 9% |
617 Properties |
| 2019 | £198,195 | -5% |
676 Properties |
| 2018 | £208,050 | 6% |
668 Properties |
| 2017 | £195,581 | 5% |
617 Properties |
| 2016 | £185,211 | 1% |
517 Properties |
| 2015 | £182,516 | 3% |
511 Properties |
| 2014 | £176,272 | 6% |
427 Properties |
| 2013 | £166,267 | -6% |
431 Properties |
| 2012 | £176,564 | -1% |
320 Properties |
| 2011 | £178,109 | 1% |
322 Properties |
| 2010 | £175,936 | -4% |
331 Properties |
| 2009 | £183,687 | -9% |
327 Properties |
| 2008 | £200,314 | 4% |
348 Properties |
| 2007 | £192,616 | -6% |
659 Properties |
| 2006 | £203,319 | 13% |
689 Properties |
| 2005 | £176,620 | 8% |
521 Properties |
| 2004 | £162,962 | 10% |
699 Properties |
| 2003 | £146,021 | 26% |
762 Properties |
| 2002 | £107,582 | 16% |
791 Properties |
| 2001 | £90,261 | 8% |
814 Properties |
| 2000 | £83,414 | 9% |
718 Properties |
| 1999 | £76,188 | 10% |
779 Properties |
| 1998 | £68,444 | 1% |
578 Properties |
| 1997 | £67,484 | 7% |
611 Properties |
| 1996 | £62,909 | 0,1% |
571 Properties |
| 1995 | £62,859 | - |
485 Properties |
Property Price per Property Type in Poulton-le-fylde
Here you can find historic sold price data in order to help with your property search.
The average Property Paid Price for specific property types in the last three years are:
| Property Type | Average Sold Price | Sold Properties |
|---|---|---|
| Semi Detached House | £202,640.00 | 610 Semi Detached Houses |
| Detached House | £342,071.00 | 446 Detached Houses |
| Terraced House | £160,756.00 | 168 Terraced Houses |
| Flat | £127,606.00 | 123 Flats |

