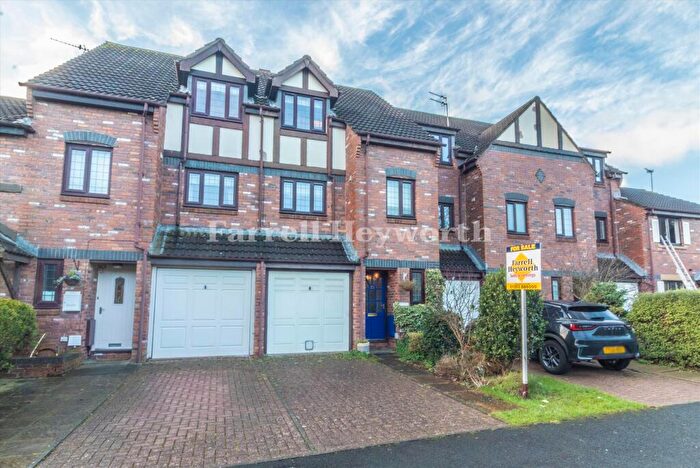
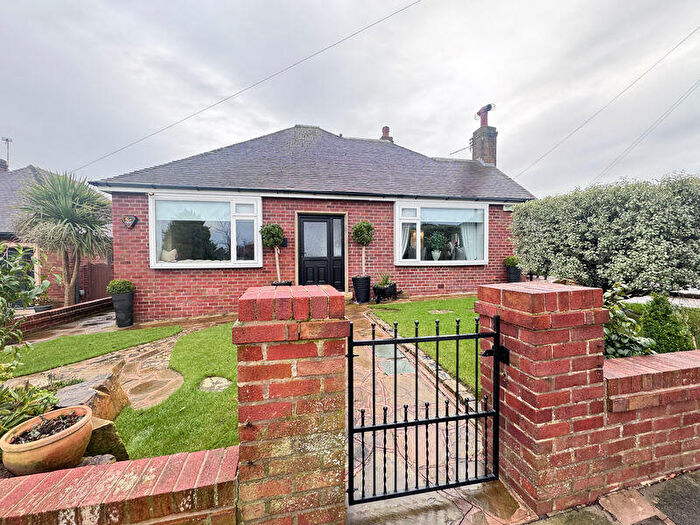
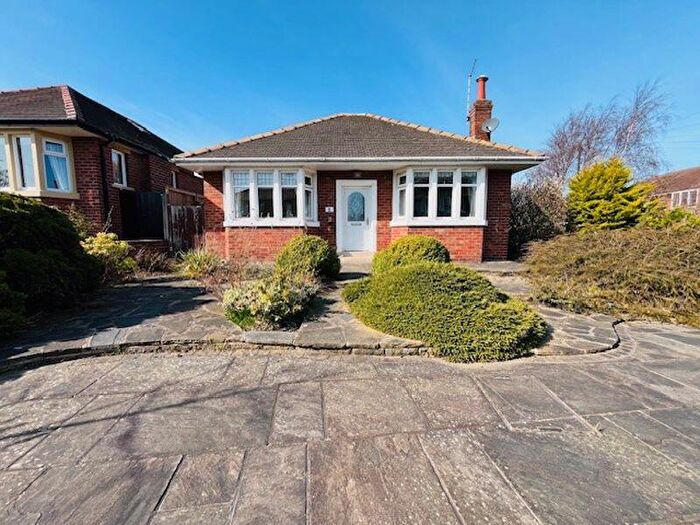
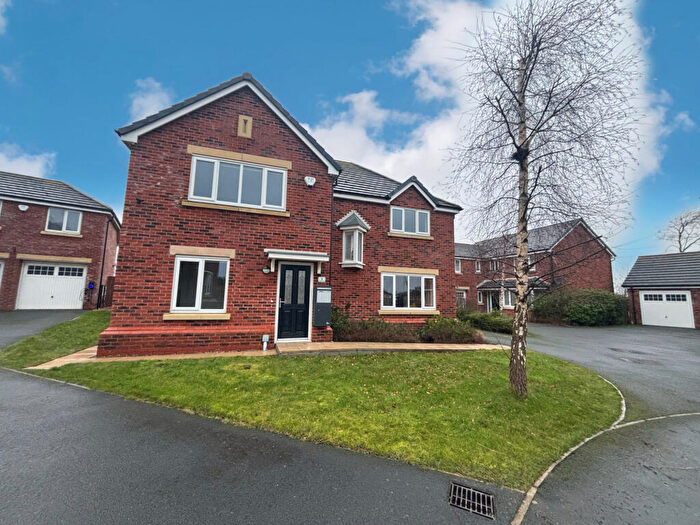
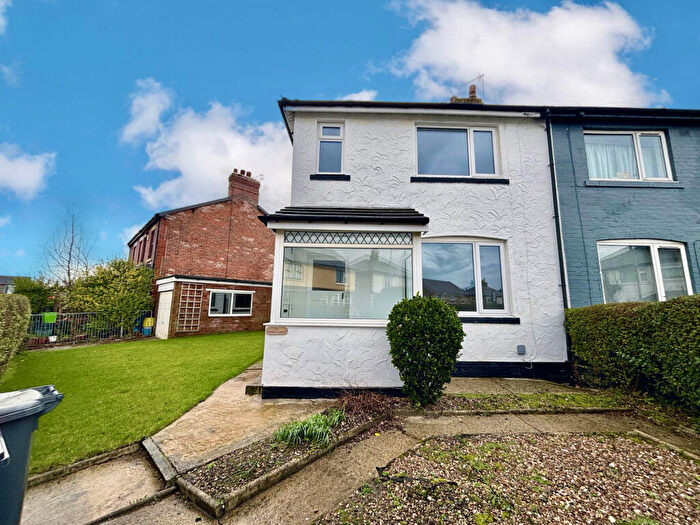
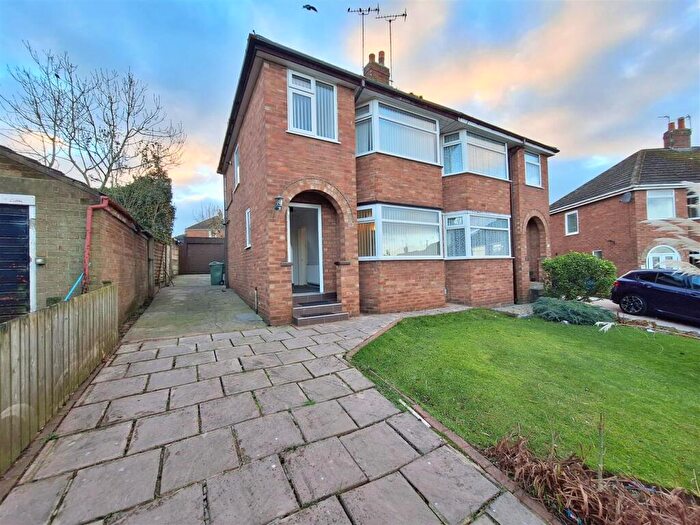
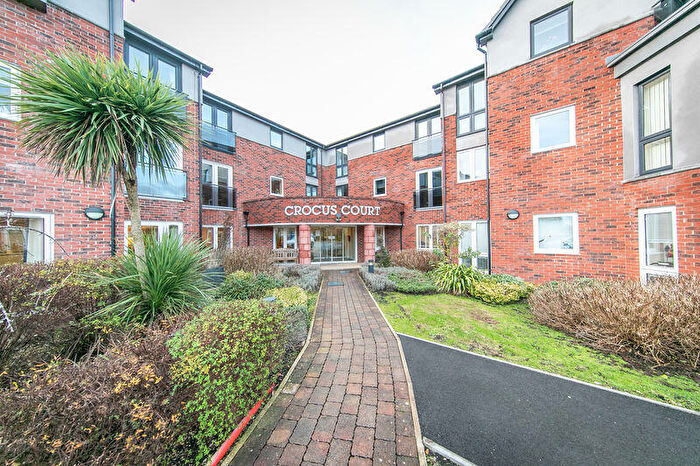
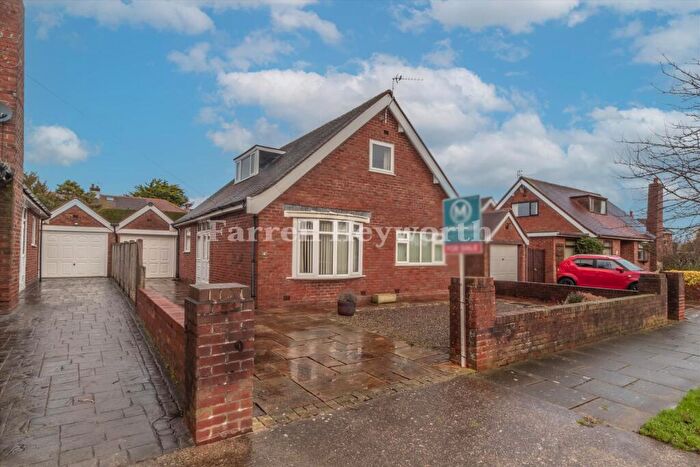
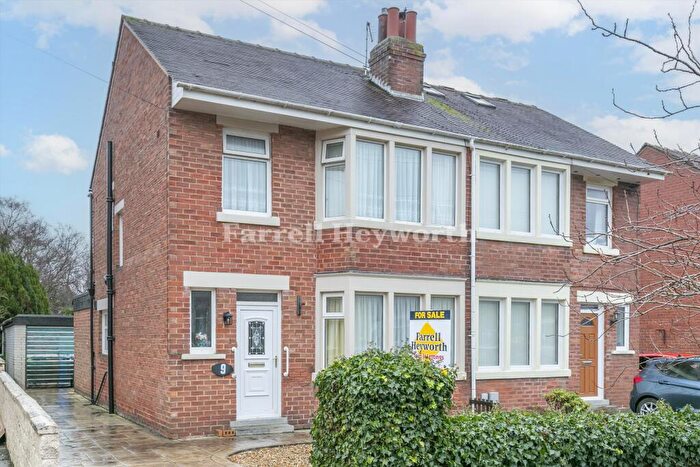
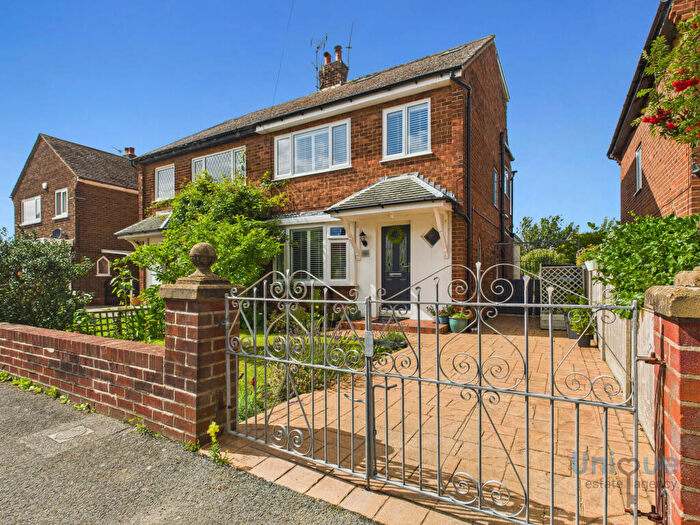
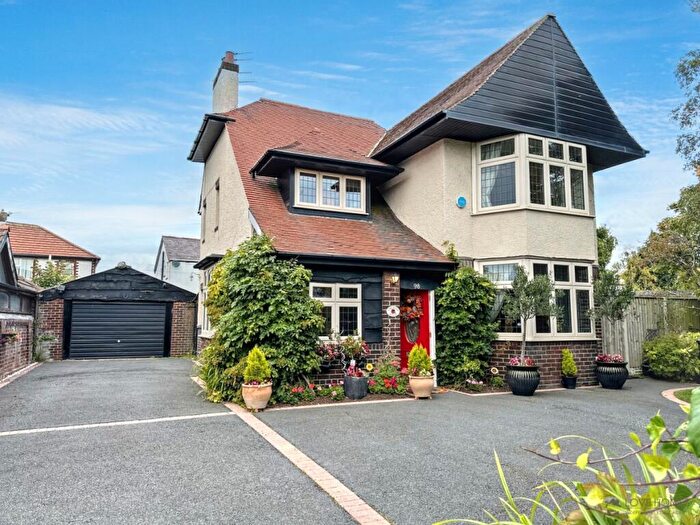
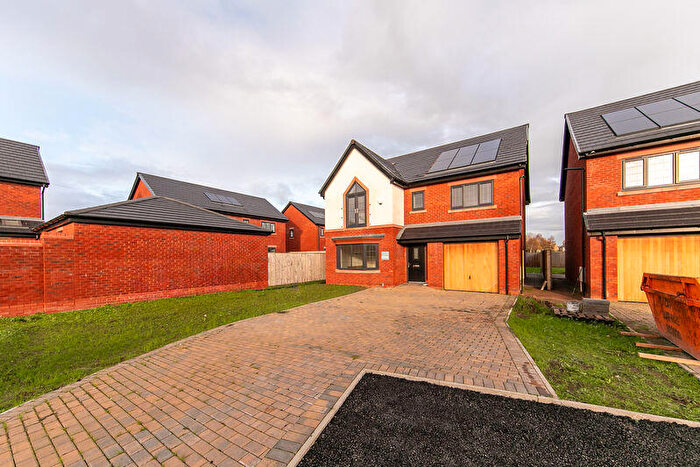
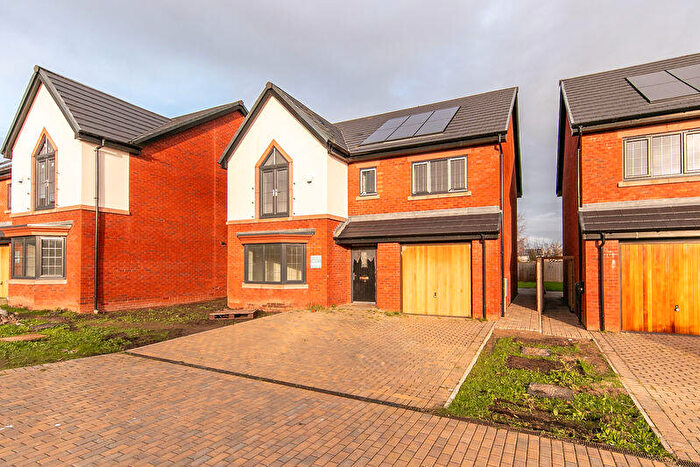
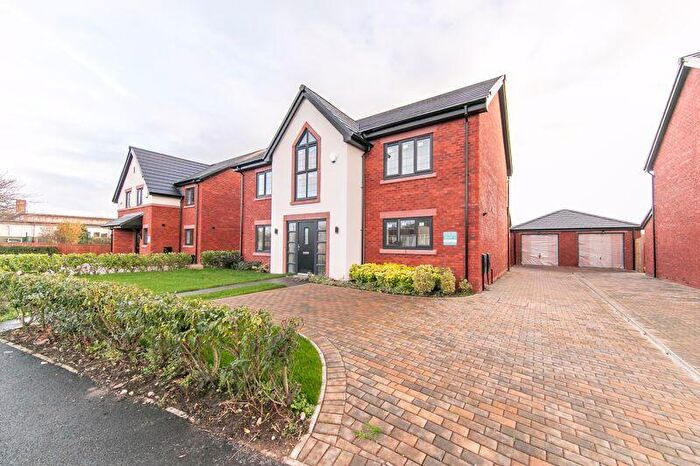
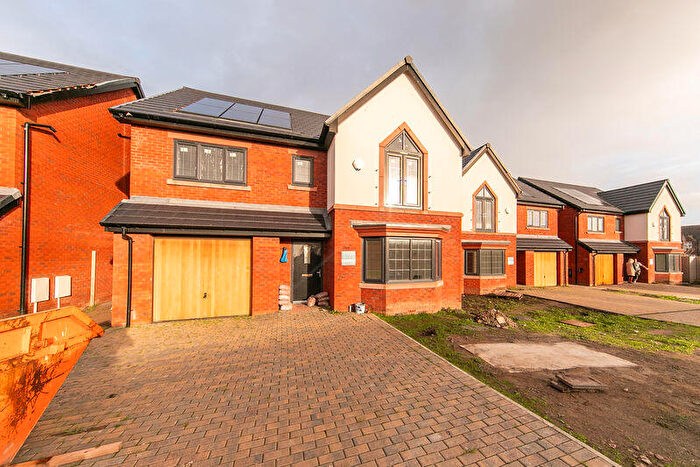
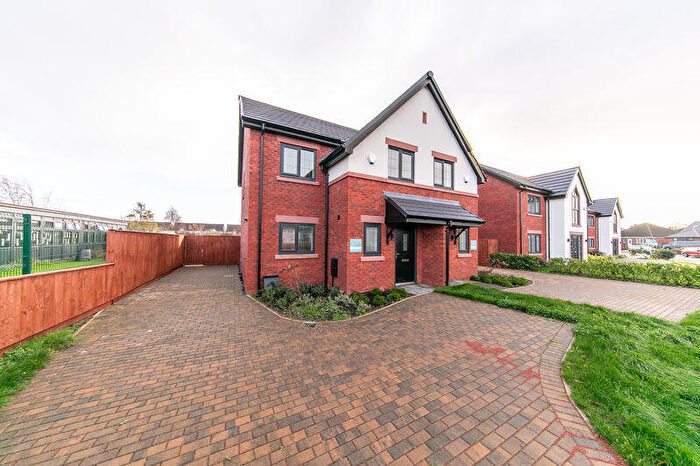
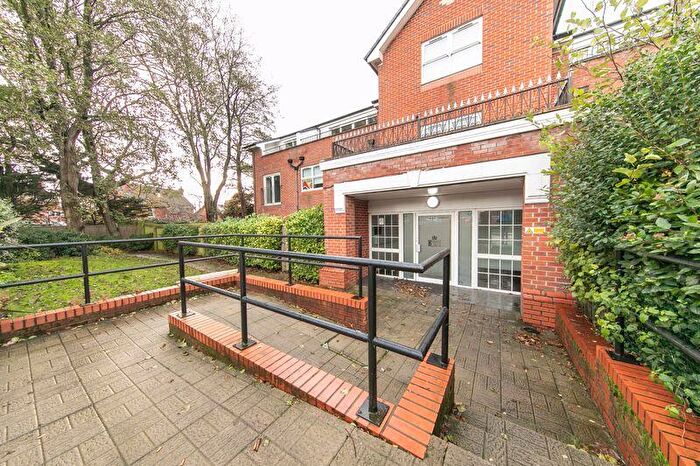
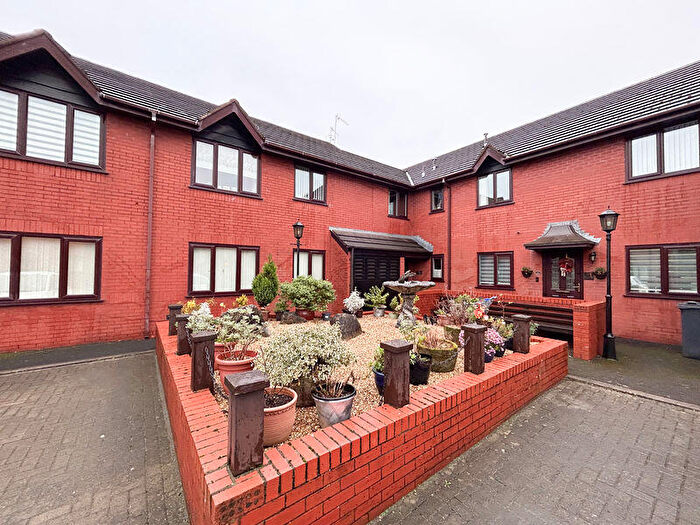
Houses for sale & to rent in High Cross, Poulton-le-fylde
House Prices in High Cross
Properties in High Cross have an average house price of £239,473.00 and had 169 Property Transactions within the last 3 years¹.
High Cross is an area in Poulton-le-fylde, Lancashire with 1,127 households², where the most expensive property was sold for £540,000.00.
Properties for sale in High Cross
Roads and Postcodes in High Cross
Navigate through our locations to find the location of your next house in High Cross, Poulton-le-fylde for sale or to rent.
| Streets | Postcodes |
|---|---|
| Beckdean Avenue | FY6 8BG |
| Beverley Avenue | FY6 8BN |
| Bleasdale Avenue | FY6 7DT |
| Brentwood Avenue | FY6 7EA |
| Brockway | FY6 8AB |
| Brompton Road | FY6 8BW |
| Caldervale Avenue | FY6 7DZ |
| Compley Avenue | FY6 8AL |
| Compley Green | FY6 8AT |
| Derwent Place | FY6 8BP |
| Dodgeons Close | FY6 7DX |
| Elm Avenue | FY6 7SP |
| Fairfield Avenue | FY6 7DR |
| Fylde View Close | FY6 8AH |
| Garstang Close | FY6 7DS |
| Garstang Road West | FY6 7SL FY6 7SN FY6 7SW FY6 8AA FY6 8AR |
| Glendale Close | FY6 7DW |
| Grizedale Avenue | FY6 7EB |
| Hardhorn Mews | FY6 8GU |
| Hardhorn Road | FY6 8AX |
| Hardhorn Way | FY6 8AE |
| Highcross Road | FY6 8BA FY6 8BD FY6 8BX FY6 8DA |
| Hodder Way | FY6 8AQ |
| Hodgson Place | FY6 8BH |
| Leander Gardens | FY6 8AZ |
| Lindsay Avenue | FY6 8BQ |
| Newland Way | FY6 8AG |
| Newton Avenue | FY6 8AN FY6 8AP |
| Northwood Way | FY6 8AF |
| Peregrine Court | FY6 8FP |
| Sefton Avenue | FY6 8BL |
| Southbourne Avenue | FY6 8AW |
| St Chads Close | FY6 8AJ |
| Stafford Avenue | FY6 8BJ |
| Stanley Avenue | FY6 7DP |
| Westby Court | FY6 8BS |
| Westby Way | FY6 8AD |
| Whitelees Way | FY6 8AU |
| Wyresdale Avenue | FY6 7DN |
Transport near High Cross
- FAQ
- Price Paid By Year
- Property Type Price
Frequently asked questions about High Cross
What is the average price for a property for sale in High Cross?
The average price for a property for sale in High Cross is £239,473. This amount is 1% higher than the average price in Poulton-le-fylde. There are 1,089 property listings for sale in High Cross.
What streets have the most expensive properties for sale in High Cross?
The streets with the most expensive properties for sale in High Cross are Stafford Avenue at an average of £452,898, Hardhorn Road at an average of £396,250 and Leander Gardens at an average of £320,000.
What streets have the most affordable properties for sale in High Cross?
The streets with the most affordable properties for sale in High Cross are Westby Court at an average of £84,500, Compley Avenue at an average of £172,200 and Fairfield Avenue at an average of £182,500.
Which train stations are available in or near High Cross?
Some of the train stations available in or near High Cross are Poulton-Le-Fylde, Layton and Blackpool North.
Property Price Paid in High Cross by Year
The average sold property price by year was:
| Year | Average Sold Price | Price Change |
Sold Properties
|
|---|---|---|---|
| 2025 | £268,729 | 17% |
34 Properties |
| 2024 | £223,651 | -3% |
36 Properties |
| 2023 | £231,212 | -3% |
37 Properties |
| 2022 | £237,546 | 8% |
62 Properties |
| 2021 | £218,907 | 3% |
70 Properties |
| 2020 | £212,476 | 12% |
42 Properties |
| 2019 | £186,393 | 2% |
51 Properties |
| 2018 | £182,106 | -4% |
58 Properties |
| 2017 | £190,035 | 8% |
55 Properties |
| 2016 | £174,734 | -2% |
51 Properties |
| 2015 | £178,922 | 1% |
55 Properties |
| 2014 | £176,699 | 12% |
47 Properties |
| 2013 | £154,867 | -1% |
50 Properties |
| 2012 | £155,842 | -4% |
34 Properties |
| 2011 | £162,047 | -7% |
37 Properties |
| 2010 | £173,382 | 6% |
31 Properties |
| 2009 | £162,258 | -21% |
23 Properties |
| 2008 | £196,256 | 7% |
33 Properties |
| 2007 | £183,440 | 6% |
54 Properties |
| 2006 | £173,200 | 5% |
61 Properties |
| 2005 | £164,770 | 12% |
50 Properties |
| 2004 | £145,231 | 9% |
58 Properties |
| 2003 | £132,571 | 29% |
42 Properties |
| 2002 | £93,806 | 18% |
56 Properties |
| 2001 | £76,997 | -11% |
72 Properties |
| 2000 | £85,418 | 14% |
49 Properties |
| 1999 | £73,424 | 9% |
66 Properties |
| 1998 | £66,900 | 6% |
58 Properties |
| 1997 | £63,211 | 0,2% |
49 Properties |
| 1996 | £63,070 | 4% |
55 Properties |
| 1995 | £60,682 | - |
44 Properties |
Property Price per Property Type in High Cross
Here you can find historic sold price data in order to help with your property search.
The average Property Paid Price for specific property types in the last three years are:
| Property Type | Average Sold Price | Sold Properties |
|---|---|---|
| Semi Detached House | £223,239.00 | 120 Semi Detached Houses |
| Detached House | £314,298.00 | 36 Detached Houses |
| Terraced House | £209,050.00 | 10 Terraced Houses |
| Flat | £92,333.00 | 3 Flats |

