
Houses for sale in Chipping, Preston
House Prices in Chipping
Properties in Chipping have an average house price of £370k and had 37 Property Transactions within the last 3 years¹.
Chipping is an area in Preston, Lancashire with 532 households², where the most expensive property was sold for £1.1M.
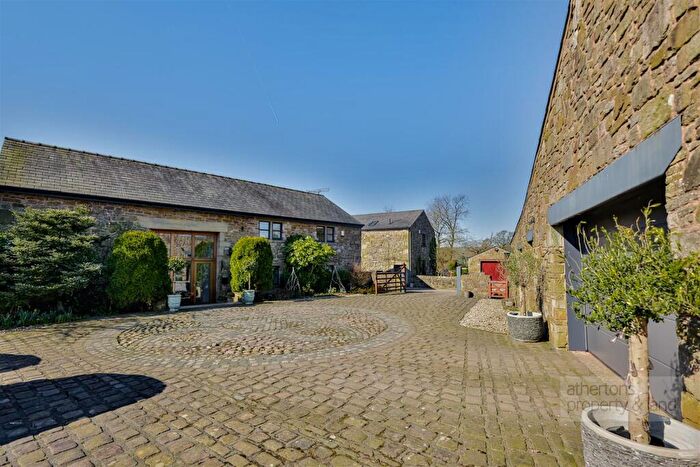
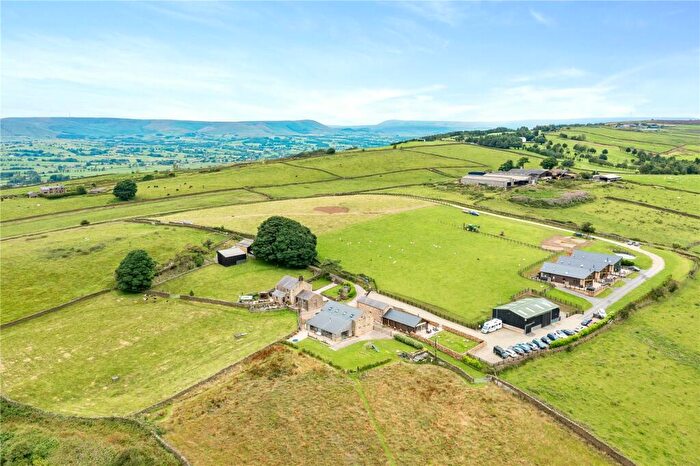
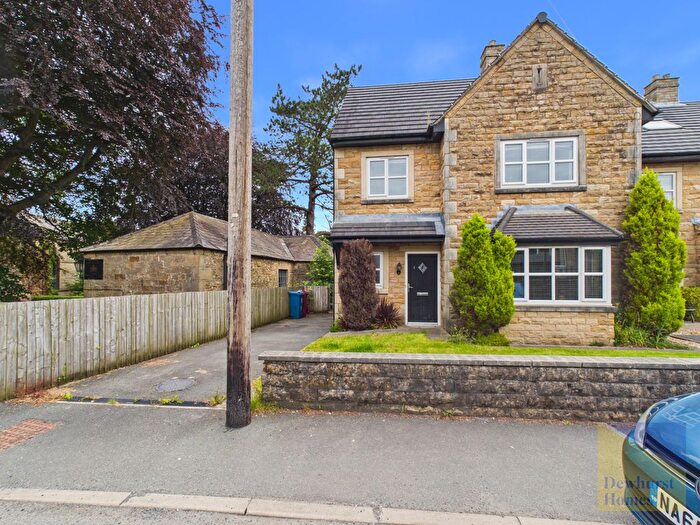
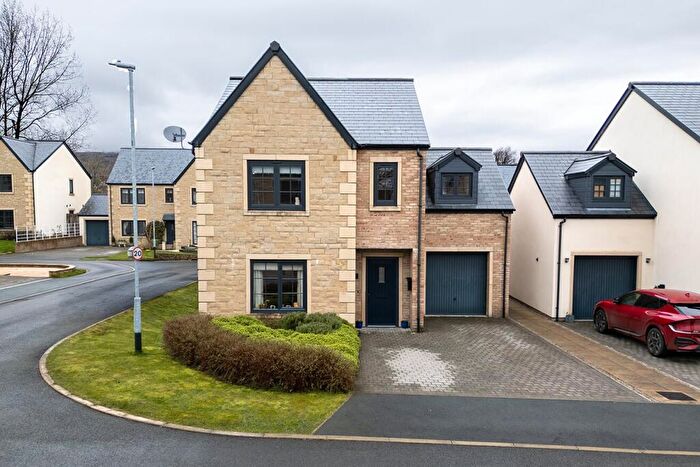
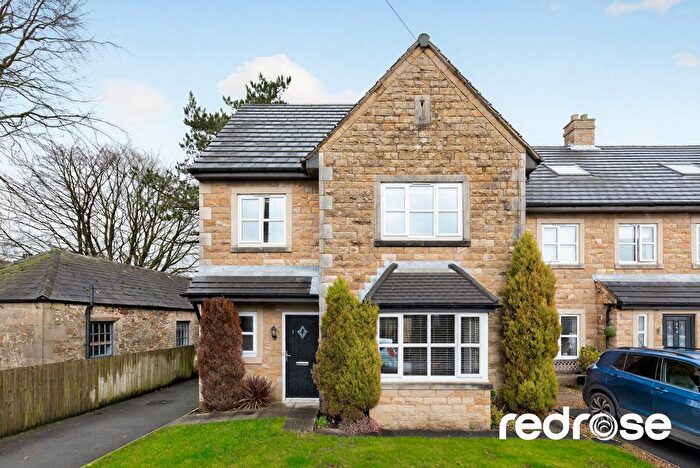
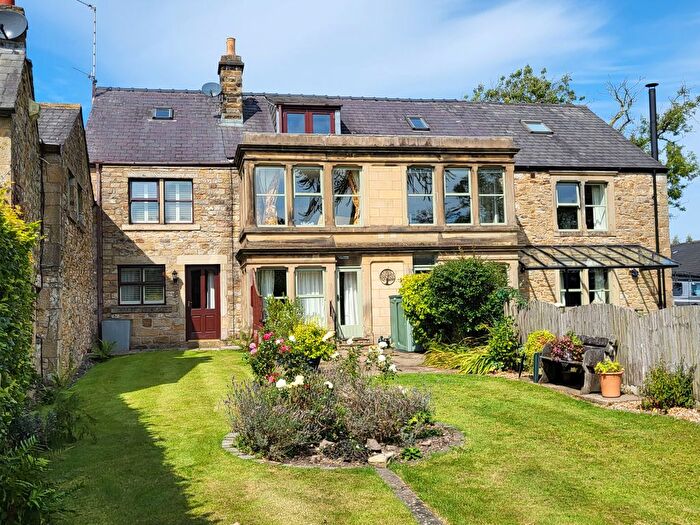
Properties for sale in Chipping

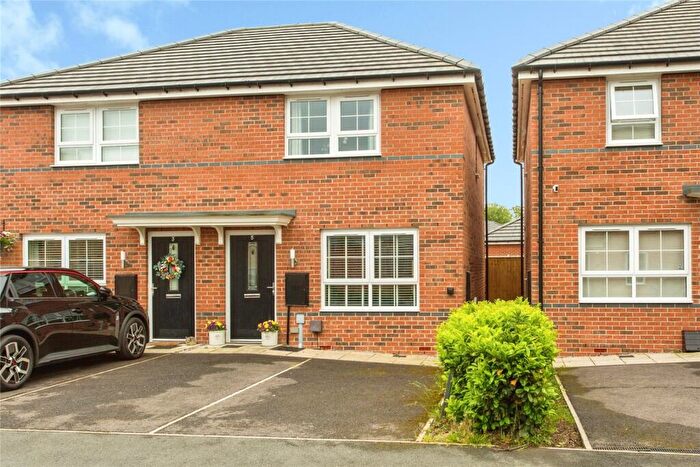
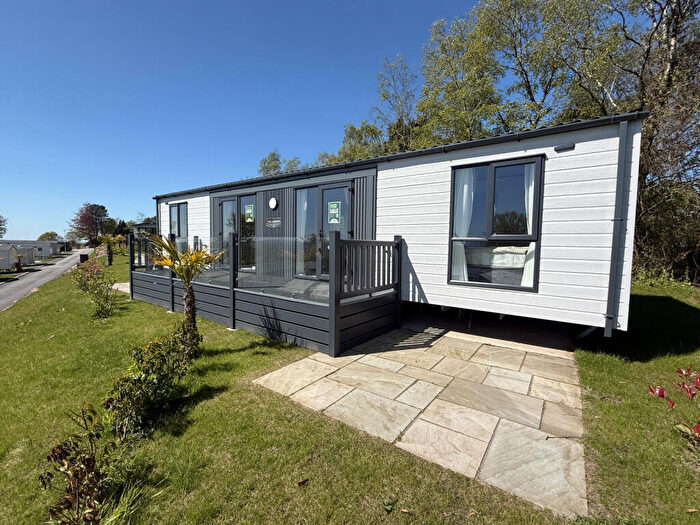
![]()
If you are looking to sell your house, let it out, or receive a property valuation, an expert can help you.
Click the button below to get started.
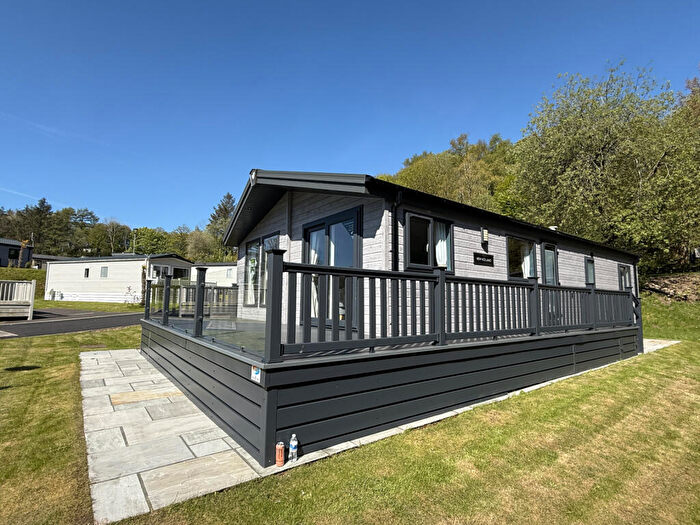
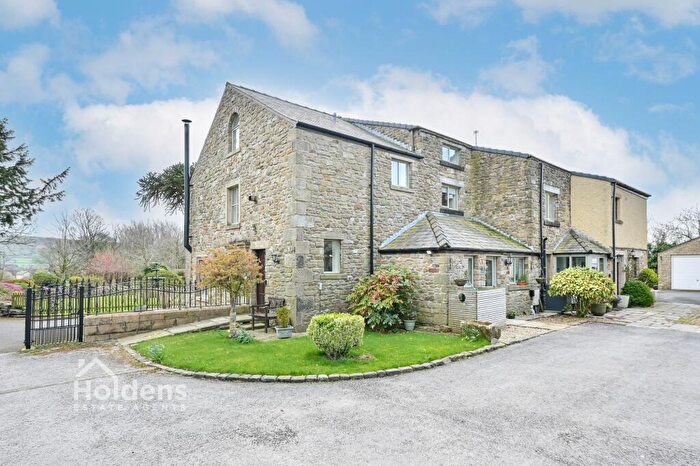
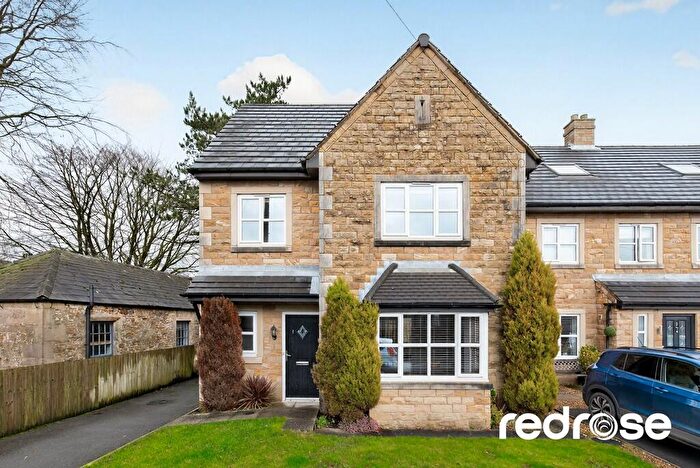
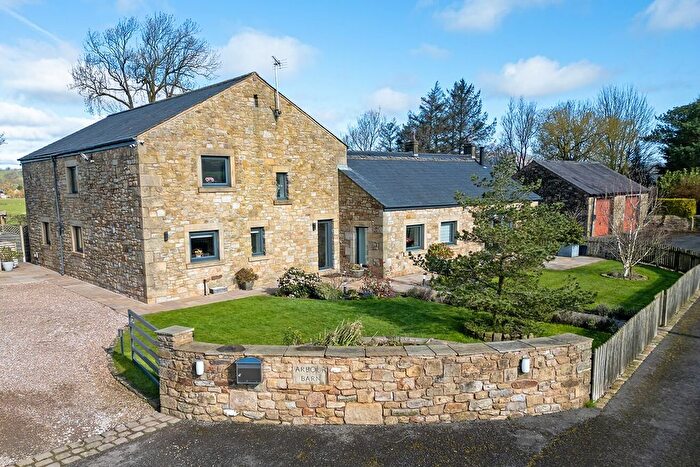
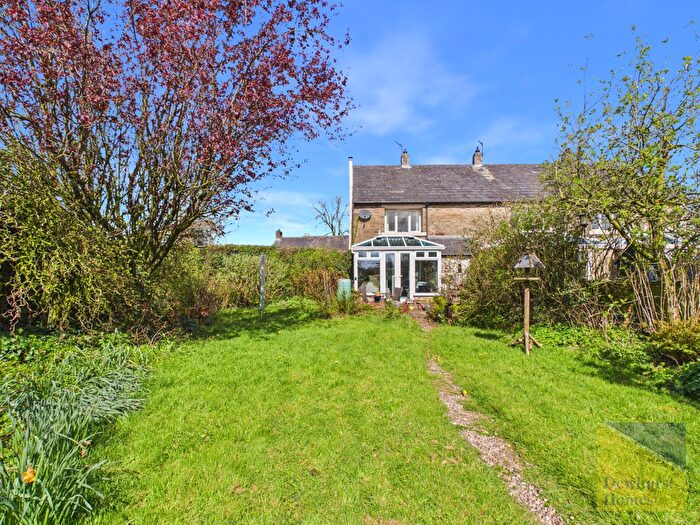
Previously listed properties in Chipping
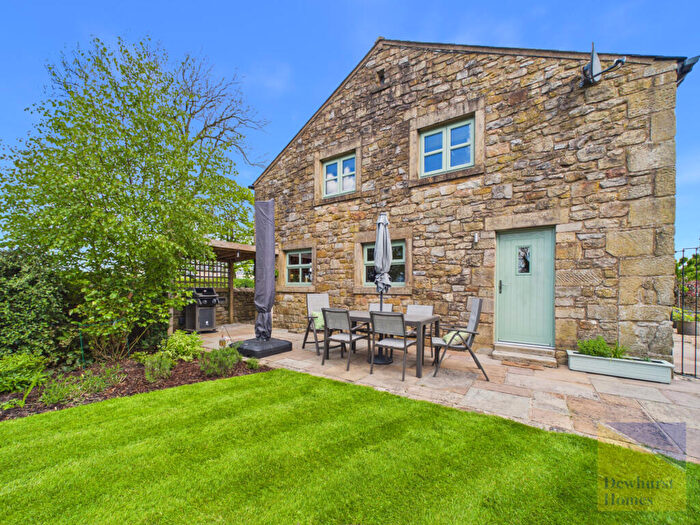
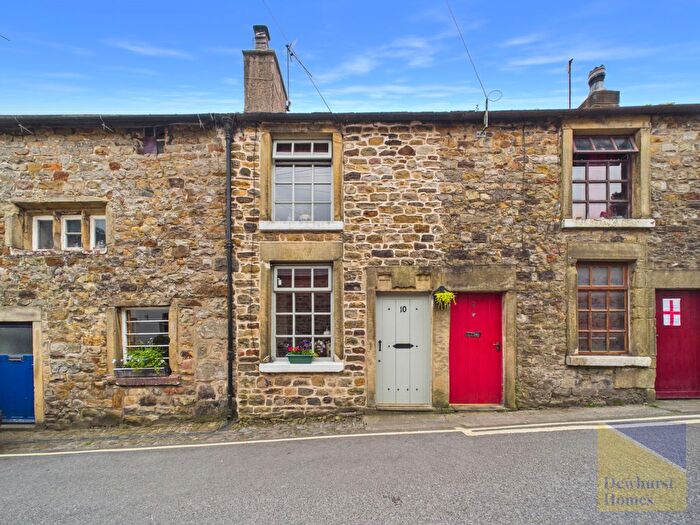

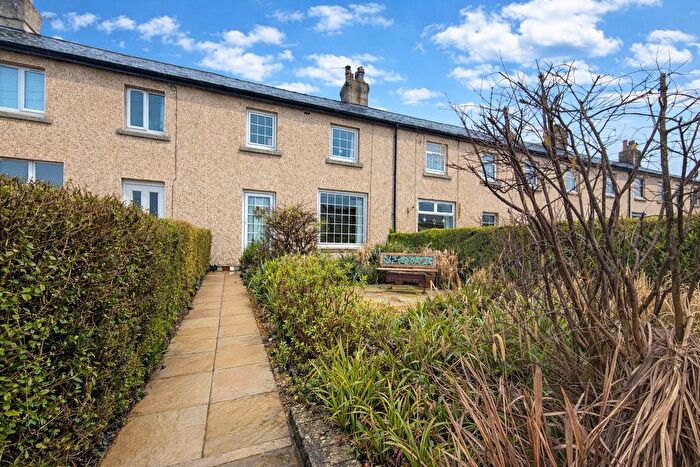
![]()
If you are looking to sell your house, let it out, or receive a property valuation, an expert can help you.
Click the button below to get started.
Roads and Postcodes in Chipping
Navigate through our locations to find the location of your next house in Chipping, Preston for sale or to rent.
| Streets | Postcodes |
|---|---|
| Back Lane | PR3 2QA |
| Black House Lane | PR3 2NR |
| Blacksticks Lane | PR3 2WL |
| Brickhouse Gardens | PR3 2QG |
| Broad Meadow | PR3 2GH |
| Brookfield Court | PR3 2QX |
| Brooklands | PR3 2QU |
| Chipping | PR3 2NN |
| Church Raike | PR3 2QL |
| Club Row | PR3 2QH |
| Collins Hill Lane | PR3 2WQ |
| Cornflower Drive | PR3 2PA |
| Cutler Lane | PR3 2SY |
| Elmridge Lane | PR3 2NY |
| Fiddlers Lane | PR3 2WN |
| Garstang Road | PR3 2QJ |
| Gib Hey Lane | PR3 2WU |
| Goose Lane | PR3 2QB PR3 2QF |
| Green Lane | PR3 2TQ |
| Grove Square | PR3 2GP |
| Height Lane | PR3 2NU |
| Hesketh Lane | PR3 2TH |
| Houghclough Lane | PR3 2NT |
| Inglewhite Road | PR3 2GJ |
| Judd Holmes Lane | PR3 2TJ |
| Kirk Cottages | PR3 2QN |
| Kirkfield | PR3 2GL |
| Kirklands | PR3 2GN |
| Leagram Park | PR3 2RD |
| Longridge Road | PR3 2QD |
| Loud Bridge | PR3 2NX |
| Marjoram Drive | PR3 2NW |
| Mill Lane | PR3 2PB |
| Mills Way | PR3 2DP |
| Moss Lane | PR3 2TR |
| Old Hive | PR3 2QQ |
| Out Lane | PR3 2NQ |
| Parsonage Lane | PR3 2NS |
| Sandy Bank | PR3 2GA |
| Stanley Court | PR3 2GE |
| Startifants Lane | PR3 2NP |
| Swinglehurst Cottages | PR3 2QW |
| Talbot Street | PR3 2QE |
| The Grove | PR3 2QP |
| Tweedys Court | PR3 2QY |
| Windy Street | PR3 2GD |
| Wolfs Fell Close | PR3 2DR |
| PR3 1UT PR3 2GQ PR3 2GR PR3 2GS PR3 2HB PR3 2NZ PR3 2QR PR3 2QS PR3 2QT PR3 2WP |
Property price trends in Chipping
According to the latest Land Registry data, the average home in Chipping sold for £723,750 in 2026. That figure comes from 529 sales logged over the past 31 years.
Prices have continued to climb over the last three years. Compared with 2023, when the typical sale came in around £324,437, that's a rise of roughly 123.1%.
Looking back five years, average prices are up about 75.5% since 2021, a gain of around £311,388 in cash terms.
Zoom out to the past decade for the fuller picture. Back in 2016, homes here averaged £250,170, so the typical sold price has climbed about 189.3% since then, roughly 11.2% a year. Stretch the view to fifteen years and that annual pace eases back to about 4.1%.
Frequently asked questions about Chipping
What is the average price for a property for sale in Chipping?
The average price for a property for sale in Chipping is £369,540. This amount is 65% higher than the average price in Preston. There are 80 property listings for sale in Chipping.
What streets have the most expensive properties for sale in Chipping?
The streets with the most expensive properties for sale in Chipping are Cutler Lane at an average of £1,100,000, Tweedys Court at an average of £510,000 and Wolfs Fell Close at an average of £430,000.
What streets have the most affordable properties for sale in Chipping?
The streets with the most affordable properties for sale in Chipping are Kirkfield at an average of £135,000, Windy Street at an average of £181,250 and Kirklands at an average of £204,142.
Which train stations are available in or near Chipping?
Some of the train stations available in or near Chipping are Langho, Clitheroe and Whalley.
Property Price Paid in Chipping by Year
The average sold property price by year was:
| Year | Average Sold Price | Price Change |
Sold Properties
|
|---|---|---|---|
| 2026 | £723,750 | 40% |
2 Properties |
| 2025 | £434,687 | 44% |
16 Properties |
| 2024 | £243,181 | -33% |
11 Properties |
| 2023 | £324,437 | -34% |
8 Properties |
| 2022 | £435,020 | 5% |
29 Properties |
| 2021 | £412,362 | 33% |
44 Properties |
| 2020 | £275,497 | -35% |
24 Properties |
| 2019 | £371,736 | 10% |
23 Properties |
| 2018 | £336,078 | 5% |
13 Properties |
| 2017 | £318,730 | 22% |
15 Properties |
Property Price per Property Type in Chipping
Here you can find historic sold price data in order to help with your property search.
The average Property Paid Price for specific property types in the last three years are:
| Property Type | Average Sold Price | Sold Properties |
|---|---|---|
| Semi Detached House | £338,727.00 | 11 Semi Detached Houses |
| Detached House | £555,884.00 | 13 Detached Houses |
| Terraced House | £209,269.00 | 13 Terraced Houses |
