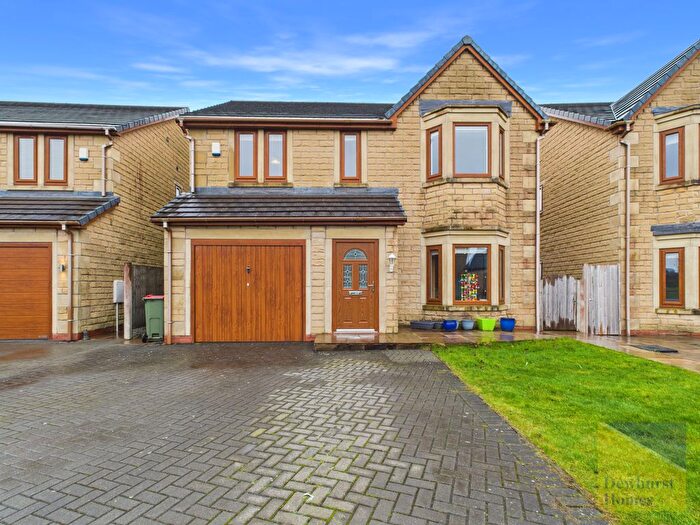
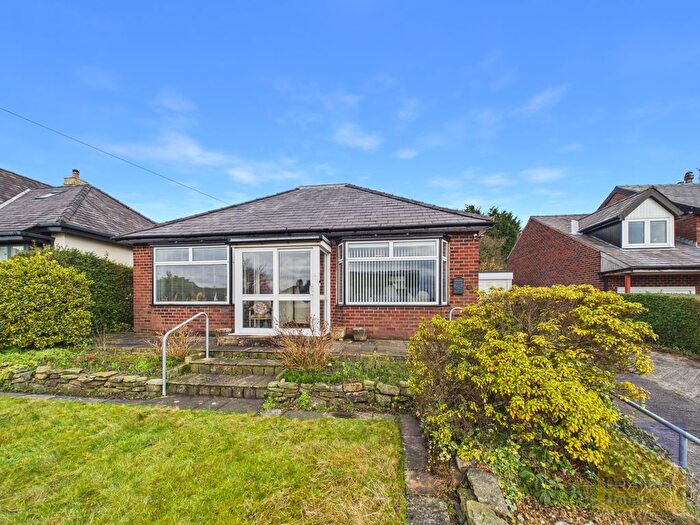
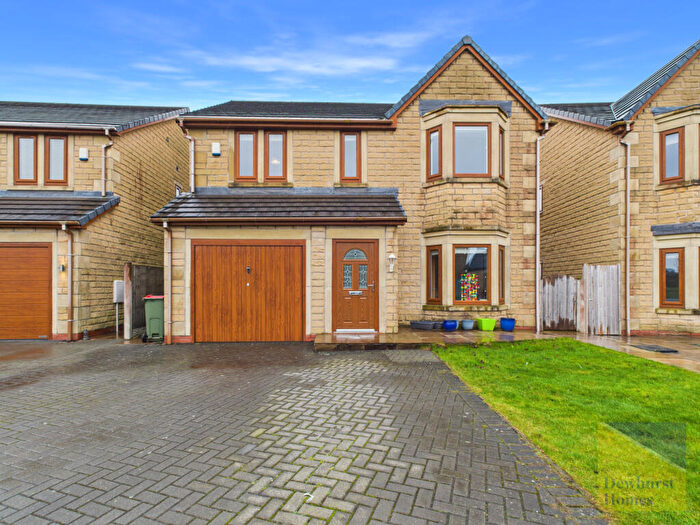
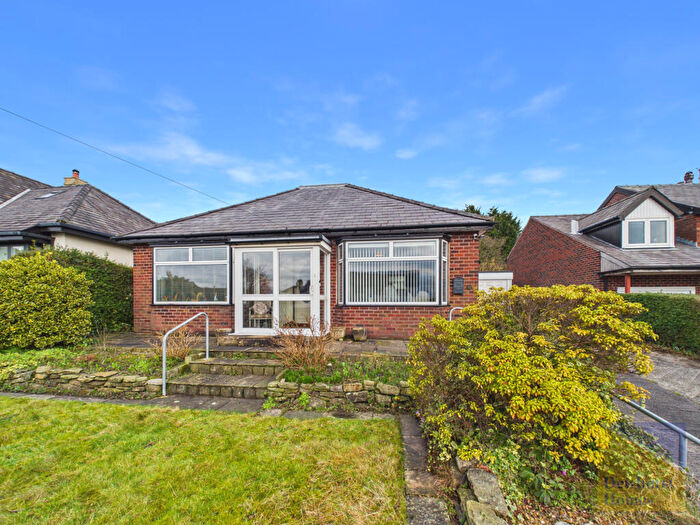
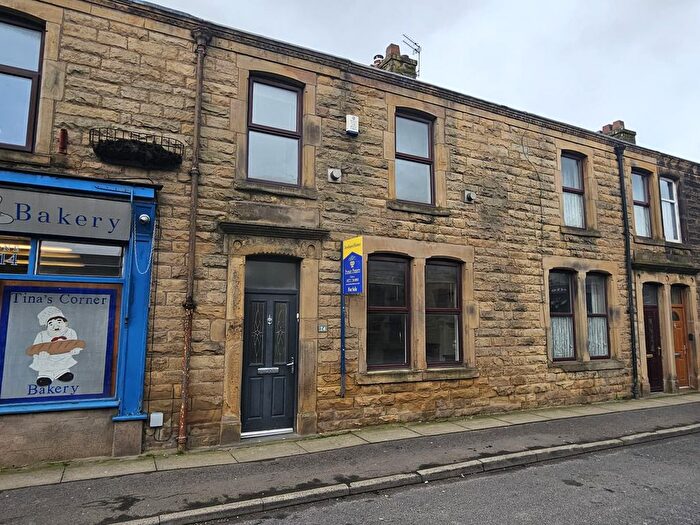
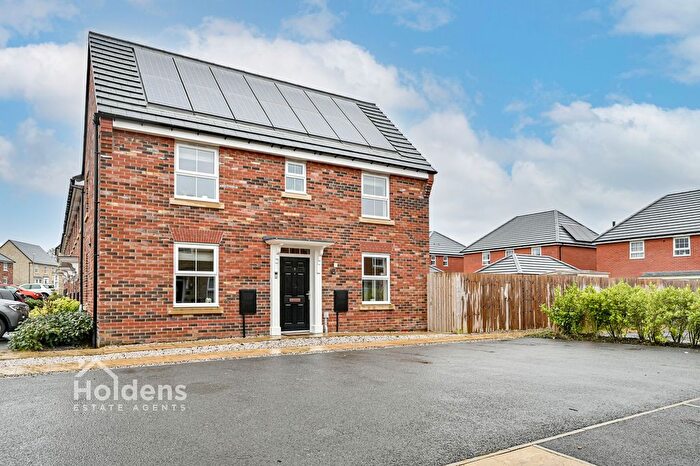
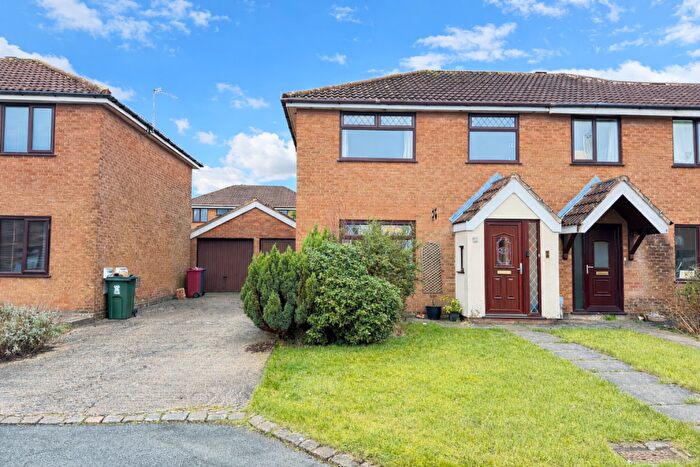
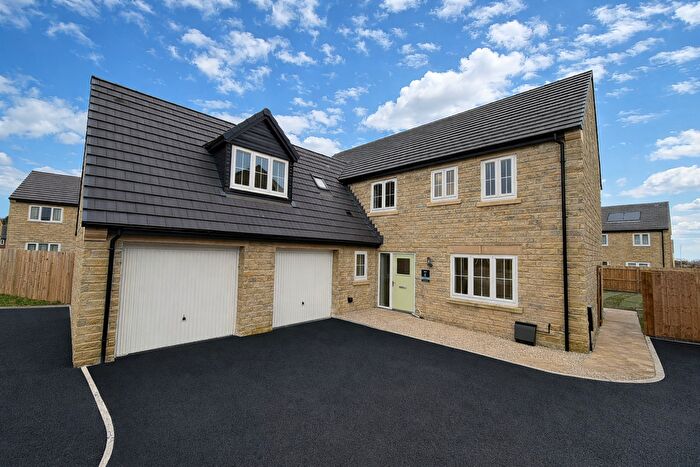
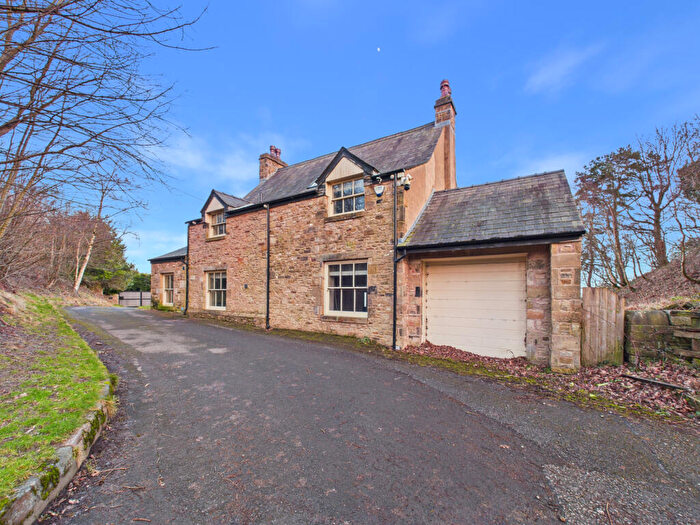
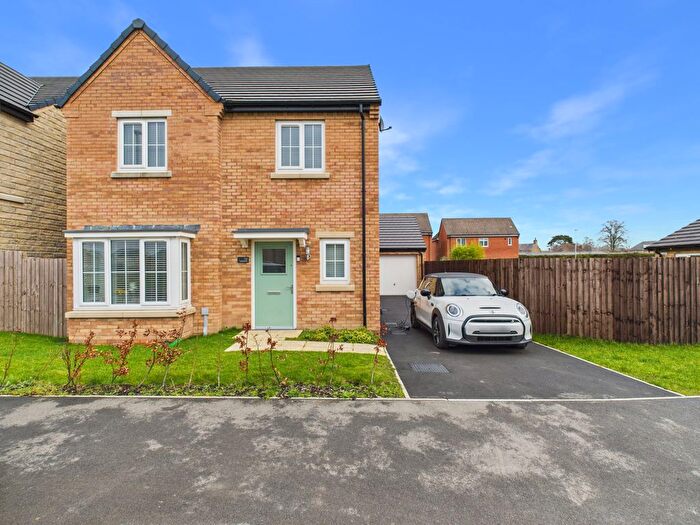
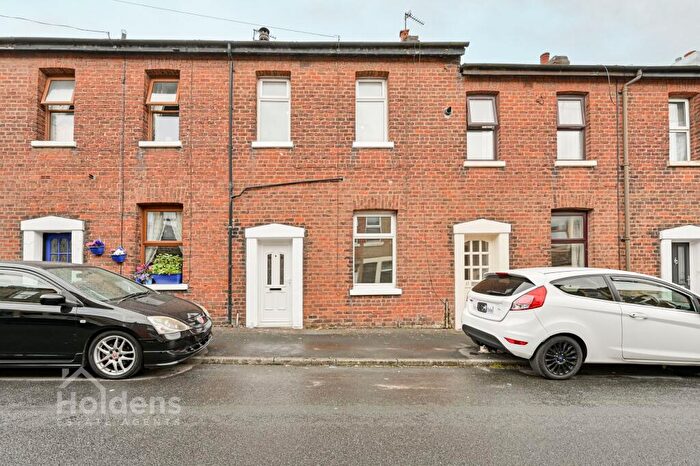
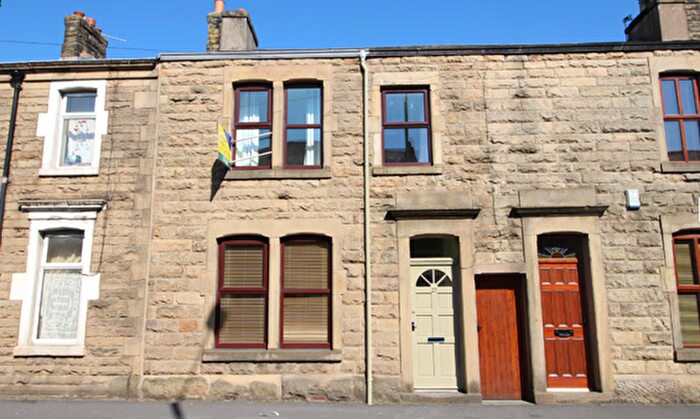
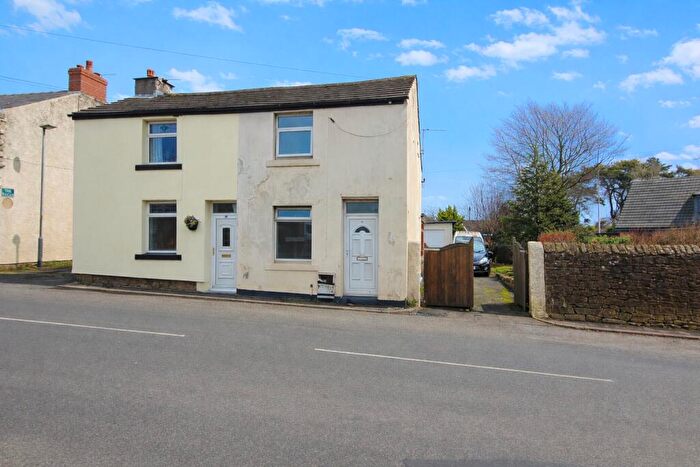
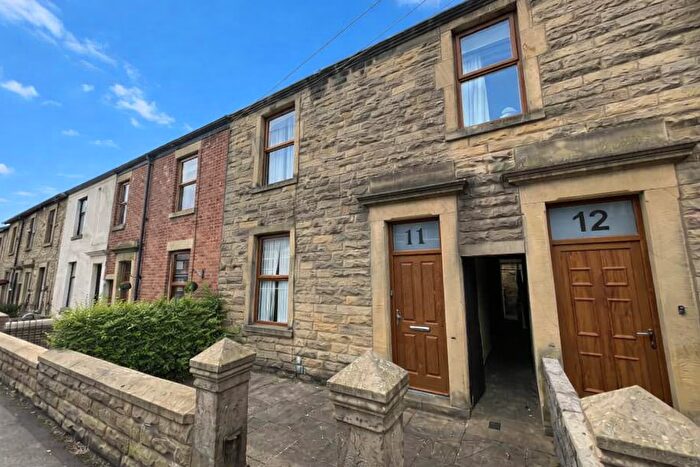
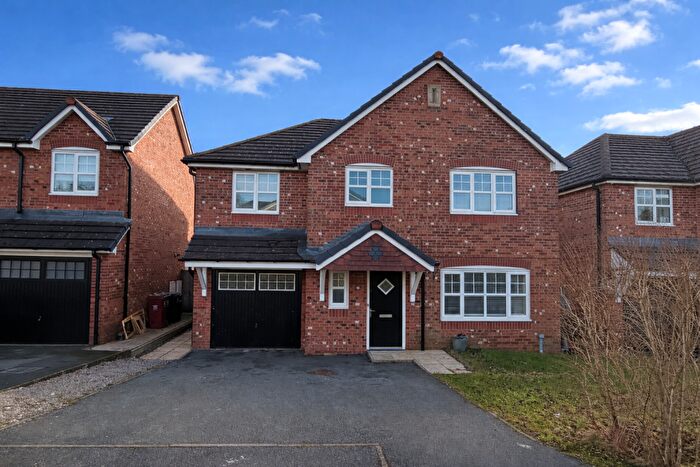
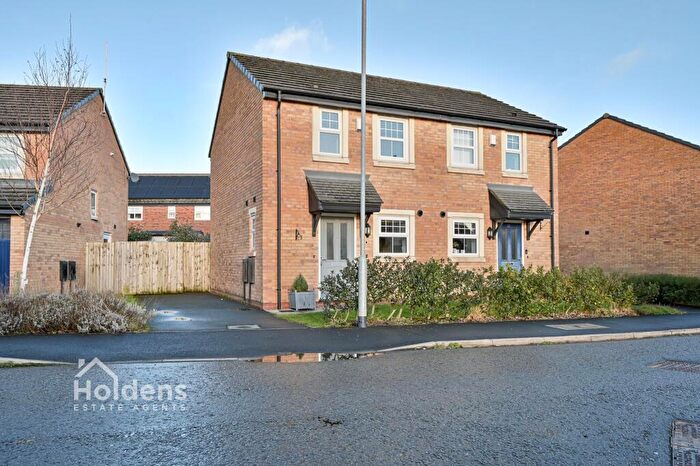
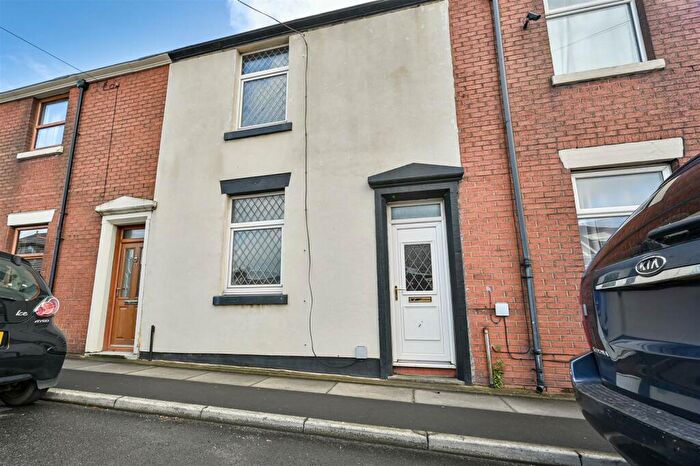
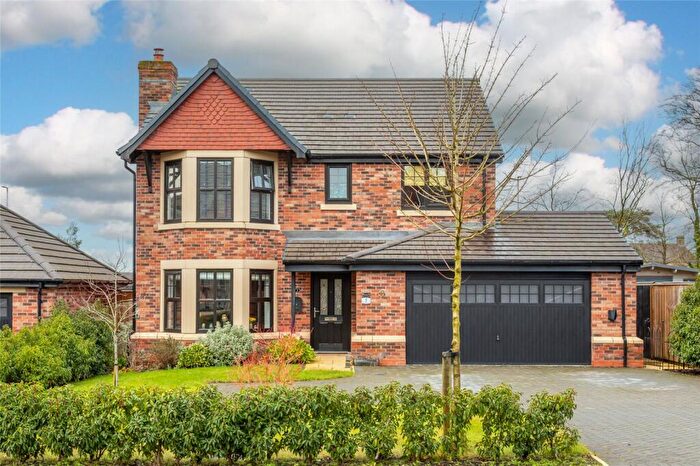
Houses for sale & to rent in Derby And Thornley, Preston
House Prices in Derby And Thornley
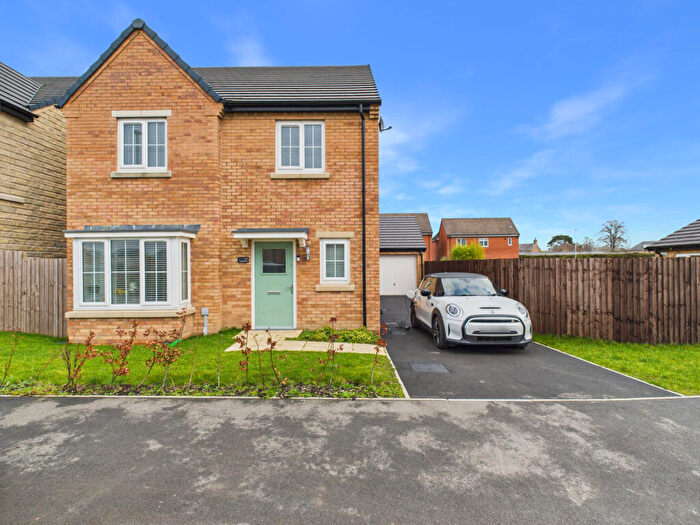
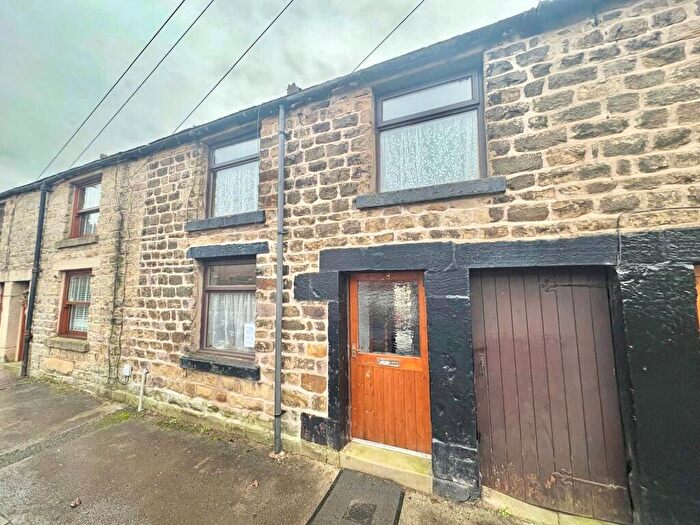
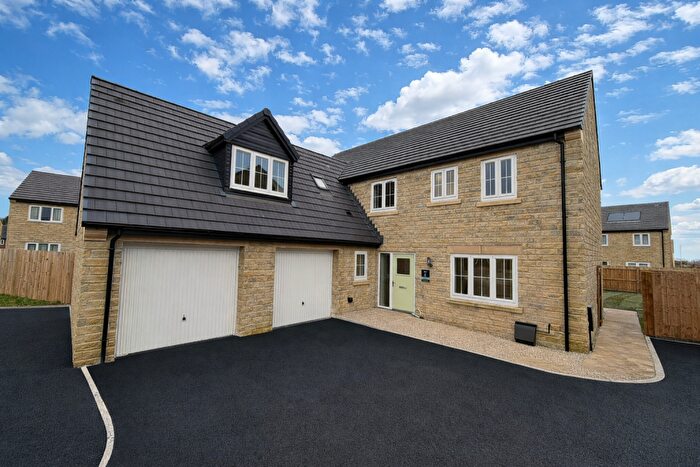
Properties in Derby And Thornley have an average house price of £209,915.00 and had 138 Property Transactions within the last 3 years¹.
Derby And Thornley is an area in Preston, Lancashire with 1,287 households², where the most expensive property was sold for £2,052,000.00.
Properties for sale in Derby And Thornley
Roads and Postcodes in Derby And Thornley
Navigate through our locations to find the location of your next house in Derby And Thornley, Preston for sale or to rent.
| Streets | Postcodes |
|---|---|
| Alexandra Road | PR3 3EJ |
| Arndale Road | PR3 2AE |
| Ashton Street | PR3 3NQ |
| Barclay Road | PR3 3JF PR3 3LD |
| Barnacre Road | PR3 2PD |
| Belmont Court | PR3 3TG |
| Berry Lane | PR3 3JA PR3 3JP PR3 3NH PR3 3WH |
| Birchfield Drive | PR3 3HP |
| Birks Brow | PR3 2TX |
| Bleasdale Court | PR3 3TX |
| Brewery Street | PR3 3NB |
| Calder Avenue | PR3 3HT |
| Caton Close | PR3 3RH |
| Chapel Street | PR3 3JH |
| Charles Grove | PR3 3FL |
| Cherry Grove | PR3 3EY |
| Chipping Road | PR3 2LY PR3 2NB PR3 2TB PR3 2TE |
| Church Gardens | PR3 3WG |
| Church Street | PR3 3WA |
| Clough Lane | PR3 2TP |
| Crumpax Avenue | PR3 3JQ |
| Crumpax Croft | PR3 3JW |
| Crumpax Meadows | PR3 3JG |
| Davis Street | PR3 3NL |
| Derby Road | PR3 3EE PR3 3FE PR3 3JT PR3 3NP |
| Dixon Road | PR3 3JE |
| Dunderdale Street | PR3 3WB |
| Eden Gardens | PR3 3WF |
| Fairsnape Avenue | PR3 3TL |
| Fleet Street | PR3 3ED |
| Forty Acre Lane | PR3 2TY |
| Four Acre Lane | PR3 2TD |
| Gas Street | PR3 3WP |
| George Street | PR3 3NN |
| Green Lane | PR3 3RA |
| Halton Place | PR3 3RJ |
| Hesketh Road | PR3 2PE |
| Higher Road | PR3 2TW |
| Hodder Street | PR3 3JB |
| Holly Grove | PR3 3HR |
| Hornby Road | PR3 3RE |
| Humber Street | PR3 3WD |
| Inglewhite Road | PR3 2NA PR3 3JR PR3 3JS |
| Irwell Street | PR3 3NA PR3 3RD |
| Isabella Street | PR3 3WL |
| Jeffrey Avenue | PR3 3TH PR3 3TJ |
| Jeffrey Hill | PR3 2TU |
| Kestor Lane | PR3 3JX |
| King Street | PR3 3RQ |
| Lime Grove | PR3 3HN |
| Lords Lane | PR3 2TA |
| Lune Street | PR3 3RP |
| Market Place | PR3 3JD |
| Mary Street West | PR3 3WN |
| Mersey Street | PR3 3NE PR3 3RL PR3 3WE |
| Moss Side Lane | PR3 2ND |
| Nateby Close | PR3 2PH |
| Neville Street | PR3 3FD |
| Parlick Avenue | PR3 3TN |
| Queens Drive | PR3 3FJ |
| Regent Street | PR3 3FH |
| Severn Street | PR3 3ND |
| Sharley Fold | PR3 3LA |
| Sharples Court | PR3 3WJ |
| St Marys Close | PR3 3NW |
| St Wilfrids Terrace | PR3 3WQ |
| Stanley Street | PR3 3NJ |
| Steeple View | PR3 2AG |
| Thornfield Avenue | PR3 3HL |
| Towneley Parade | PR3 3HU |
| Towneley Road | PR3 3EA |
| Towneley Road West | PR3 3AB |
| Victoria Street | PR3 3EH |
| Warwick Street | PR3 3EB |
| Willows Park Lane | PR3 3HJ |
| Windsor Avenue | PR3 3EL |
| PR3 2TL PR3 2TN PR3 2TS |
Transport near Derby And Thornley
-
Ramsgreave and Wilpshire Station
-
Langho Station
-
Preston Station
-
Pleasington Station
-
Whalley Station
-
Cherry Tree Station
-
Blackburn Station
-
Bamber Bridge Station
-
Mill Hill (Lancashire) Station
-
Lostock Hall Station
- FAQ
- Price Paid By Year
- Property Type Price
Frequently asked questions about Derby And Thornley
What is the average price for a property for sale in Derby And Thornley?
The average price for a property for sale in Derby And Thornley is £209,915. This amount is 6% lower than the average price in Preston. There are 1,519 property listings for sale in Derby And Thornley.
What streets have the most expensive properties for sale in Derby And Thornley?
The streets with the most expensive properties for sale in Derby And Thornley are Forty Acre Lane at an average of £1,163,500, Four Acre Lane at an average of £631,500 and Chipping Road at an average of £439,250.
What streets have the most affordable properties for sale in Derby And Thornley?
The streets with the most affordable properties for sale in Derby And Thornley are Victoria Street at an average of £114,316, Lune Street at an average of £123,025 and Mersey Street at an average of £126,863.
Which train stations are available in or near Derby And Thornley?
Some of the train stations available in or near Derby And Thornley are Ramsgreave and Wilpshire, Langho and Preston.
Property Price Paid in Derby And Thornley by Year
The average sold property price by year was:
| Year | Average Sold Price | Price Change |
Sold Properties
|
|---|---|---|---|
| 2025 | £271,035 | 32% |
39 Properties |
| 2024 | £184,125 | -2% |
54 Properties |
| 2023 | £187,893 | -15% |
45 Properties |
| 2022 | £216,662 | 17% |
47 Properties |
| 2021 | £179,011 | -9% |
68 Properties |
| 2020 | £196,001 | 29% |
43 Properties |
| 2019 | £139,074 | -26% |
32 Properties |
| 2018 | £174,540 | -1% |
51 Properties |
| 2017 | £175,962 | 11% |
61 Properties |
| 2016 | £155,905 | -0,3% |
46 Properties |
| 2015 | £156,354 | -2% |
43 Properties |
| 2014 | £159,786 | 14% |
34 Properties |
| 2013 | £137,415 | 1% |
51 Properties |
| 2012 | £135,670 | -16% |
46 Properties |
| 2011 | £157,586 | 8% |
43 Properties |
| 2010 | £144,901 | -10% |
45 Properties |
| 2009 | £159,097 | 5% |
36 Properties |
| 2008 | £151,797 | -4% |
42 Properties |
| 2007 | £157,850 | 8% |
60 Properties |
| 2006 | £145,004 | -10% |
86 Properties |
| 2005 | £158,947 | 23% |
64 Properties |
| 2004 | £123,155 | 16% |
69 Properties |
| 2003 | £103,352 | 30% |
90 Properties |
| 2002 | £72,165 | 0,3% |
95 Properties |
| 2001 | £71,982 | 14% |
68 Properties |
| 2000 | £61,846 | -11% |
72 Properties |
| 1999 | £68,874 | 30% |
58 Properties |
| 1998 | £47,956 | -2% |
63 Properties |
| 1997 | £49,001 | -8% |
61 Properties |
| 1996 | £52,746 | 1% |
52 Properties |
| 1995 | £52,188 | - |
57 Properties |
Property Price per Property Type in Derby And Thornley
Here you can find historic sold price data in order to help with your property search.
The average Property Paid Price for specific property types in the last three years are:
| Property Type | Average Sold Price | Sold Properties |
|---|---|---|
| Semi Detached House | £225,666.00 | 42 Semi Detached Houses |
| Detached House | £467,830.00 | 15 Detached Houses |
| Terraced House | £153,986.00 | 81 Terraced Houses |

