
Houses for sale in PR3 3RT, Fleming Square, Dilworth, Preston
House Prices in PR3 3RT, Fleming Square, Dilworth
Properties in PR3 3RT have no sales history available within the last 3 years. PR3 3RT is a postcode in Fleming Square located in Dilworth, an area in Preston, Lancashire, with 4 households².
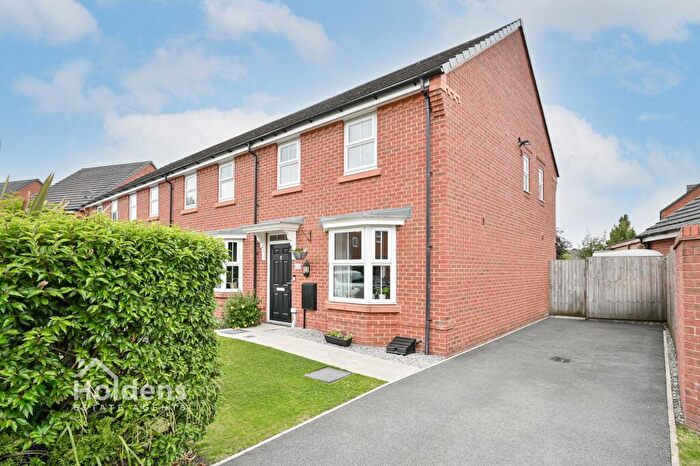
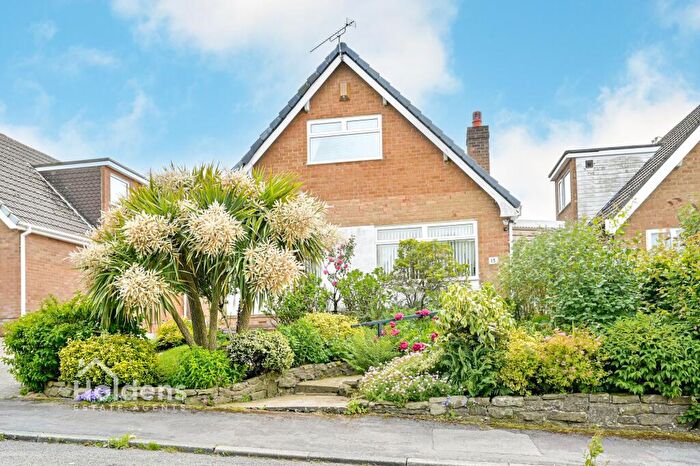
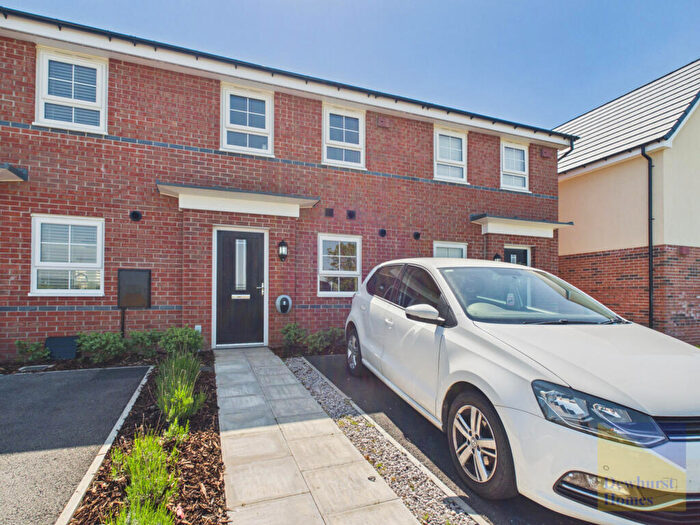
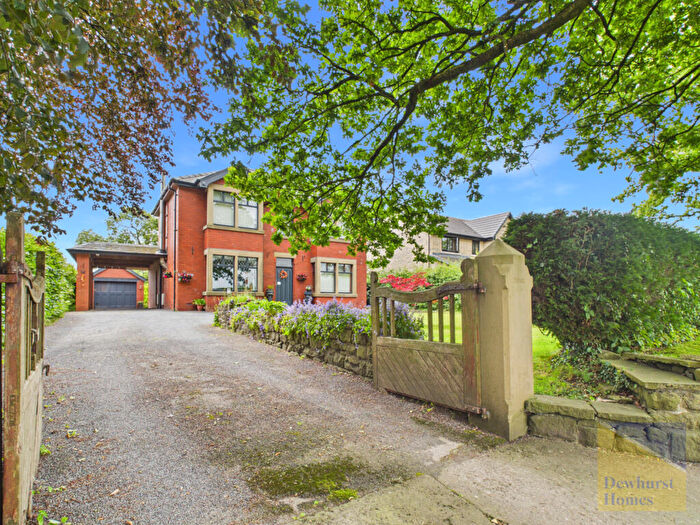
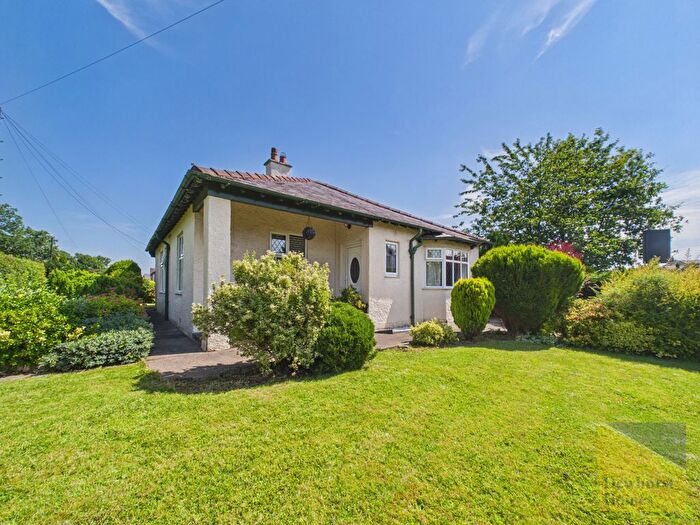
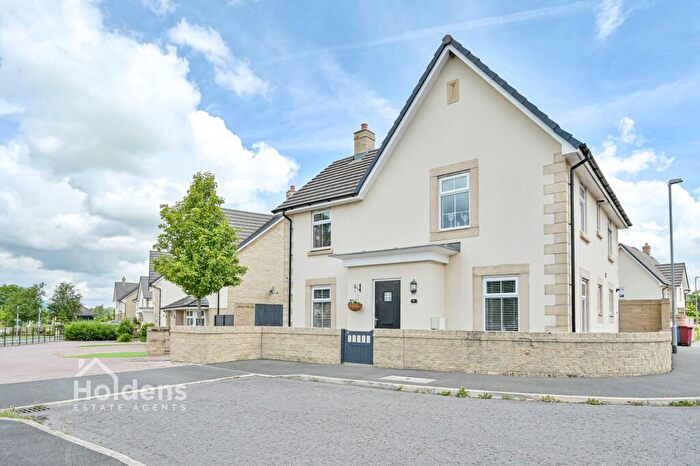
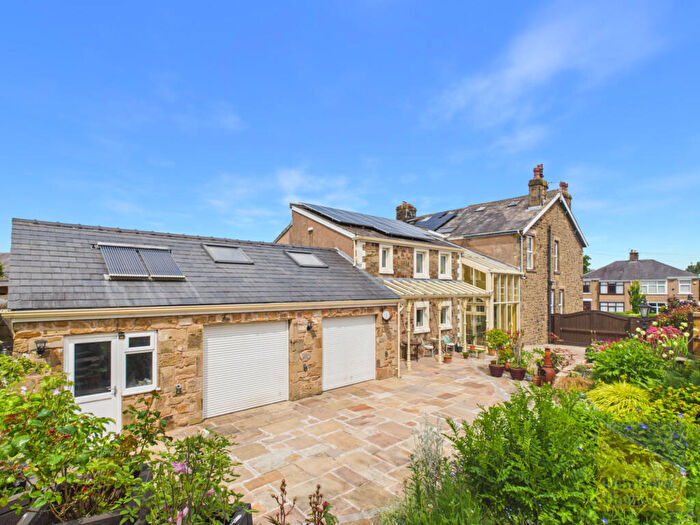
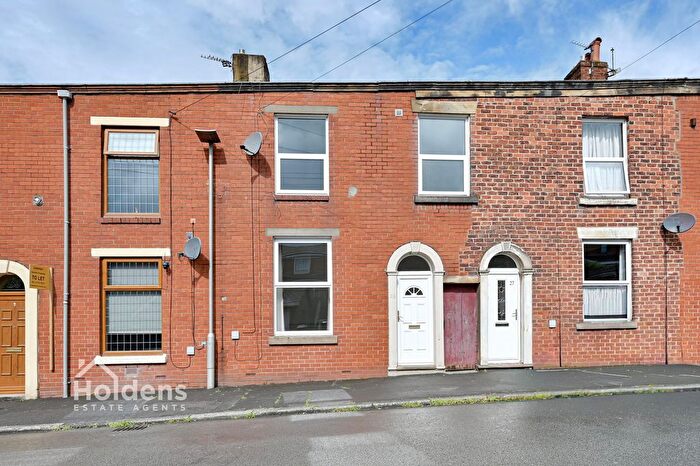
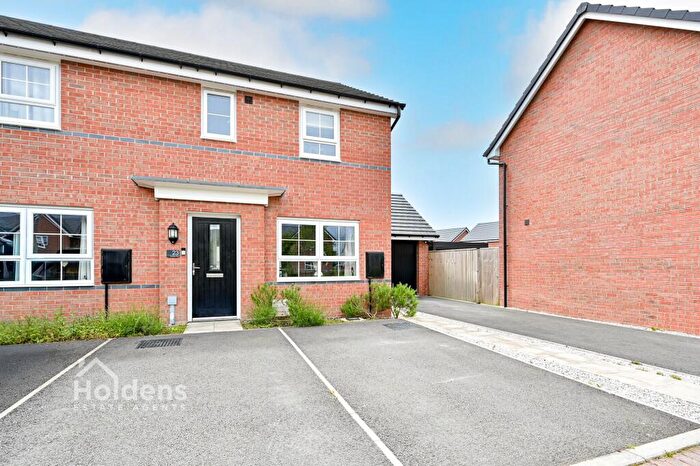
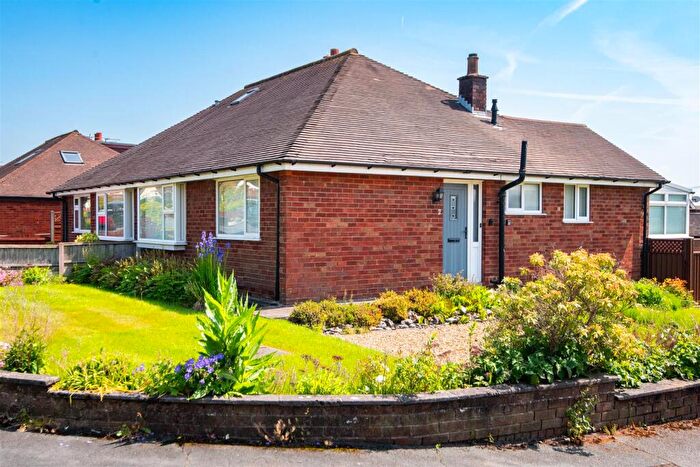
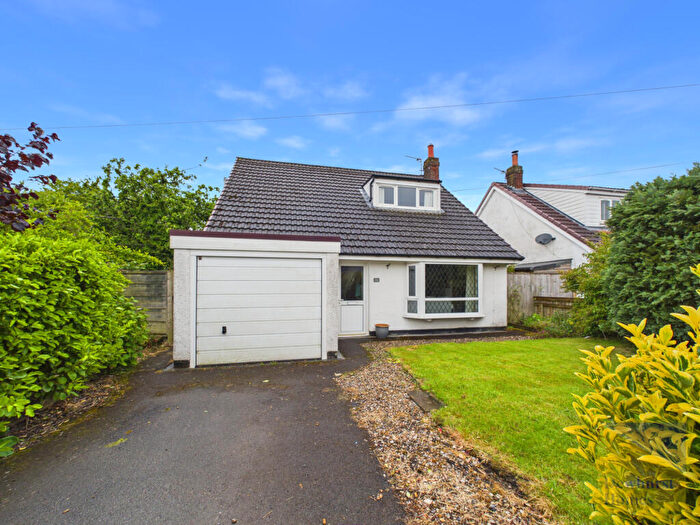
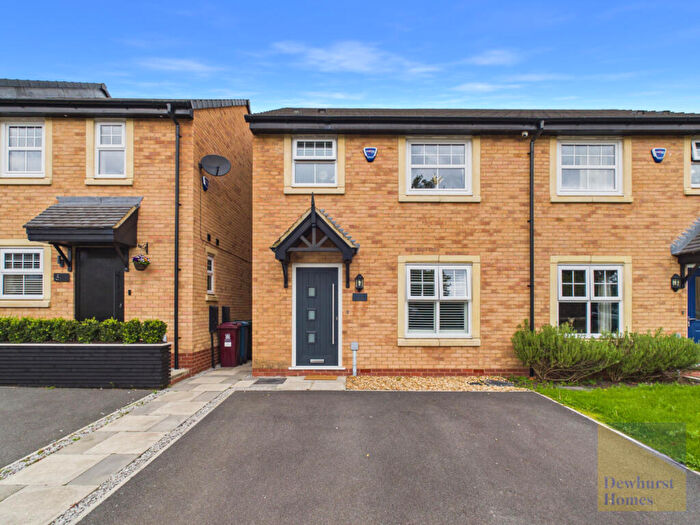
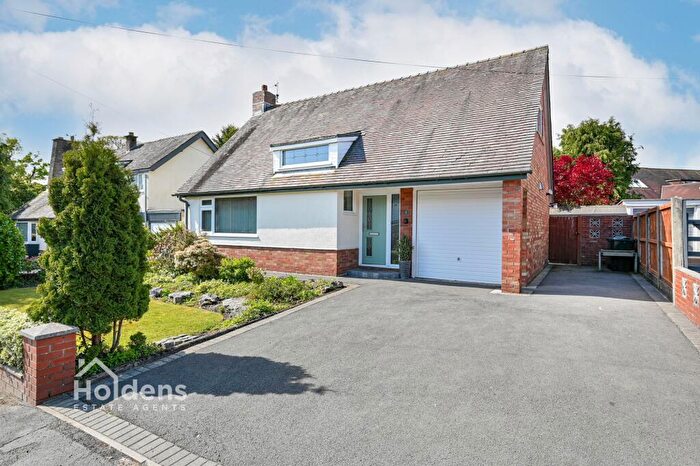
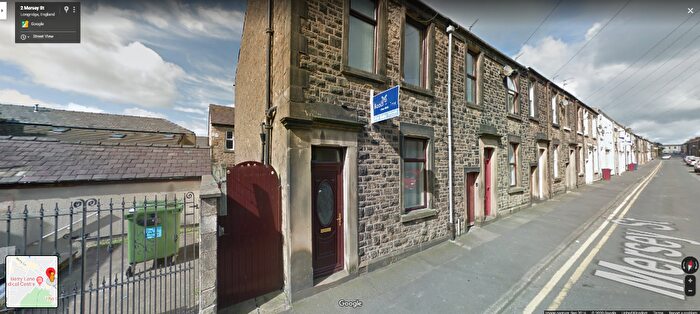
Properties for sale near PR3 3RT, Fleming Square


![]()
If you are looking to sell your house, let it out, or receive a property valuation, an expert can help you.
Click the button below to get started.
Price Paid in Fleming Square, PR3 3RT, Dilworth
1 Fleming Square, PR3 3RT, Dilworth Preston
Property 1 has been sold 4 times. The last time it was sold was in 13/06/2025 and the sold price was £147,500.00.
This other property, sold as a freehold on 13/06/2025, is a 65 sqm end-terrace house with an EPC rating of D.
| Date | Price | Property Type | Tenure | Classification |
|---|---|---|---|---|
| 13/06/2025 | £147,500.00 | Other Property | freehold | Established Building |
| 30/09/2021 | £160,100.00 | Terraced House | freehold | Established Building |
| 31/10/2003 | £100,000.00 | Terraced House | freehold | Established Building |
| 12/04/2002 | £50,000.00 | Terraced House | freehold | Established Building |
3 Fleming Square, PR3 3RT, Dilworth Preston
Property 3 has been sold 2 times. The last time it was sold was in 15/07/2022 and the sold price was £125,000.00.
This terraced house, sold as a freehold on 15/07/2022, is a 57 sqm mid-terrace house with an EPC rating of D.
| Date | Price | Property Type | Tenure | Classification |
|---|---|---|---|---|
| 15/07/2022 | £125,000.00 | Terraced House | freehold | Established Building |
| 31/01/1996 | £38,500.00 | Terraced House | freehold | Established Building |
2 Fleming Square, PR3 3RT, Dilworth Preston
Property 2 has been sold 4 times. The last time it was sold was in 24/03/2016 and the sold price was £98,500.00.
This terraced house, sold as a freehold on 24/03/2016, is a 38 sqm mid-terrace house with an EPC rating of C.
| Date | Price | Property Type | Tenure | Classification |
|---|---|---|---|---|
| 24/03/2016 | £98,500.00 | Terraced House | freehold | Established Building |
| 29/01/2010 | £83,500.00 | Terraced House | freehold | Established Building |
| 06/12/2002 | £60,000.00 | Terraced House | freehold | Established Building |
| 16/11/2001 | £51,000.00 | Terraced House | freehold | Established Building |
4 Fleming Square, PR3 3RT, Dilworth Preston
Property 4 has been sold 4 times. The last time it was sold was in 15/08/2007 and the sold price was £160,000.00.
This terraced house, sold as a freehold on 15/08/2007, is a 93 sqm mid-terrace house with an EPC rating of D.
| Date | Price | Property Type | Tenure | Classification |
|---|---|---|---|---|
| 15/08/2007 | £160,000.00 | Terraced House | freehold | Established Building |
| 12/04/2007 | £132,500.00 | Terraced House | freehold | Established Building |
| 28/10/2002 | £66,000.00 | Terraced House | freehold | Established Building |
| 08/02/1996 | £46,000.00 | Terraced House | freehold | Established Building |
6 Fleming Square, PR3 3RT, Dilworth Preston
Property 6 has been sold 2 times. The last time it was sold was in 27/03/2001 and the sold price was £95,000.00.
This detached house, sold as a freehold on 27/03/2001, is a 76 sqm detached house with an EPC rating of E.
| Date | Price | Property Type | Tenure | Classification |
|---|---|---|---|---|
| 27/03/2001 | £95,000.00 | Detached House | freehold | Established Building |
| 25/09/1997 | £83,000.00 | Detached House | freehold | Established Building |
Property price trends in PR3 3RT, Fleming Square
According to the latest Land Registry data, the average home in PR3 3RT, Fleming Square sold for £125,000 in 2022. That figure comes from 15 sales logged over the past 26 years.
Looking back five years, average prices are up about 26.9% since 2016, a gain of around £26,500 in cash terms.
Zoom out to the past decade for the fuller picture. Back in 2010, homes here averaged £83,500, so the typical sold price has climbed about 49.7% since then, roughly 3.4% a year. Stretch the view to fifteen years and that annual pace eases back to about -1%.
Property Price Paid in PR3 3RT, Fleming Square by Year
The average sold property price by year was:
| Year | Average Sold Price | Price Change |
Sold Properties
|
|---|---|---|---|
| 2022 | £125,000 | -28% |
1 Property |
| 2021 | £160,100 | 38% |
1 Property |
| 2016 | £98,500 | 15% |
1 Property |
| 2010 | £83,500 | -75% |
1 Property |
| 2007 | £146,250 | 32% |
2 Properties |
| 2003 | £100,000 | 41% |
1 Property |
| 2002 | £58,666 | -24% |
3 Properties |
| 2001 | £73,000 | -14% |
2 Properties |
| 1997 | £83,000 | 49% |
1 Property |
| 1996 | £42,250 | - |
2 Properties |
