
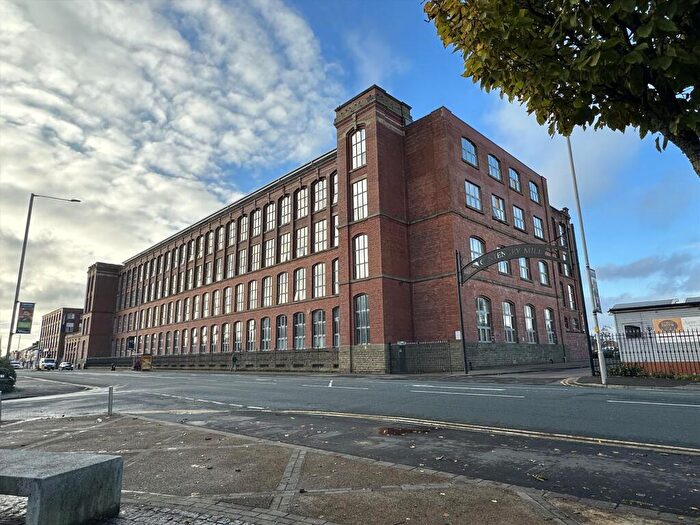
Houses for sale in Fishwick, Preston
House Prices in Fishwick
Properties in Fishwick have an average house price of £104k and had 172 Property Transactions within the last 3 years¹.
Fishwick is an area in Preston, Lancashire with 2,119 households², where the most expensive property was sold for £239k.
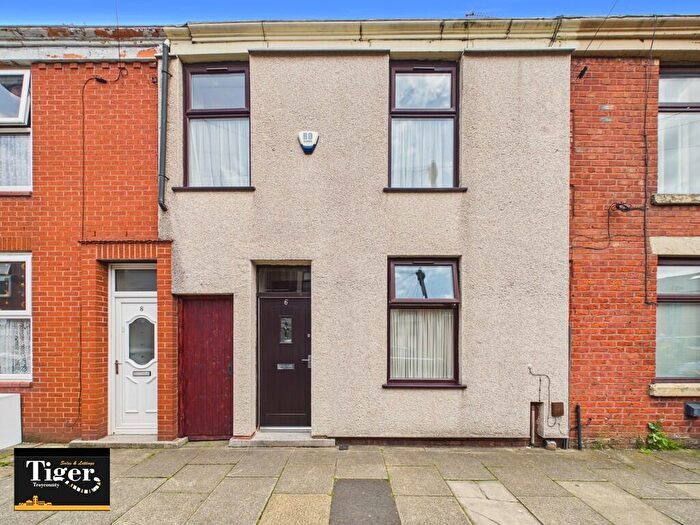
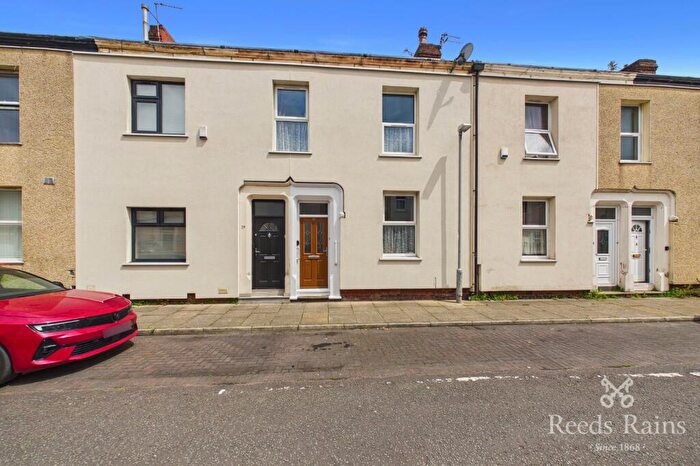
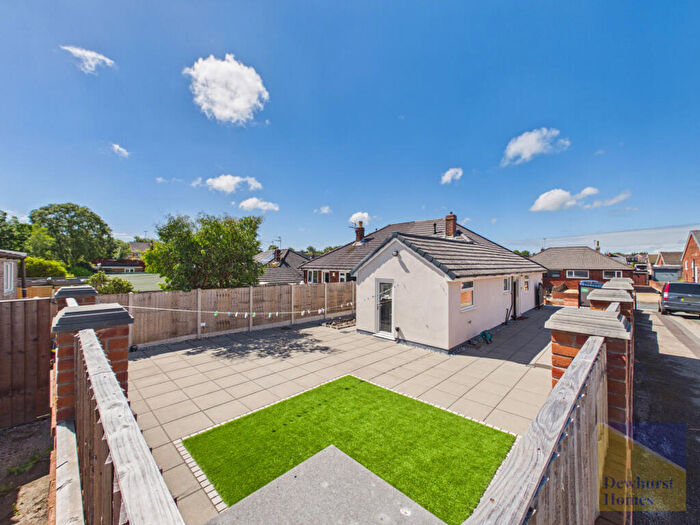
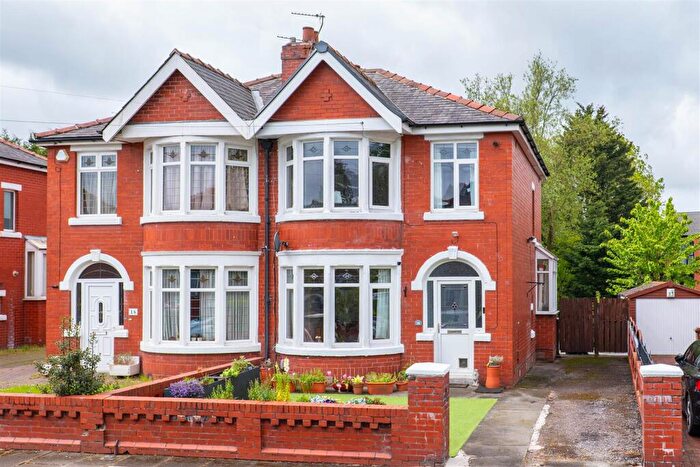
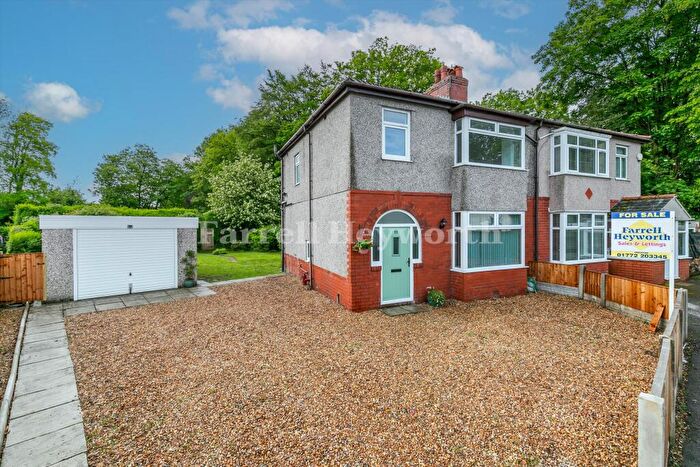
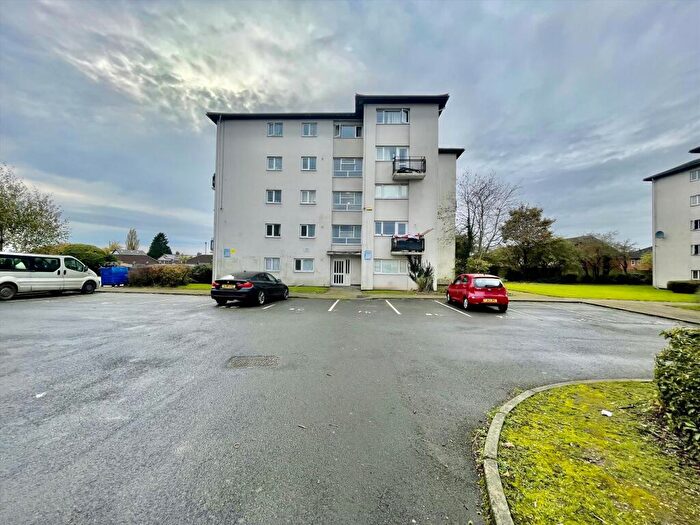
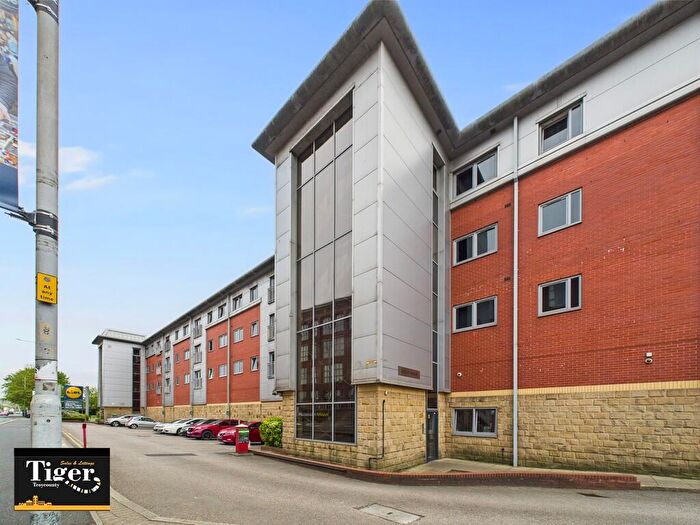
Properties for sale in Fishwick
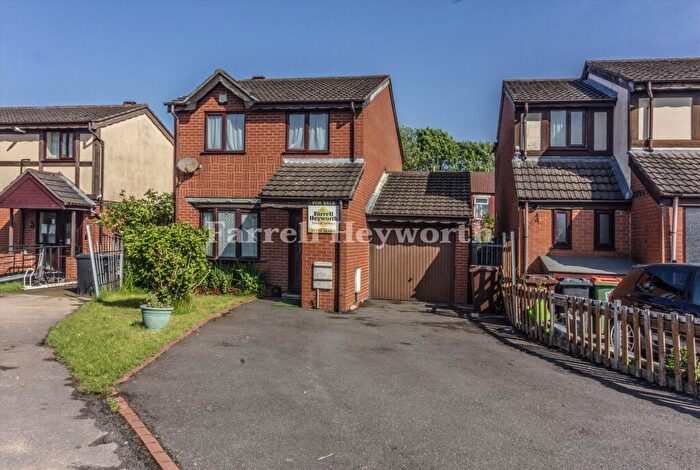
![]()
If you are looking to sell your house, let it out, or receive a property valuation, an expert can help you.
Click the button below to get started.
Roads and Postcodes in Fishwick
Navigate through our locations to find the location of your next house in Fishwick, Preston for sale or to rent.
| Streets | Postcodes |
|---|---|
| Annis Street | PR1 4XU |
| Arnhem Road | PR1 4QL PR1 4QN |
| Beaconsfield Avenue | PR1 4UH |
| Beenland Street | PR1 4TN |
| Bidston Street | PR1 4RP |
| Braddon Street | PR1 4TP |
| Brockholes View | PR1 4XJ |
| Butterlands | PR1 5TJ |
| Cairnsmore Avenue | PR1 4UN |
| Callon Street | PR1 4QP PR1 4QQ PR1 4QR |
| Cave Street | PR1 4SP |
| Cavendish Road | PR1 4TY |
| Chatsworth Street | PR1 4XY |
| Church Avenue | PR1 4UD |
| Cliffe Court | PR1 4QB |
| Crawford Avenue | PR1 4UP |
| Cromford Walk | PR1 4YR |
| Crowle Street | PR1 4TL |
| Devonshire Place | PR1 4UE |
| Downing Street | PR1 4RE PR1 4RH PR1 4RJ |
| Dundonald Street | PR1 4SN |
| Elijah Street | PR1 4SR |
| Fishwick Bottoms | PR2 5AU |
| Fishwick Parade | PR1 4QD PR1 4QE PR1 4QH PR1 4QJ PR1 4XQ PR1 4XR |
| Fishwick Road | PR1 4XD |
| Fishwick View | PR1 4QS PR1 4YA PR1 4YB |
| Gaythorne Avenue | PR1 5SY PR1 5TA |
| Glenluce Drive | PR1 5TB PR1 5TD PR1 5TE |
| Great Townley Street | PR1 4SJ PR1 4SL |
| Hawarden Road | PR1 4TS |
| Iddesleigh Road | PR1 4UA |
| John William Street | PR1 4XE |
| Knowles Street | PR1 4TH |
| Leek Street | PR1 4RL |
| Lex Street | PR1 4XL |
| Manning Road | PR1 4UB |
| Mercer Street | PR1 4LQ |
| Merrick Avenue | PR1 5TL |
| Mete Street | PR1 4TJ |
| Mornington Road | PR1 4UL |
| Nevett Street | PR1 4RA PR1 4RB PR1 4RD |
| New Hall Lane | PR1 4DP PR1 4DT PR1 4DX PR1 4SS PR1 4ST PR1 4SU PR1 4SX PR1 4TA PR1 4TB PR1 4TD PR1 4TE |
| Newton Avenue | PR1 5TN |
| Nimes Street | PR1 4SH |
| Pinfold Street | PR1 4RT |
| Redmayne Street | PR1 4SQ |
| Russell Avenue | PR1 5TP |
| Rutland Street | PR1 4XT |
| Samuel Street | PR1 4YD PR1 4YE PR1 4YH PR1 4YJ PR1 4YL |
| Scotforth Road | PR1 4XX |
| St Marys Close | PR1 4XN |
| Surrey Street | PR1 4XS |
| Tamar Street | PR1 4QX |
| Tudor Avenue | PR1 5TH |
| Waldon Street | PR1 4RQ PR1 4RR |
| Walton View | PR1 4QU |
| William Henry Street | PR1 4XH |
Property price trends in Fishwick
According to the latest Land Registry data, the average home in Fishwick sold for £73,000 in 2026. That figure comes from 2,241 sales logged over the past 31 years.
Prices have fallen back over the last three years. Compared with 2023, when the typical sale came in around £94,847, that's a fall of roughly 23%.
Looking back five years, average prices are down about 32.4% since 2021, a drop of around £34,933 in cash terms.
Zoom out to the past decade for the fuller picture. Back in 2016, homes here averaged £76,963, so the typical sold price has fallen about 5.1% since then, around 0.5% a year lower. Stretch the view to fifteen years and that annual pace edges up closer to 0.2%.
Frequently asked questions about Fishwick
What is the average price for a property for sale in Fishwick?
The average price for a property for sale in Fishwick is £103,840. This amount is 54% lower than the average price in Preston. There are 807 property listings for sale in Fishwick.
What streets have the most expensive properties for sale in Fishwick?
The streets with the most expensive properties for sale in Fishwick are Tudor Avenue at an average of £199,650, Merrick Avenue at an average of £191,216 and Gaythorne Avenue at an average of £190,083.
What streets have the most affordable properties for sale in Fishwick?
The streets with the most affordable properties for sale in Fishwick are Rutland Street at an average of £45,000, Samuel Street at an average of £45,380 and Mercer Street at an average of £68,625.
Which train stations are available in or near Fishwick?
Some of the train stations available in or near Fishwick are Preston, Bamber Bridge and Lostock Hall.
Property Price Paid in Fishwick by Year
The average sold property price by year was:
| Year | Average Sold Price | Price Change |
Sold Properties
|
|---|---|---|---|
| 2026 | £73,000 | -56% |
1 Property |
| 2025 | £113,600 | 7% |
48 Properties |
| 2024 | £105,293 | 10% |
64 Properties |
| 2023 | £94,847 | -15% |
59 Properties |
| 2022 | £109,297 | 1% |
80 Properties |
| 2021 | £107,933 | 23% |
70 Properties |
| 2020 | £83,414 | -13% |
57 Properties |
| 2019 | £94,188 | 2% |
58 Properties |
| 2018 | £92,150 | -9% |
60 Properties |
| 2017 | £100,293 | 23% |
52 Properties |
Property Price per Property Type in Fishwick
Here you can find historic sold price data in order to help with your property search.
The average Property Paid Price for specific property types in the last three years are:
| Property Type | Average Sold Price | Sold Properties |
|---|---|---|
| Semi Detached House | £163,326.00 | 47 Semi Detached Houses |
| Terraced House | £96,544.00 | 81 Terraced Houses |
| Flat | £50,329.00 | 43 Flats |
| Detached House | £200,000.00 | 1 Detached House |
