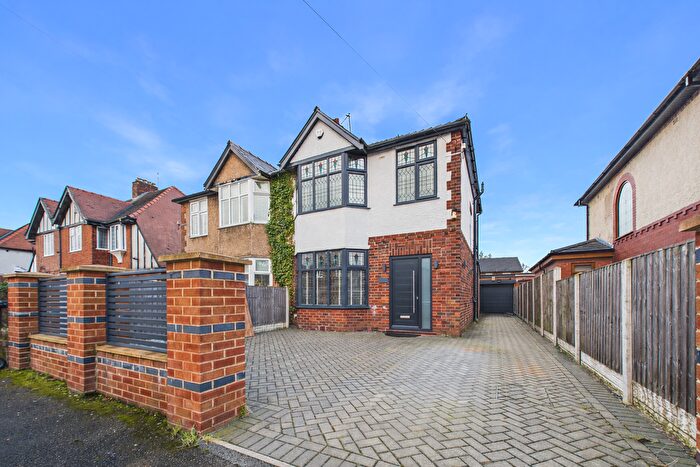
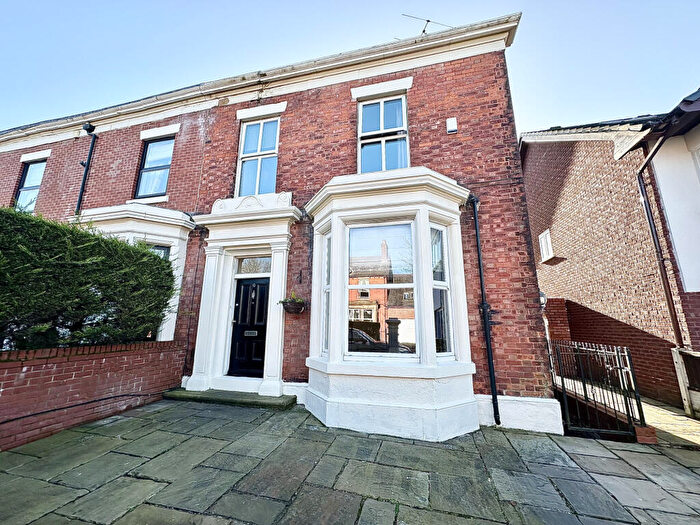
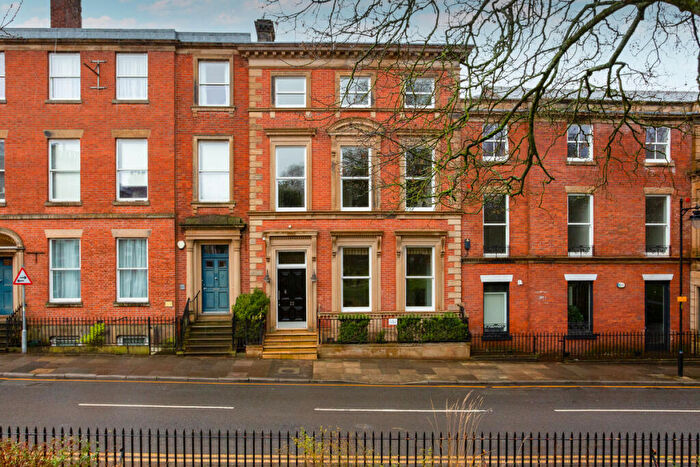
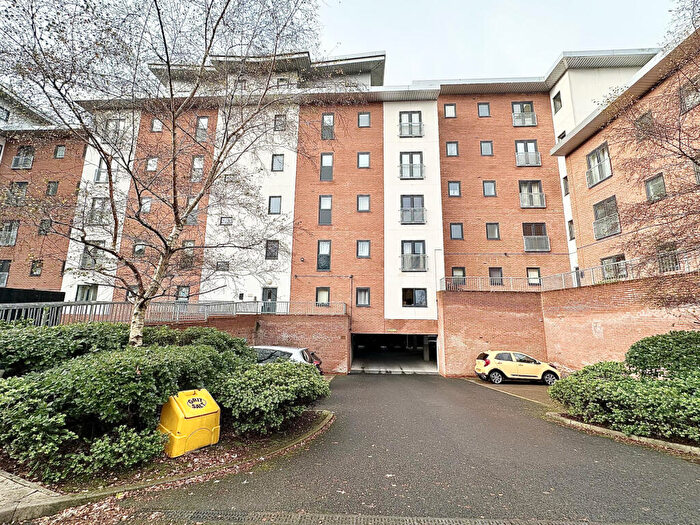
Houses for sale & to rent in St Georges, Preston
House Prices in St Georges
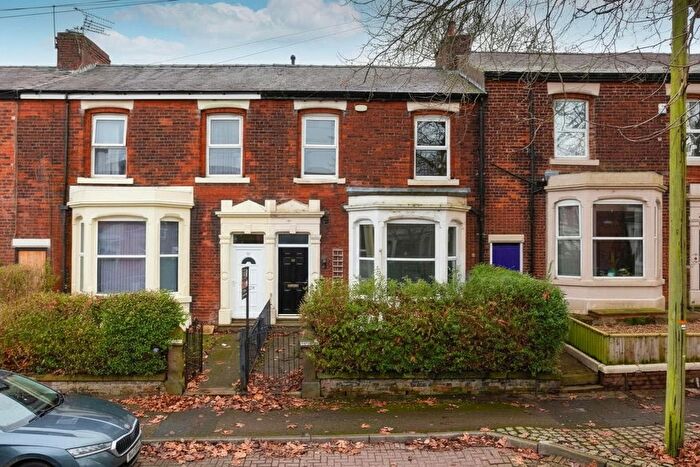
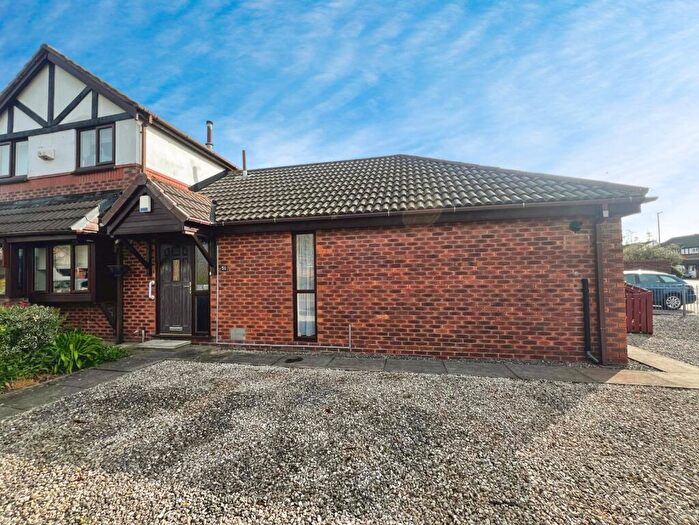
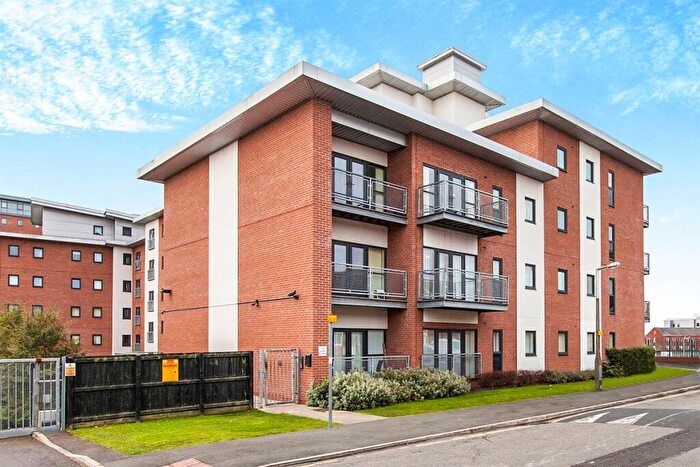
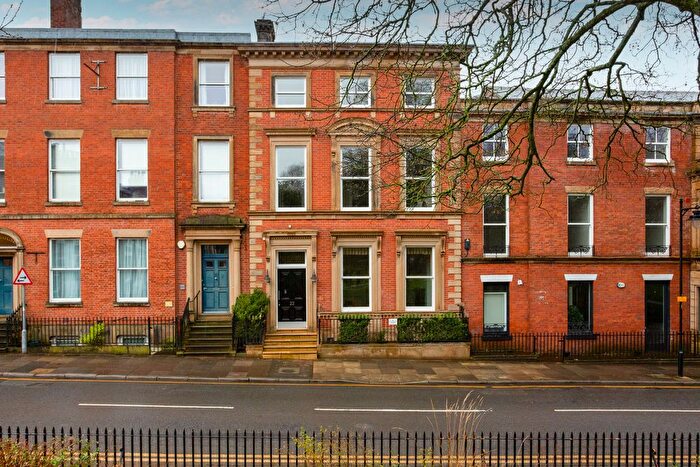
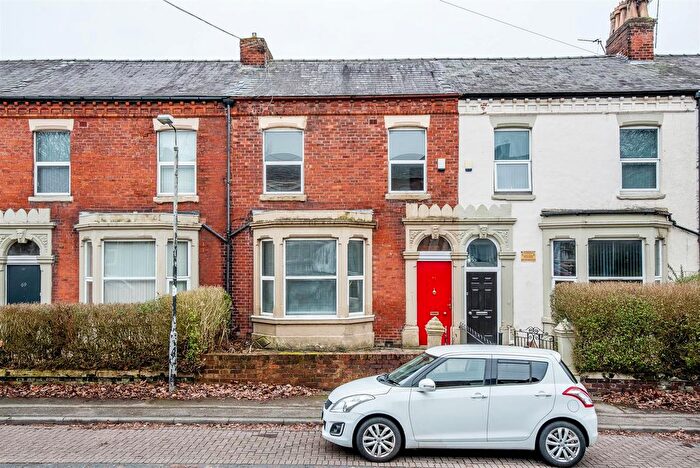
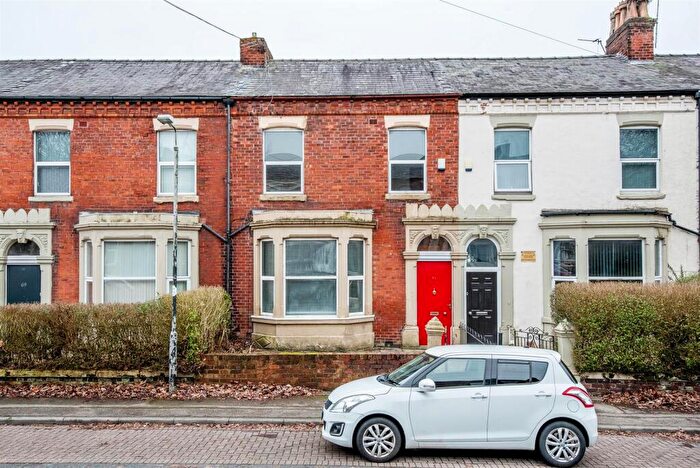
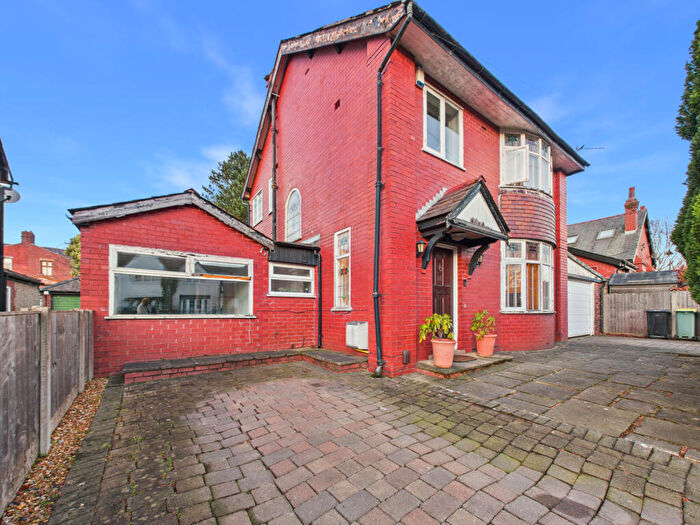
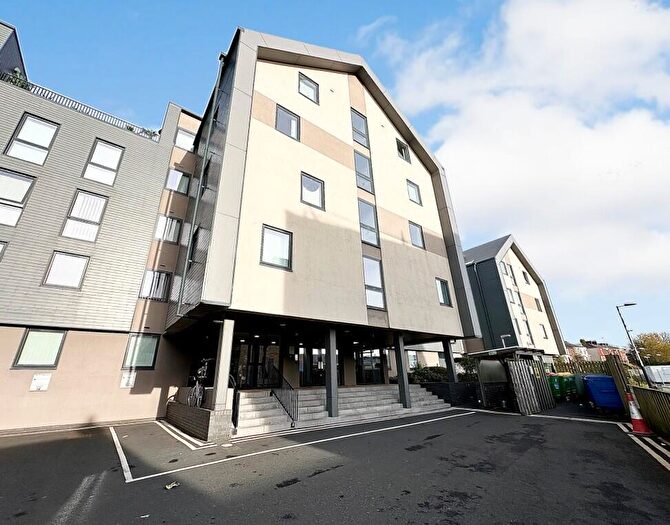
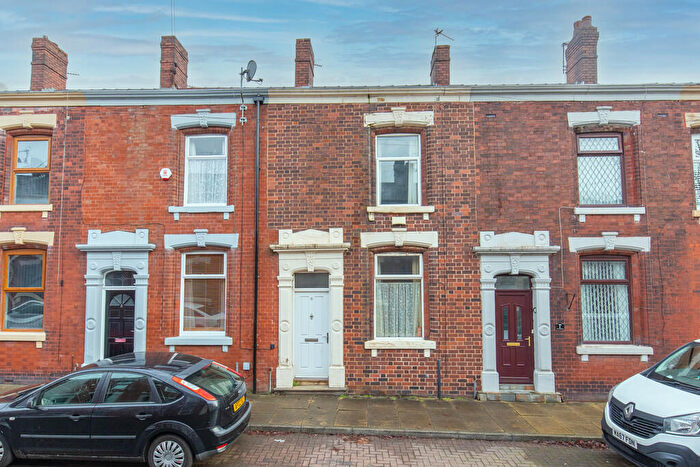
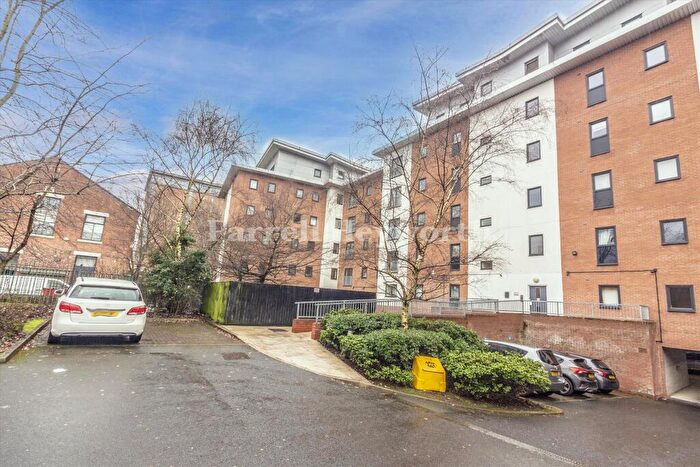
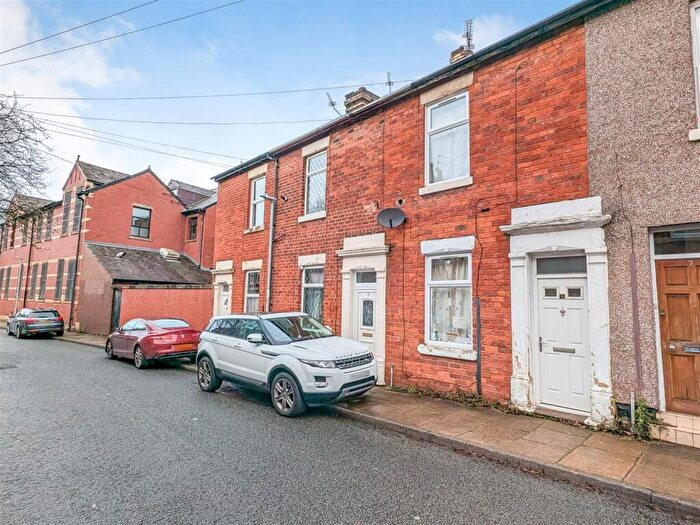
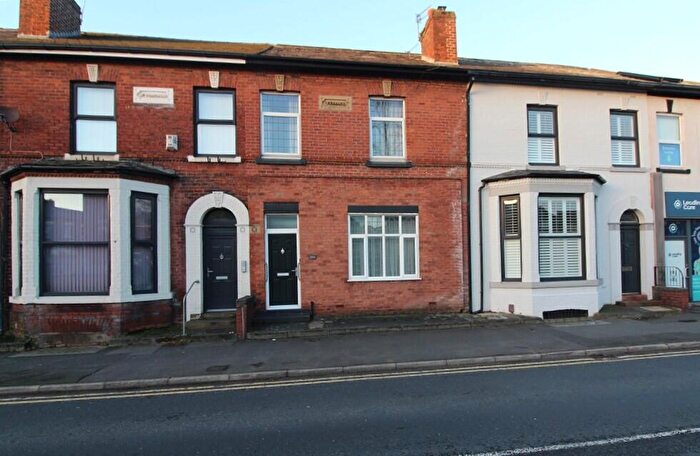
Properties in St Georges have an average house price of £113,280.00 and had 110 Property Transactions within the last 3 years¹.
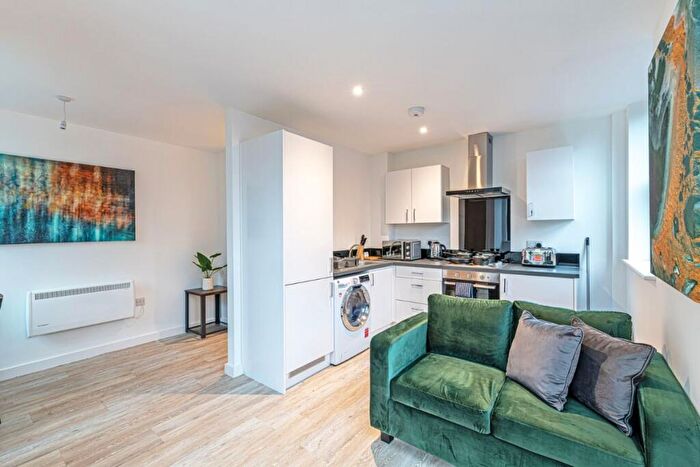
St Georges is an area in Preston, Lancashire with 1,913 households², where the most expensive property was sold for £292,000.00.
Properties for sale in St Georges
Roads and Postcodes in St Georges
Navigate through our locations to find the location of your next house in St Georges, Preston for sale or to rent.
| Streets | Postcodes |
|---|---|
| Adelphi Street | PR1 7BE |
| Appleby Street | PR1 1HX |
| Aqueduct Street | PR1 7RE |
| Aughton Walk | PR1 1YB |
| Beckett Court | PR1 1YD |
| Charnock Street | PR1 6DR |
| Craggs Row | PR1 1JB PR1 1JD PR1 1JG PR1 1JZ |
| Cromwell Street | PR1 1QU |
| Crown Street | PR1 2RU |
| Dawson Walk | PR1 1NH PR1 1NJ |
| Deepdale Road | PR1 5AP PR1 6LL |
| Driscoll Street | PR1 1UP |
| East Street | PR1 1UU |
| East View | PR1 5AS |
| Egan Street | PR1 1XE |
| Elcho Street | PR1 6BA PR1 6BB |
| Elgin Street | PR1 6BH PR1 6BJ |
| Elizabeth Street | PR1 2RX |
| Essex Street | PR1 1QE |
| Holstein Street | PR1 1UN |
| Hopwood Street | PR1 1UY |
| Kent Street | PR1 1PE PR1 1PH |
| Lancaster Road North | PR1 2SQ |
| Leicester Road | PR1 1PP |
| Meadow Street | PR1 1TR PR1 1TS |
| Milner Street | PR1 6BN PR1 6BP |
| Moor Lane | PR1 1JP PR1 1JQ PR1 1JR PR1 7AT |
| Newton Street | PR1 1XP |
| Pump Street | PR1 1XB |
| Rye Street | PR1 1PN |
| Sedgwick Street | PR1 1TP |
| Shaw Street | PR1 1UB |
| South Meadow Street | PR1 1UX |
| St Andrews Road | PR1 6NE PR1 6NH |
| St Annes Street | PR1 6DS |
| St Anthonys Road | PR1 6LQ PR1 6LR |
| St Barnabas Place | PR1 1QJ |
| St Christophers Road | PR1 6NJ PR1 6NL |
| St Cuthberts Road | PR1 6LS PR1 6LT |
| St Davids Road | PR1 6NB PR1 6ND |
| St Georges Road | PR1 1PR PR1 1PS PR1 6NQ PR1 6NR |
| St Ignatius Place | PR1 1TU |
| St Ignatius Square | PR1 1TT |
| St Martins Road | PR1 6LU PR1 6LX |
| St Michaels Road | PR1 6LY PR1 6NA |
| St Pauls Avenue | PR1 1QH |
| St Pauls Road | PR1 1PX PR1 6NS |
| St Pauls Square | PR1 1XA |
| St Peters Street | PR1 7BS |
| St Philips Road | PR1 6NN PR1 6NP |
| St Stephens Road | PR1 6NT PR1 6NU PR1 6NX |
| St Thomas Road | PR1 6AY PR1 6LN PR1 6LP |
| St Thomas Street | PR1 1JU |
| Stanleyfield Road | PR1 1QL |
| Turner Street | PR1 1TN |
| Varley Street | PR1 1PT |
Transport near St Georges
- FAQ
- Price Paid By Year
- Property Type Price
Frequently asked questions about St Georges
What is the average price for a property for sale in St Georges?
The average price for a property for sale in St Georges is £113,280. This amount is 49% lower than the average price in Preston. There are 1,503 property listings for sale in St Georges.
What streets have the most expensive properties for sale in St Georges?
The streets with the most expensive properties for sale in St Georges are St Thomas Road at an average of £167,666, St Pauls Road at an average of £157,166 and Meadow Street at an average of £139,166.
What streets have the most affordable properties for sale in St Georges?
The streets with the most affordable properties for sale in St Georges are Beckett Court at an average of £59,000, Rye Street at an average of £75,000 and Elcho Street at an average of £83,125.
Which train stations are available in or near St Georges?
Some of the train stations available in or near St Georges are Preston, Lostock Hall and Bamber Bridge.
Property Price Paid in St Georges by Year
The average sold property price by year was:
| Year | Average Sold Price | Price Change |
Sold Properties
|
|---|---|---|---|
| 2025 | £113,888 | 8% |
27 Properties |
| 2024 | £104,319 | -15% |
36 Properties |
| 2023 | £119,794 | 17% |
47 Properties |
| 2022 | £99,142 | -3% |
48 Properties |
| 2021 | £101,751 | 4% |
55 Properties |
| 2020 | £97,258 | 4% |
29 Properties |
| 2019 | £93,163 | 14% |
36 Properties |
| 2018 | £80,389 | -1% |
28 Properties |
| 2017 | £80,855 | -3% |
49 Properties |
| 2016 | £83,172 | -0,1% |
41 Properties |
| 2015 | £83,279 | 6% |
55 Properties |
| 2014 | £78,547 | 1% |
56 Properties |
| 2013 | £78,052 | -2% |
37 Properties |
| 2012 | £79,638 | -8% |
52 Properties |
| 2011 | £86,276 | -1% |
42 Properties |
| 2010 | £87,310 | 6% |
41 Properties |
| 2009 | £81,961 | -22% |
44 Properties |
| 2008 | £100,211 | -10% |
46 Properties |
| 2007 | £110,593 | 12% |
155 Properties |
| 2006 | £97,527 | 17% |
125 Properties |
| 2005 | £80,904 | 14% |
94 Properties |
| 2004 | £69,745 | 23% |
102 Properties |
| 2003 | £53,393 | 25% |
132 Properties |
| 2002 | £40,264 | 15% |
133 Properties |
| 2001 | £34,109 | 16% |
98 Properties |
| 2000 | £28,634 | -11% |
75 Properties |
| 1999 | £31,786 | 0,4% |
71 Properties |
| 1998 | £31,666 | -3% |
77 Properties |
| 1997 | £32,714 | 11% |
80 Properties |
| 1996 | £29,109 | -5% |
67 Properties |
| 1995 | £30,566 | - |
71 Properties |
Property Price per Property Type in St Georges
Here you can find historic sold price data in order to help with your property search.
The average Property Paid Price for specific property types in the last three years are:
| Property Type | Average Sold Price | Sold Properties |
|---|---|---|
| Semi Detached House | £145,687.00 | 4 Semi Detached Houses |
| Terraced House | £112,436.00 | 101 Terraced Houses |
| Flat | £104,400.00 | 5 Flats |

