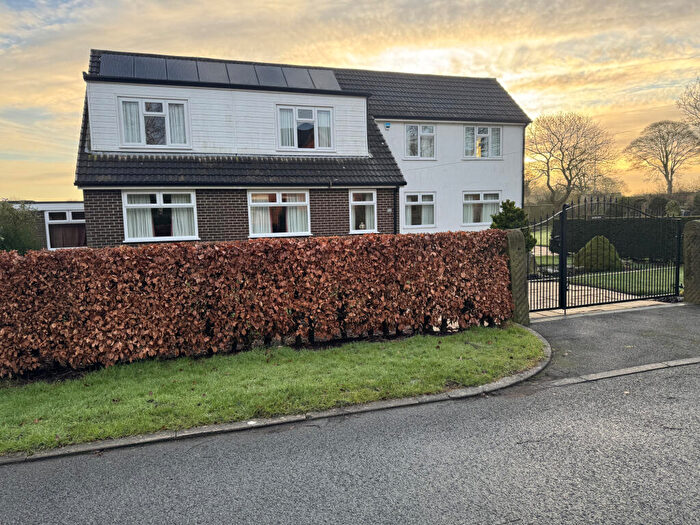
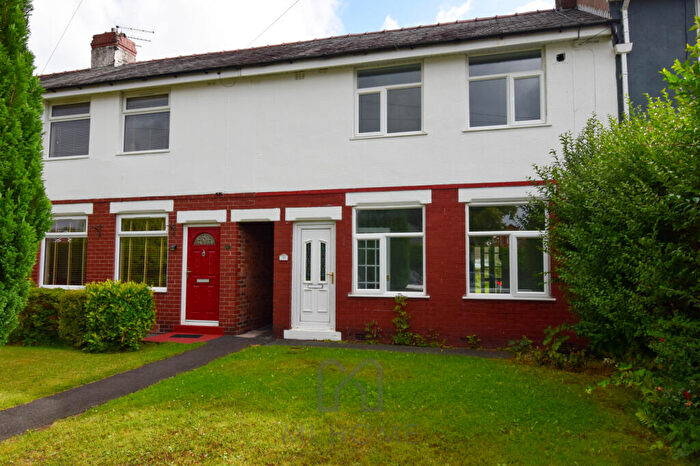
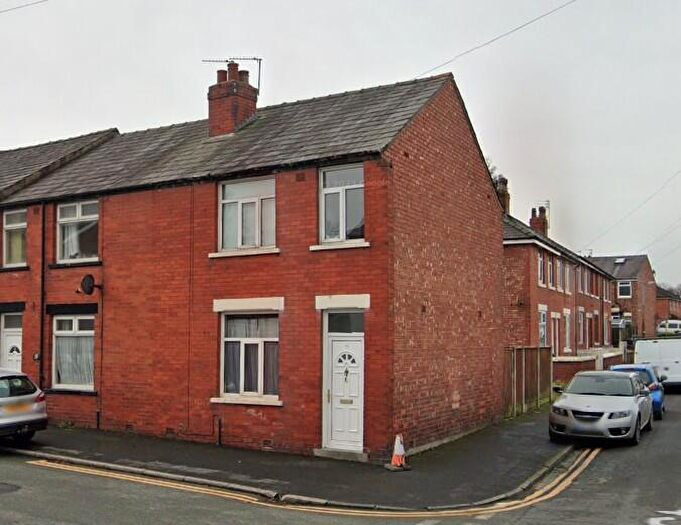
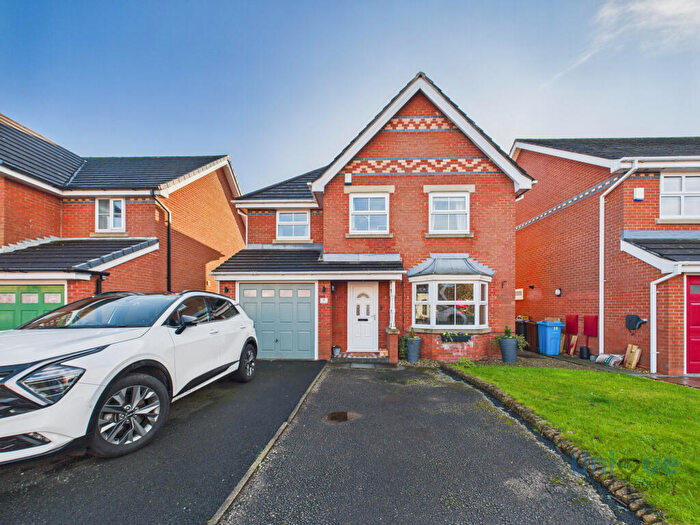
Houses for sale & to rent in Kirkham South, Preston
House Prices in Kirkham South
Properties in Kirkham South have an average house price of £170,412.00 and had 107 Property Transactions within the last 3 years¹.
Kirkham South is an area in Preston, Lancashire with 1,208 households², where the most expensive property was sold for £507,000.00.
Properties for sale in Kirkham South
Roads and Postcodes in Kirkham South
Navigate through our locations to find the location of your next house in Kirkham South, Preston for sale or to rent.
| Streets | Postcodes |
|---|---|
| Amounderness Court | PR4 2US |
| Ash Avenue | PR4 2UH |
| Balshaw Terrace | PR4 2TD |
| Beech Avenue | PR4 2UE |
| Bryning Fern Lane | PR4 2BQ PR4 2RB |
| Carr Road | PR4 2SX |
| Carrwood Drive | PR4 2YQ |
| Cedar Crescent | PR4 2TY |
| Chapel Walks | PR4 2TA |
| Chestnut Close | PR4 2UP |
| Clegg Street | PR4 2TL |
| Croft Gardens | PR4 2TP |
| Dowbridge Way | PR4 2YP |
| Freckleton Road | PR4 2RN PR4 2RP PR4 3RB |
| Freckleton Street | PR4 2SB PR4 2SH PR4 2SN PR4 2SP PR4 2SQ PR4 2SR |
| Fylde Street | PR4 2DD PR4 2DE |
| Garden Street | PR4 2TU |
| Gleneagles Court | PR4 2UY |
| Greenacres Avenue | PR4 2TX |
| Hornby Court | PR4 2UQ |
| Houghtons Court | PR4 2TN |
| Kirkgate | PR4 2UJ |
| Kirkham Trading Park | PR4 3AB |
| Lime Avenue | PR4 2UB |
| Marsden Street | PR4 2TB PR4 2TH PR4 2TJ |
| Moor Street | PR4 2AU |
| Mulberry Mews | PR4 2UF |
| New Row | PR4 2XS |
| Oak Avenue | PR4 2UD |
| Old Row | PR4 2UX |
| Orders Lane | PR4 2RS |
| Park Road | PR4 2BJ |
| Phillip Avenue | PR4 2SY |
| Poplar Avenue | PR4 2UA |
| Poulton Street | PR4 2AA PR4 2AJ PR4 2AP PR4 2DP |
| Preston Street | PR4 2ZA |
| Progress Business Park | PR4 2TZ |
| Queens Crescent | PR4 2SU |
| Ribby Road | PR4 2BB PR4 2BD |
| Roman Way | PR4 2YG |
| Royal Avenue | PR4 2SS PR4 2ST |
| Royal Troon Court | PR4 2TF |
| South View | PR4 2TT |
| Southlands | PR4 2TR |
| St Anthonys Place | PR4 2BN |
| St Johns Avenue | PR4 2BP |
| St Stephens Road | PR4 2BL |
| St Theresa's Court | PR4 2SZ |
| St Thomas Road | PR4 2TS |
| Stanley Street | PR4 2UN PR4 2UT |
| Sunningdale Close | PR4 2TG |
| Swarbrick Street | PR4 2DB |
| The Chimes | PR4 2XQ |
| The Close | PR4 2UL |
| The Conifers | PR4 2RY |
| The Ferns | PR4 2BF |
| Turnberry Close | PR4 2TE |
| Ward Street | PR4 2DA |
| Wentworth Court | PR4 2UR |
| Windmill Avenue | PR4 2ZQ |
| PR4 2DN PR4 2UU PR4 9AB PR4 9AQ PR4 9AR PR4 9AS PR4 9AT PR4 9AY PR4 9BD PR4 9BE PR4 9BJ PR4 9BQ PR4 9BW PR4 9BX PR4 9BZ PR4 1WH |
Transport near Kirkham South
- FAQ
- Price Paid By Year
- Property Type Price
Frequently asked questions about Kirkham South
What is the average price for a property for sale in Kirkham South?
The average price for a property for sale in Kirkham South is £170,412. This amount is 24% lower than the average price in Preston. There are 763 property listings for sale in Kirkham South.
What streets have the most expensive properties for sale in Kirkham South?
The streets with the most expensive properties for sale in Kirkham South are The Ferns at an average of £402,000, Bryning Fern Lane at an average of £358,500 and Sunningdale Close at an average of £299,975.
What streets have the most affordable properties for sale in Kirkham South?
The streets with the most affordable properties for sale in Kirkham South are Clegg Street at an average of £83,000, Houghtons Court at an average of £92,500 and Preston Street at an average of £104,000.
Which train stations are available in or near Kirkham South?
Some of the train stations available in or near Kirkham South are Kirkham and Wesham, Salwick and Moss Side.
Property Price Paid in Kirkham South by Year
The average sold property price by year was:
| Year | Average Sold Price | Price Change |
Sold Properties
|
|---|---|---|---|
| 2025 | £165,301 | 3% |
37 Properties |
| 2024 | £159,870 | -17% |
35 Properties |
| 2023 | £186,356 | 4% |
35 Properties |
| 2022 | £179,249 | 12% |
52 Properties |
| 2021 | £158,188 | 15% |
59 Properties |
| 2020 | £135,155 | -10% |
29 Properties |
| 2019 | £148,924 | -4% |
55 Properties |
| 2018 | £155,122 | 5% |
38 Properties |
| 2017 | £146,808 | 16% |
47 Properties |
| 2016 | £123,509 | -9% |
48 Properties |
| 2015 | £134,563 | 4% |
50 Properties |
| 2014 | £129,610 | 3% |
40 Properties |
| 2013 | £125,713 | -10% |
33 Properties |
| 2012 | £138,450 | 7% |
34 Properties |
| 2011 | £128,291 | -18% |
35 Properties |
| 2010 | £150,892 | 12% |
19 Properties |
| 2009 | £132,275 | -7% |
27 Properties |
| 2008 | £141,098 | -5% |
28 Properties |
| 2007 | £148,453 | 0,3% |
64 Properties |
| 2006 | £148,025 | 0,1% |
70 Properties |
| 2005 | £147,935 | 19% |
46 Properties |
| 2004 | £119,333 | 9% |
58 Properties |
| 2003 | £108,914 | 30% |
60 Properties |
| 2002 | £76,644 | 19% |
85 Properties |
| 2001 | £62,073 | 7% |
76 Properties |
| 2000 | £57,900 | 3% |
56 Properties |
| 1999 | £55,918 | 9% |
61 Properties |
| 1998 | £50,982 | -4% |
64 Properties |
| 1997 | £53,158 | -18% |
68 Properties |
| 1996 | £62,626 | 24% |
67 Properties |
| 1995 | £47,754 | - |
31 Properties |
Property Price per Property Type in Kirkham South
Here you can find historic sold price data in order to help with your property search.
The average Property Paid Price for specific property types in the last three years are:
| Property Type | Average Sold Price | Sold Properties |
|---|---|---|
| Semi Detached House | £158,783.00 | 15 Semi Detached Houses |
| Detached House | £279,017.00 | 26 Detached Houses |
| Terraced House | £131,607.00 | 62 Terraced Houses |
| Flat | £109,562.00 | 4 Flats |

