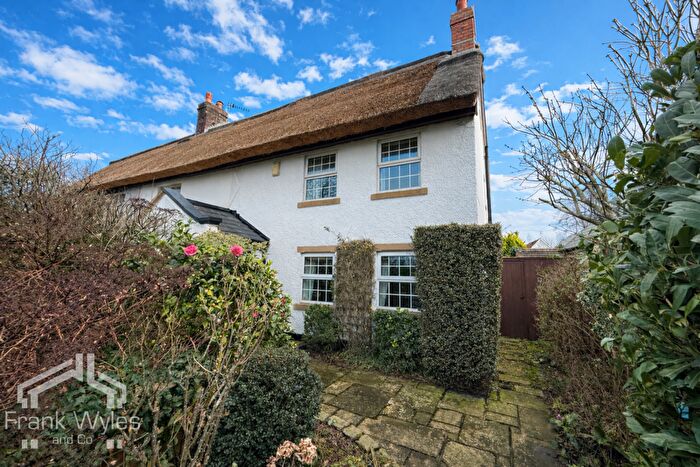
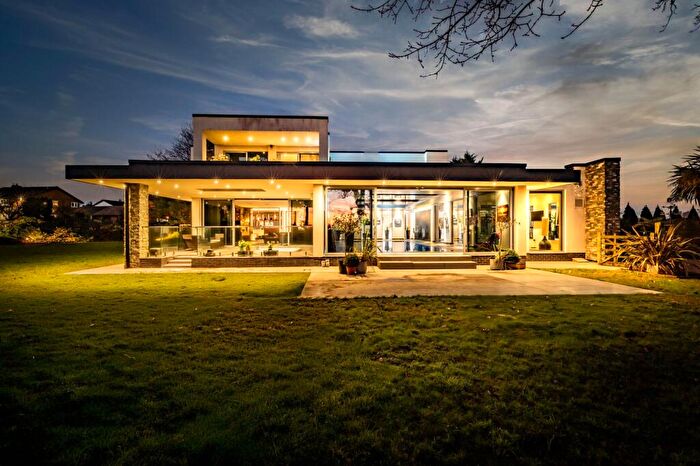
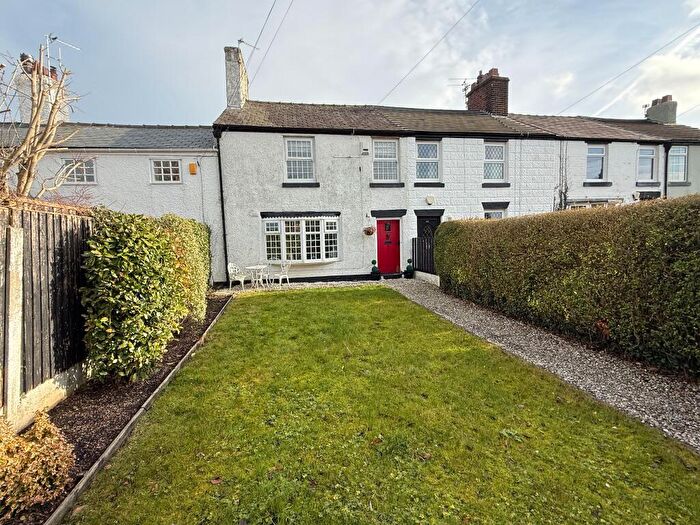
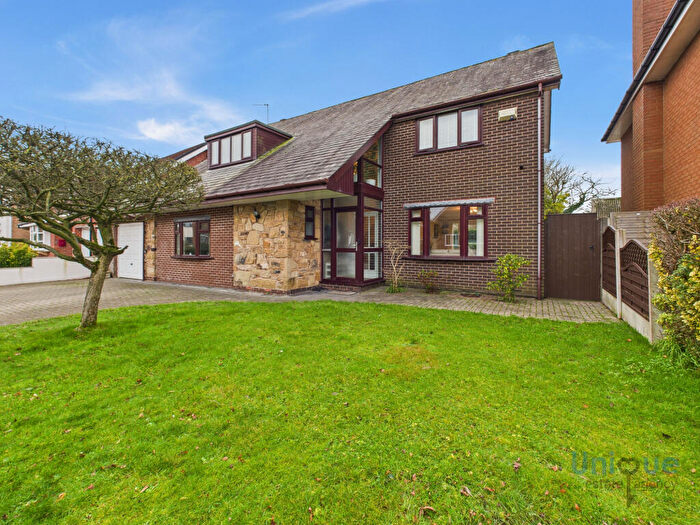
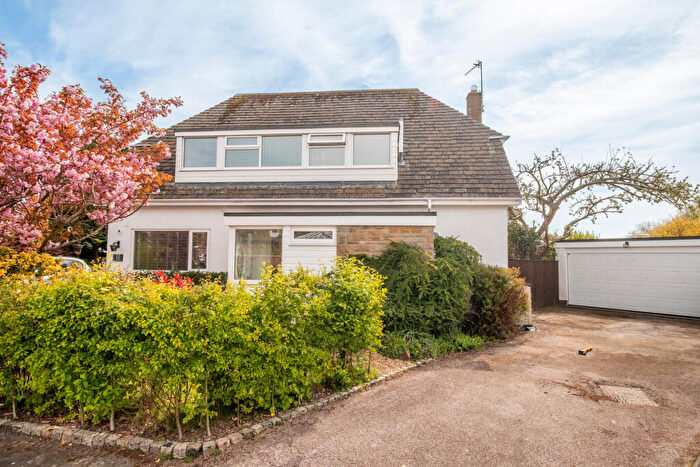
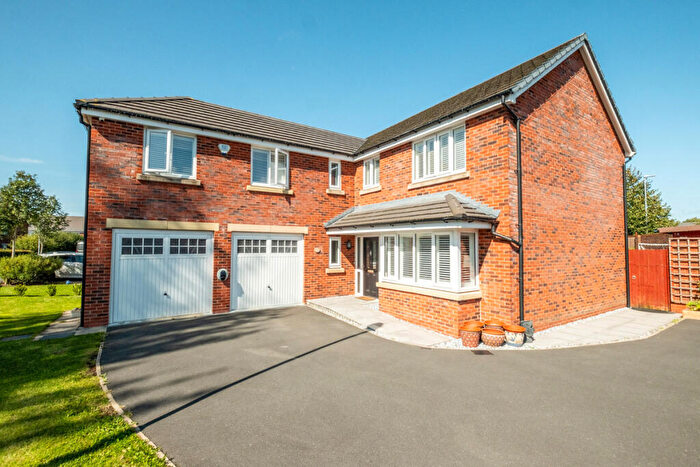
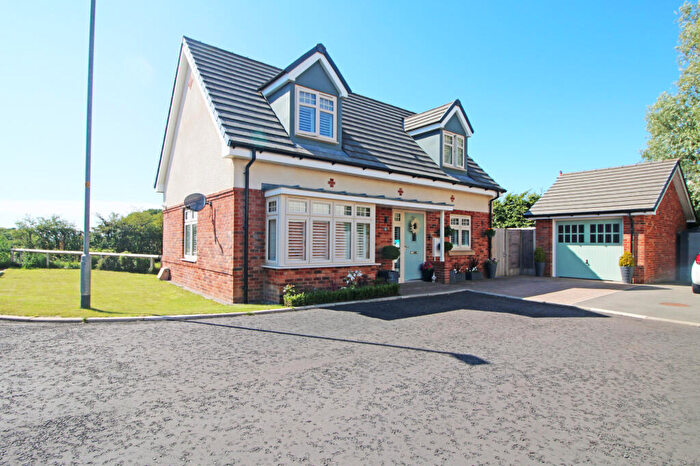
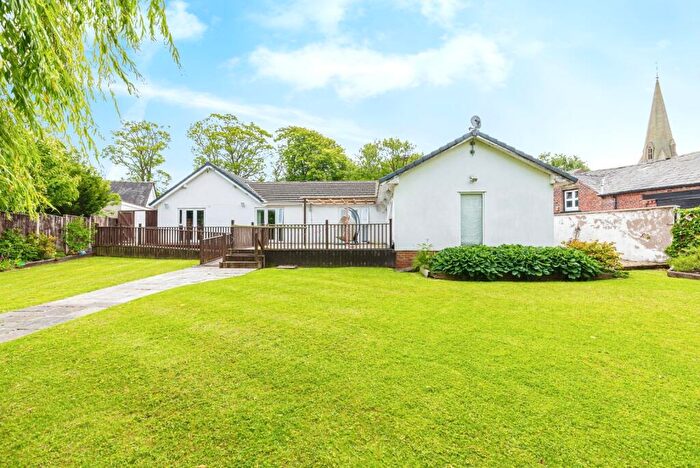
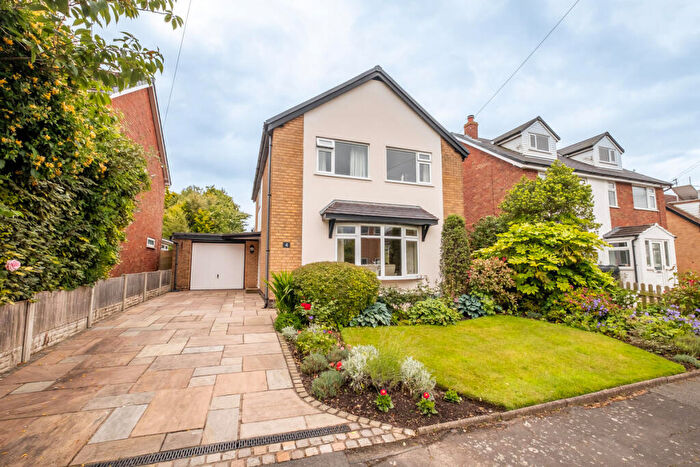
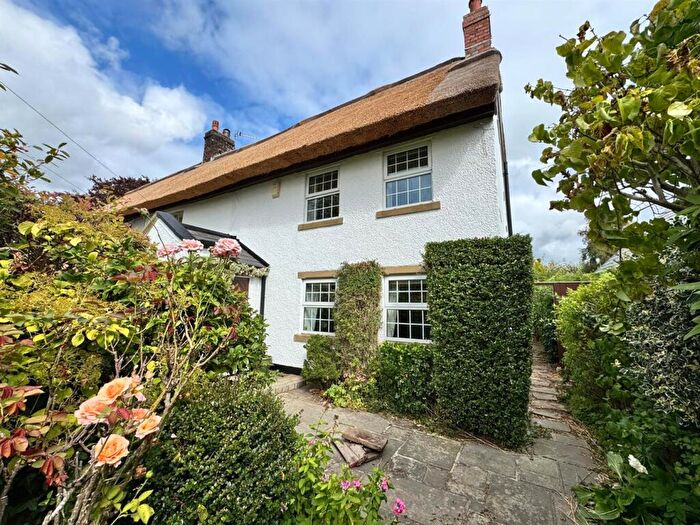
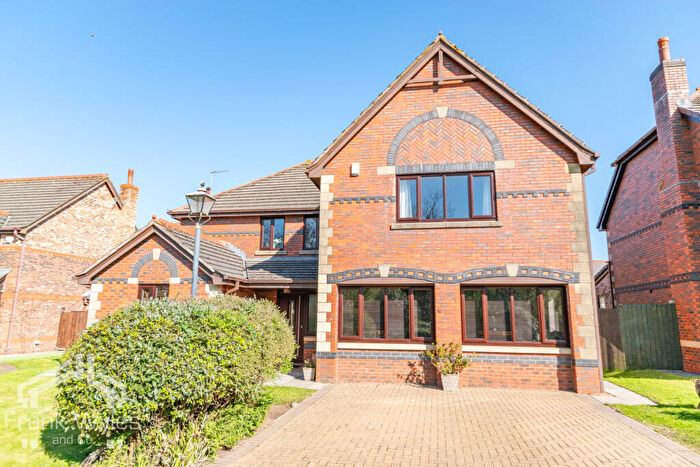
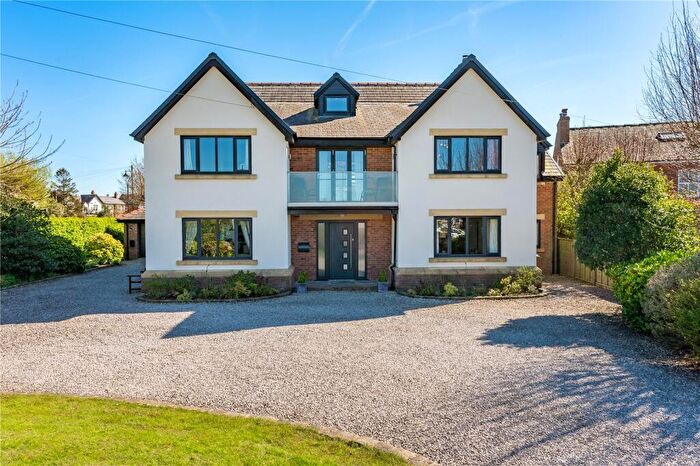
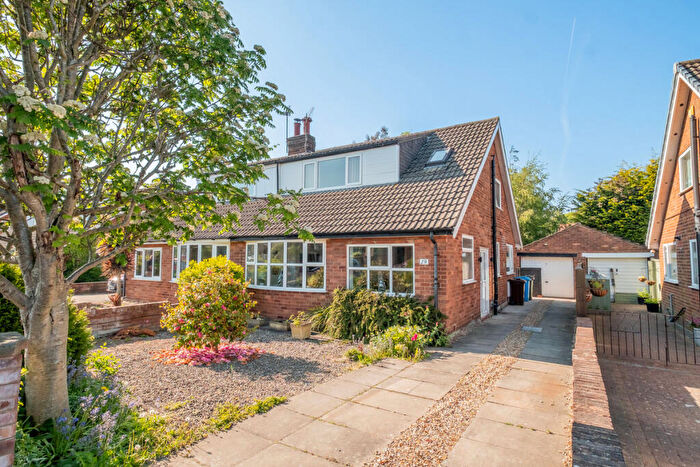
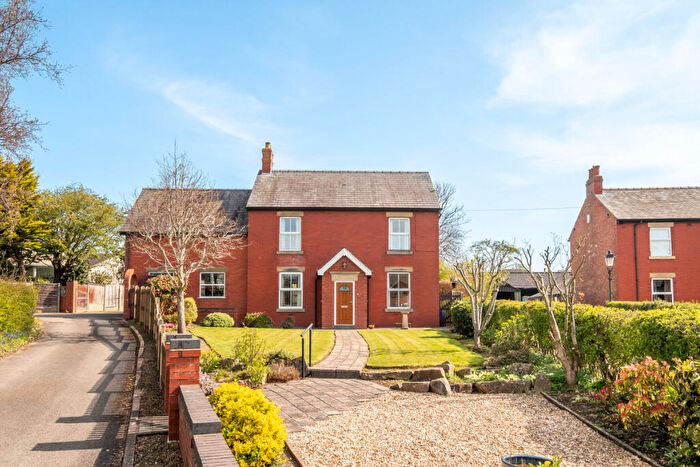
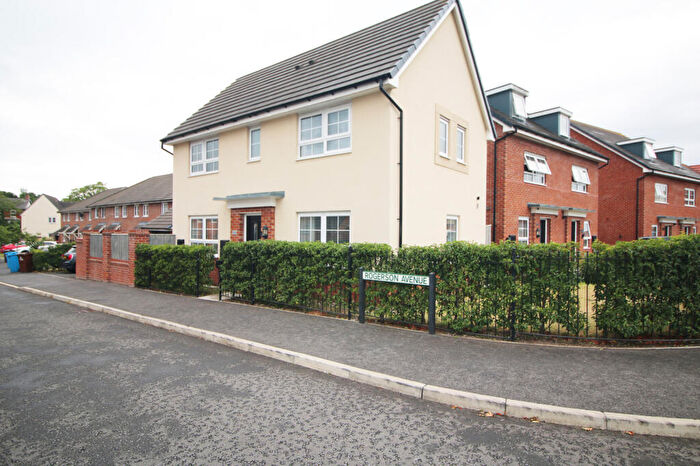
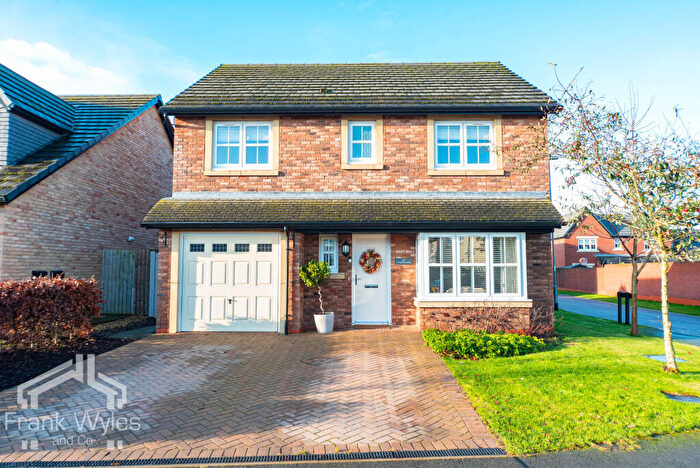
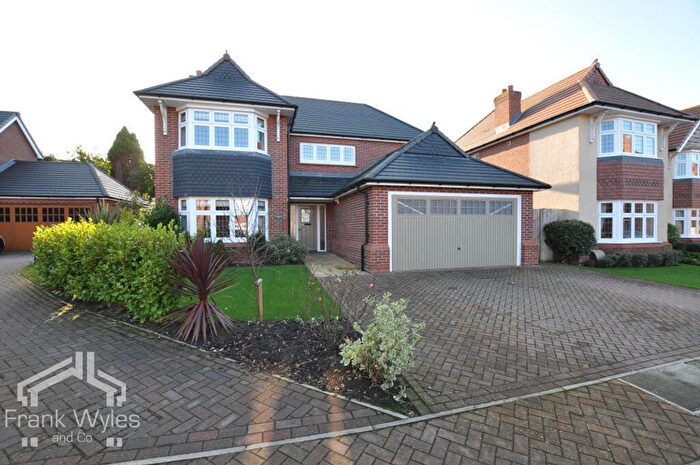
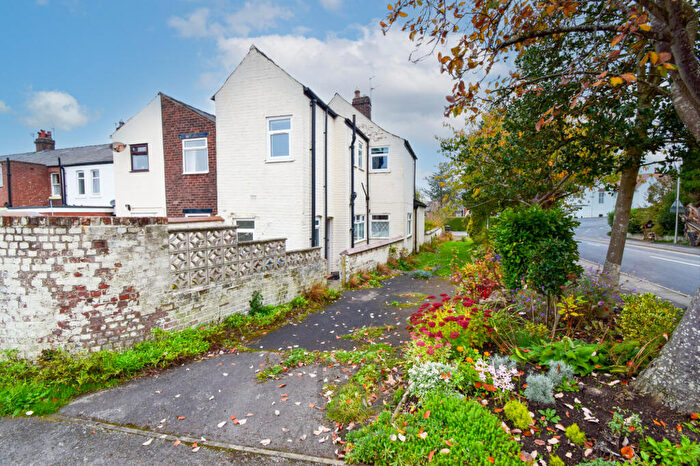
Houses for sale & to rent in Ribby-with-wrea, Preston
House Prices in Ribby-with-wrea
Properties in Ribby-with-wrea have an average house price of £430,151.00 and had 100 Property Transactions within the last 3 years¹.
Ribby-with-wrea is an area in Preston, Lancashire with 621 households², where the most expensive property was sold for £1,000,000.00.
Properties for sale in Ribby-with-wrea
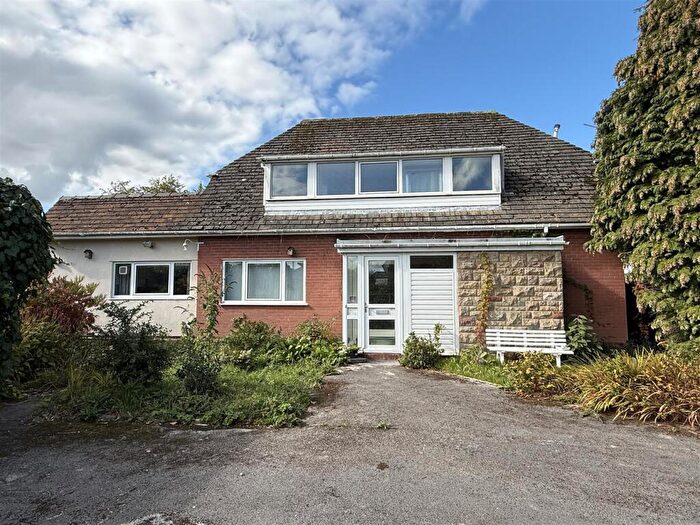
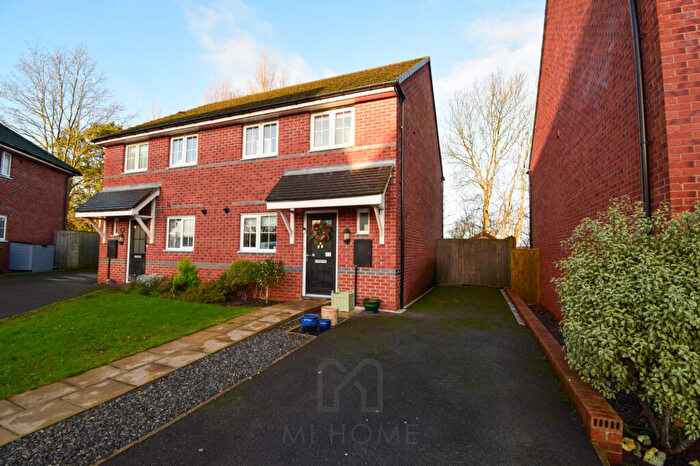
Previously listed properties in Ribby-with-wrea
Roads and Postcodes in Ribby-with-wrea
Navigate through our locations to find the location of your next house in Ribby-with-wrea, Preston for sale or to rent.
| Streets | Postcodes |
|---|---|
| Ainsworth Fold | PR4 2WE |
| Alice Way | PR4 2FE |
| Ash Grove | PR4 2NY |
| Beechfield Avenue | PR4 2NX |
| Beverley Close | PR4 2NP |
| Brookway | PR4 2NU |
| Brown Lane | PR4 3PQ |
| Bryning Avenue | PR4 2WL |
| Bryning Lane | PR4 2NL PR4 2WJ |
| Church Row | PR4 2PD |
| Church View Fold | PR4 2EH |
| Dubside | PR4 2WQ |
| Duckworth Avenue | PR4 2EJ |
| Elms Drive | PR4 2NR |
| First Avenue | PR4 2WR |
| Garden Avenue | PR4 2WD |
| Hedge Row | PR4 2PP |
| Heywood Lane | PR4 2FF |
| Langton Lane | PR4 2FB PR4 2FD |
| Malcolms Place | PR4 2FG |
| Manor Road | PR4 2PB |
| Manor Way | PR4 2WH |
| Mccall Close | PR4 2WT |
| Meadow Close | PR4 2NS |
| Mill Lane | PR4 2WP |
| Moss Side Lane | PR4 2PE |
| North View Fold | PR4 2EQ |
| Orchard Close | PR4 2NH |
| Park Terrace | PR4 2WN |
| Ribby Avenue | PR4 2ND |
| Ribby Road | PR4 2NA PR4 2NB PR4 2PA PR4 2PR |
| Richmond Avenue | PR4 2NJ |
| Sharples Drive | PR4 2EL |
| Smithy Fold | PR4 2NE |
| St Nicholas Grove | PR4 2WB |
| Station Road | PR4 2PH |
| Stoney Grove | PR4 2EP |
| The Brooklands | PR4 2NQ |
| The Dell | PR4 2PN |
| The Green | PR4 2WW |
| The Greenside | PR4 2NN |
| Thistleton Place | PR4 2EN |
| Vicarage Close | PR4 2PQ |
| Westbourne Avenue | PR4 2PL |
| Willow Drive | PR4 2NT |
| Woodland Close | PR4 2WS |
| Wray Crescent | PR4 2WA |
| PR4 2FU |
Transport near Ribby-with-wrea
-
Moss Side Station
-
Kirkham and Wesham Station
-
Lytham Station
-
Salwick Station
-
Ansdell and Fairhaven Station
- FAQ
- Price Paid By Year
- Property Type Price
Frequently asked questions about Ribby-with-wrea
What is the average price for a property for sale in Ribby-with-wrea?
The average price for a property for sale in Ribby-with-wrea is £430,151. This amount is 93% higher than the average price in Preston. There are 315 property listings for sale in Ribby-with-wrea.
What streets have the most expensive properties for sale in Ribby-with-wrea?
The streets with the most expensive properties for sale in Ribby-with-wrea are Malcolms Place at an average of £694,000, Church View Fold at an average of £692,500 and Brookway at an average of £690,000.
What streets have the most affordable properties for sale in Ribby-with-wrea?
The streets with the most affordable properties for sale in Ribby-with-wrea are Wray Crescent at an average of £231,250, Manor Road at an average of £235,000 and First Avenue at an average of £238,000.
Which train stations are available in or near Ribby-with-wrea?
Some of the train stations available in or near Ribby-with-wrea are Moss Side, Kirkham and Wesham and Lytham.
Property Price Paid in Ribby-with-wrea by Year
The average sold property price by year was:
| Year | Average Sold Price | Price Change |
Sold Properties
|
|---|---|---|---|
| 2025 | £411,137 | -1% |
27 Properties |
| 2024 | £413,644 | -14% |
43 Properties |
| 2023 | £470,925 | 5% |
30 Properties |
| 2022 | £445,972 | 6% |
47 Properties |
| 2021 | £418,386 | 13% |
48 Properties |
| 2020 | £362,406 | 4% |
43 Properties |
| 2019 | £348,535 | 2% |
54 Properties |
| 2018 | £341,142 | - |
68 Properties |
| 2017 | £341,171 | -10% |
64 Properties |
| 2016 | £375,944 | -5% |
59 Properties |
| 2015 | £396,504 | 19% |
49 Properties |
| 2014 | £320,398 | -34% |
28 Properties |
| 2013 | £430,826 | 23% |
26 Properties |
| 2012 | £333,181 | 7% |
19 Properties |
| 2011 | £310,551 | -2% |
33 Properties |
| 2010 | £316,745 | -13% |
22 Properties |
| 2009 | £357,573 | 5% |
19 Properties |
| 2008 | £340,338 | 9% |
13 Properties |
| 2007 | £308,652 | 1% |
23 Properties |
| 2006 | £305,587 | -40% |
27 Properties |
| 2005 | £427,495 | 37% |
12 Properties |
| 2004 | £267,736 | 5% |
29 Properties |
| 2003 | £255,346 | 19% |
30 Properties |
| 2002 | £206,578 | 29% |
37 Properties |
| 2001 | £146,686 | 9% |
37 Properties |
| 2000 | £133,731 | -4% |
30 Properties |
| 1999 | £139,196 | 3% |
38 Properties |
| 1998 | £134,603 | -4% |
33 Properties |
| 1997 | £140,031 | 17% |
37 Properties |
| 1996 | £115,614 | -19% |
28 Properties |
| 1995 | £137,640 | - |
22 Properties |
Property Price per Property Type in Ribby-with-wrea
Here you can find historic sold price data in order to help with your property search.
The average Property Paid Price for specific property types in the last three years are:
| Property Type | Average Sold Price | Sold Properties |
|---|---|---|
| Semi Detached House | £310,712.00 | 20 Semi Detached Houses |
| Detached House | £485,854.00 | 73 Detached Houses |
| Terraced House | £200,383.00 | 6 Terraced Houses |
| Flat | £131,250.00 | 1 Flat |

