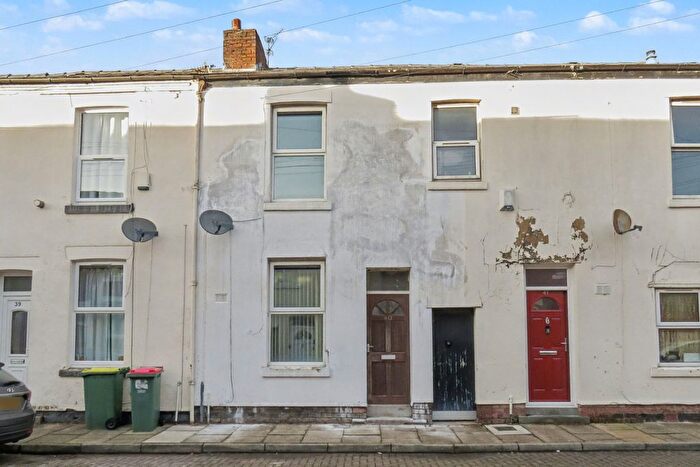
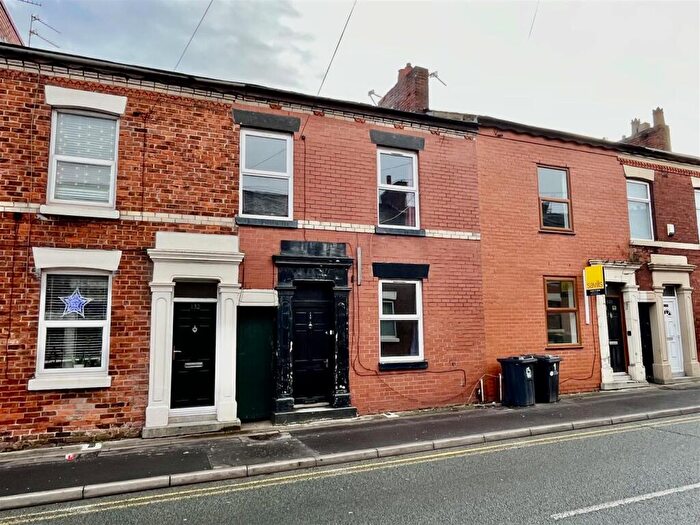
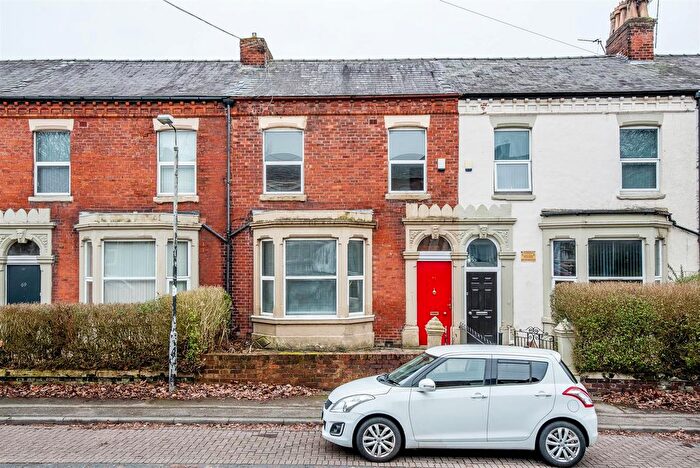
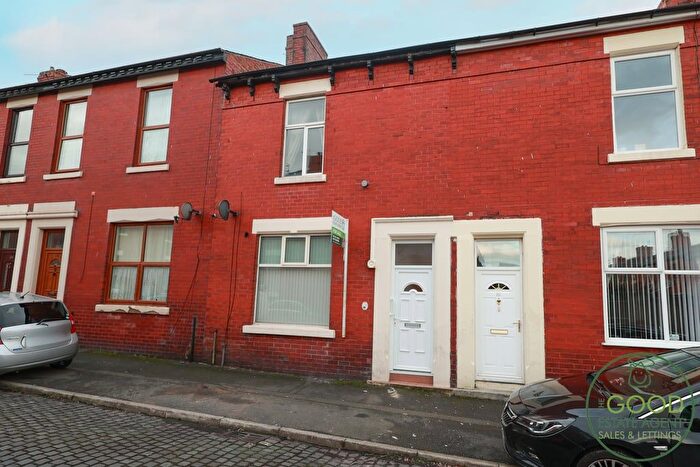
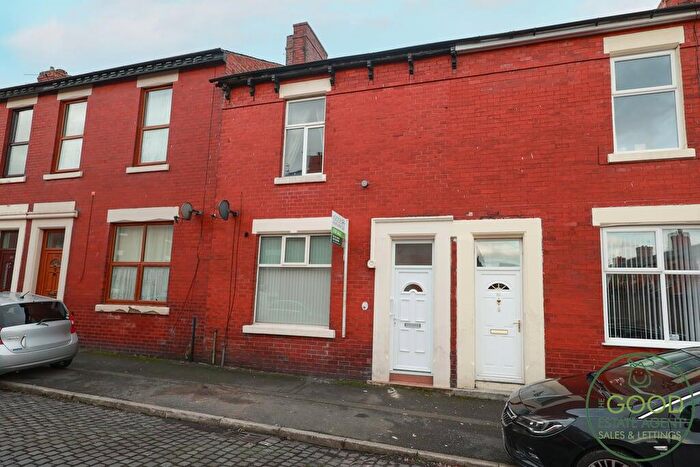
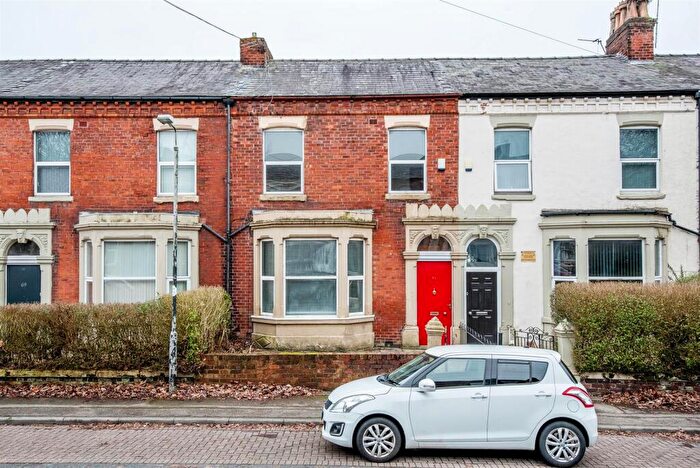
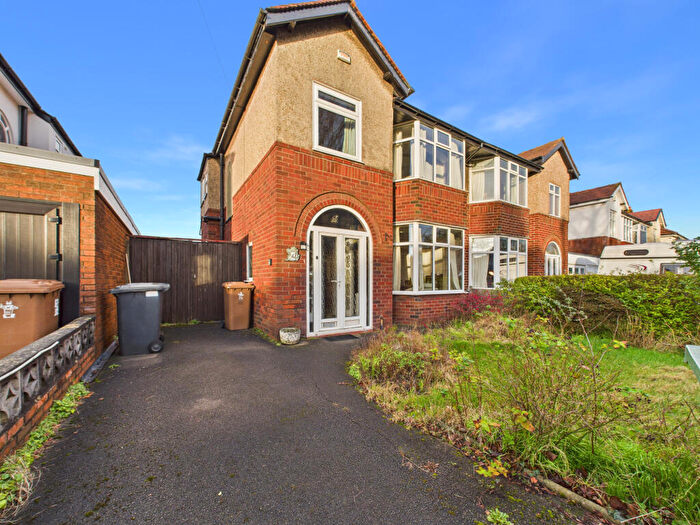
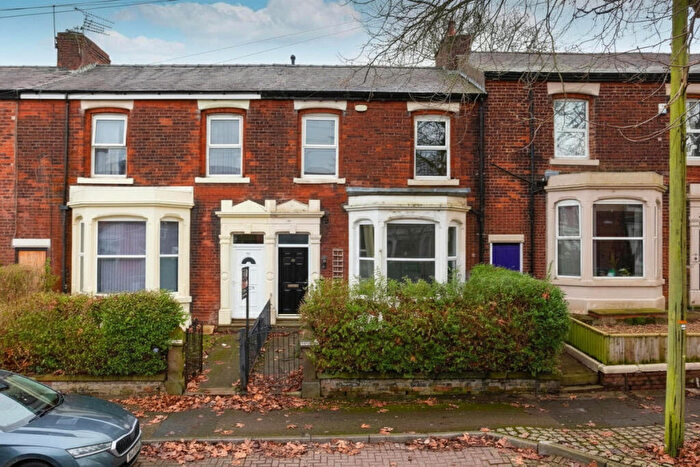
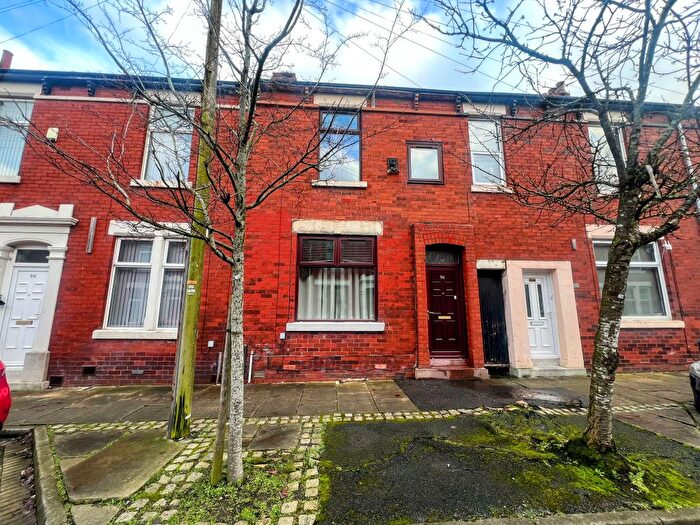
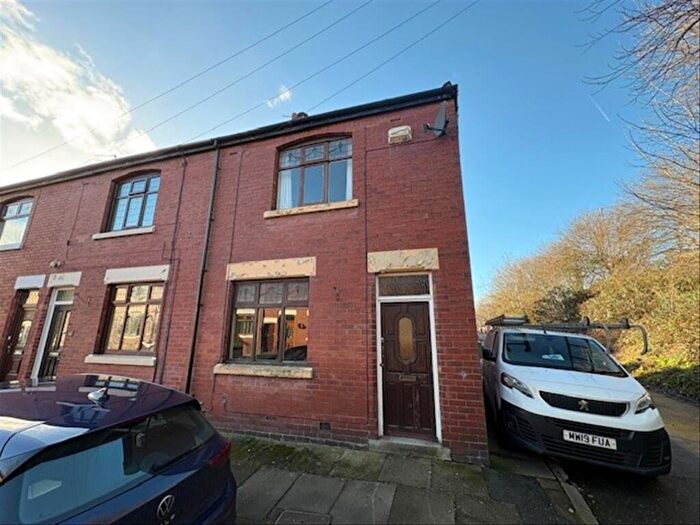
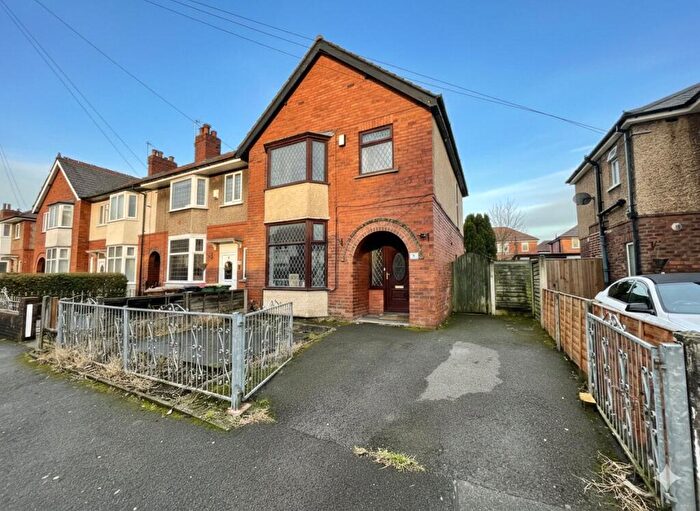
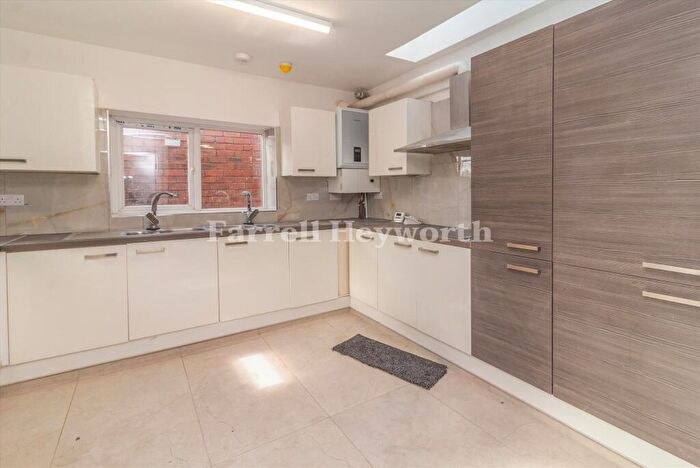
Houses for sale & to rent in Moor Park, Preston
House Prices in Moor Park
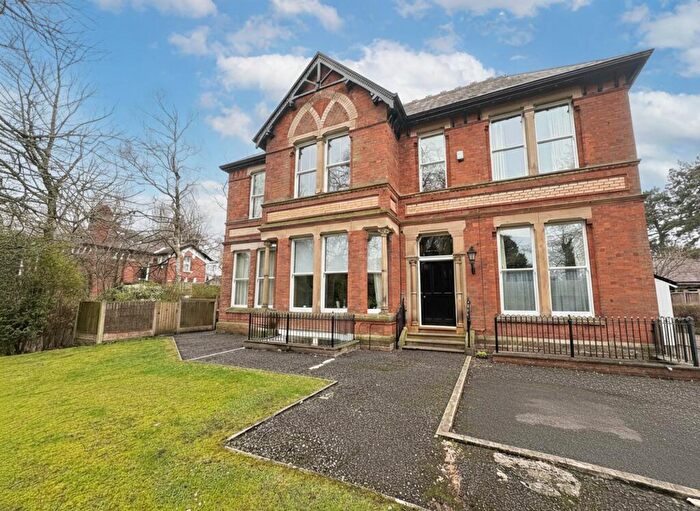
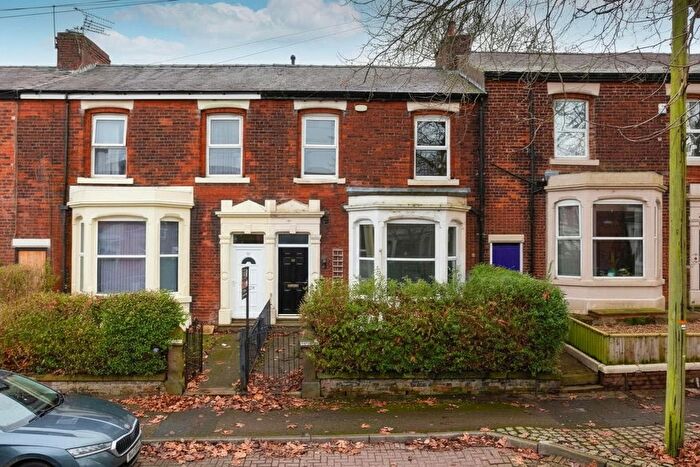
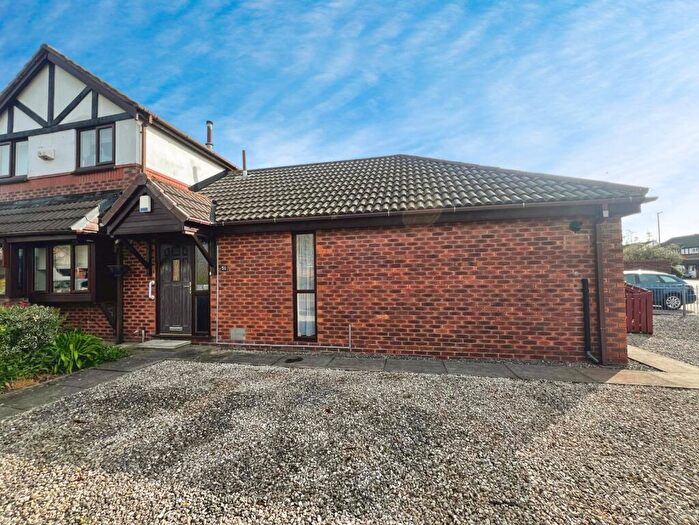
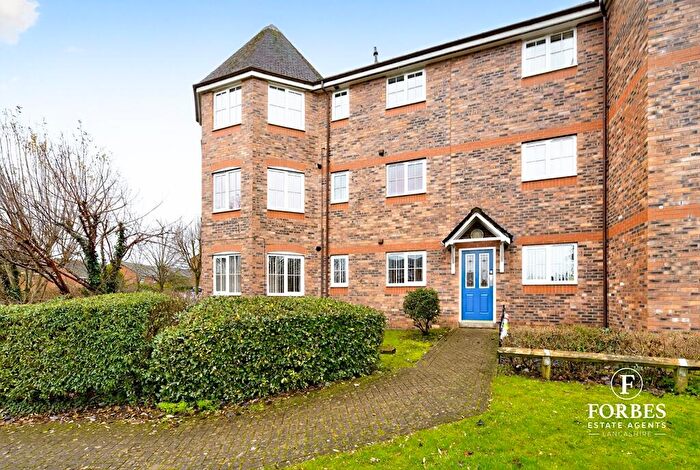
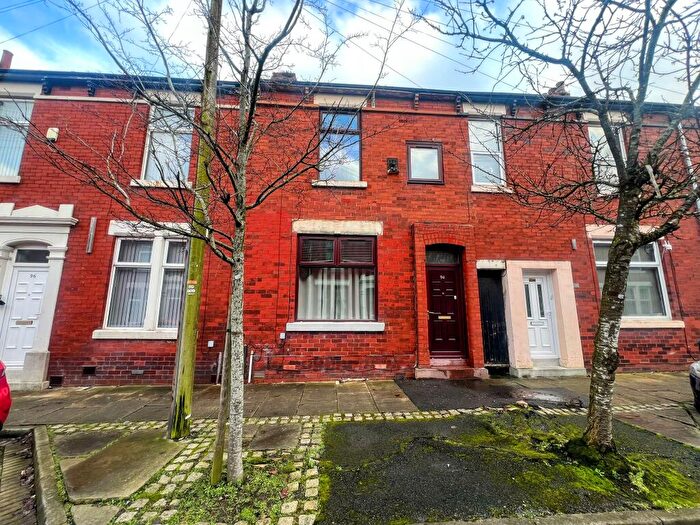
Properties in Moor Park have an average house price of £130,030.00 and had 259 Property Transactions within the last 3 years¹.
Moor Park is an area in Preston, Lancashire with 2,065 households², where the most expensive property was sold for £390,000.00.
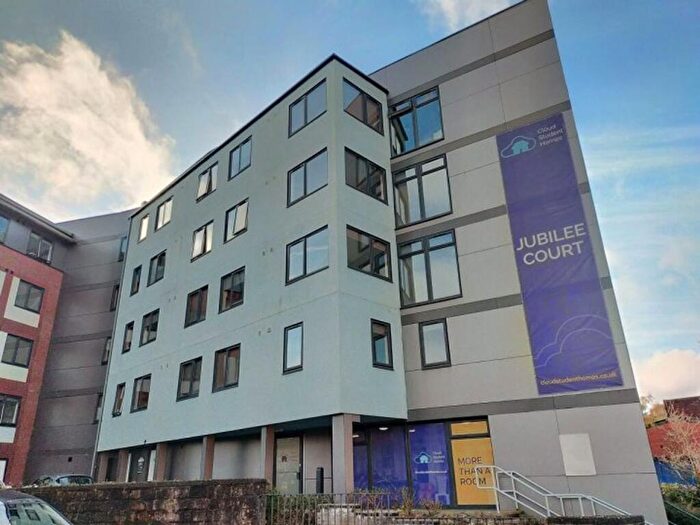
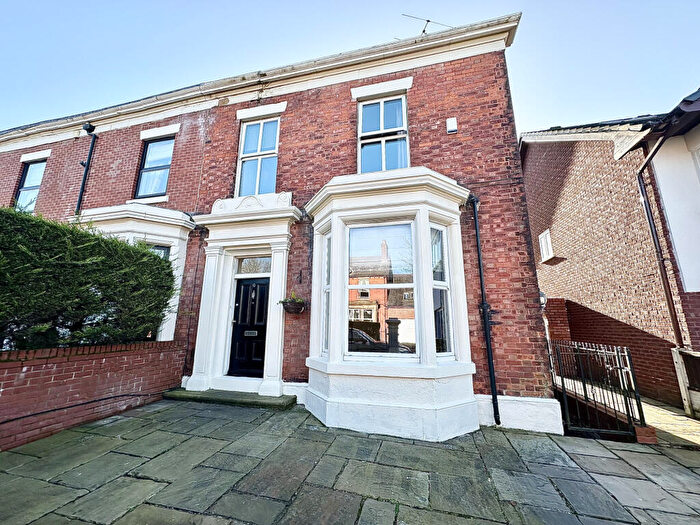
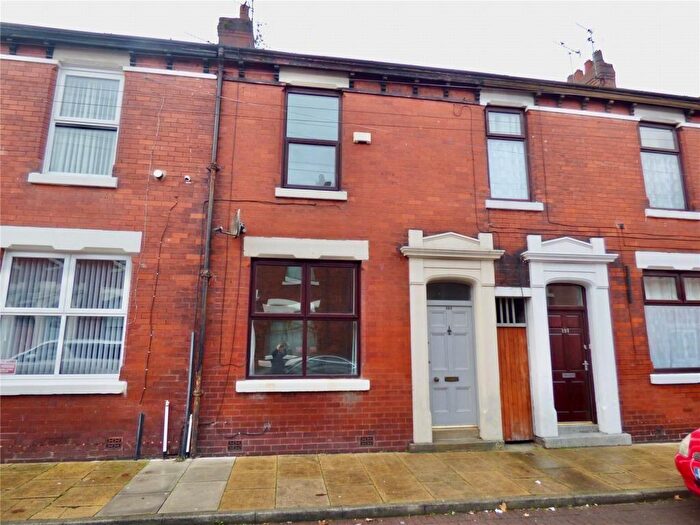
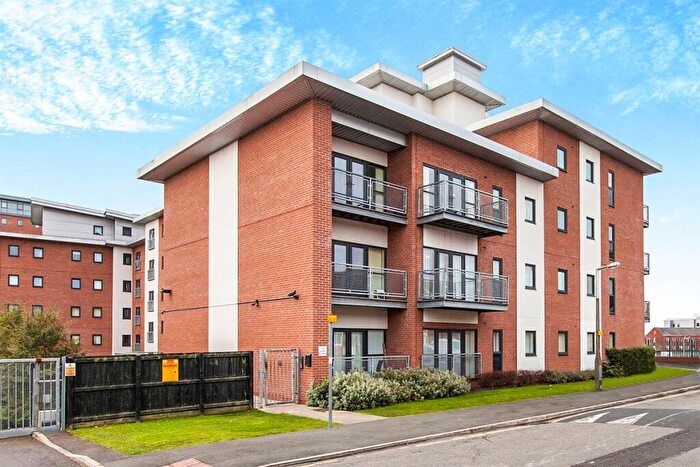
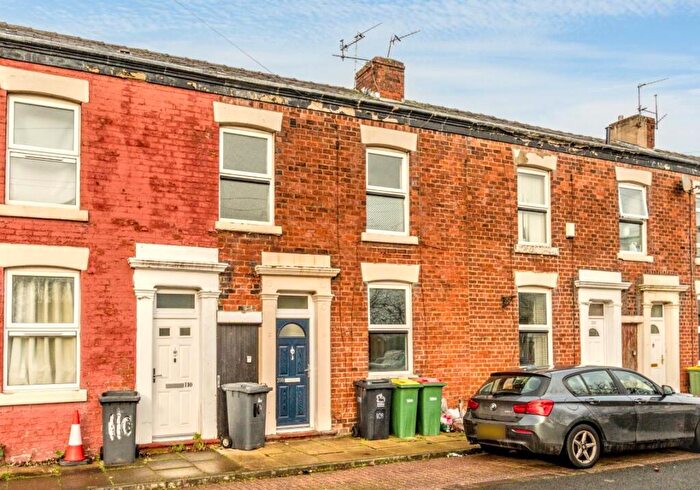
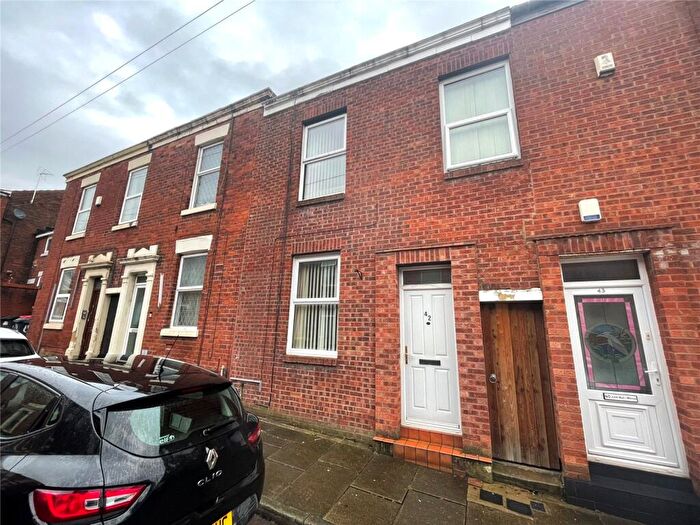
Properties for sale in Moor Park
Roads and Postcodes in Moor Park
Navigate through our locations to find the location of your next house in Moor Park, Preston for sale or to rent.
| Streets | Postcodes |
|---|---|
| Ainslie Road | PR2 3DB PR2 3DD PR2 3DE |
| Albert Road | PR1 6DE PR1 6DH |
| Arkwright Road | PR1 6BX PR1 6BY |
| Balfour Road | PR2 3BX PR2 3BY |
| Blackpool Road | PR2 3AA PR2 3AB PR2 3AD PR2 3AE |
| Blundell Road | PR2 3DR |
| Brackenbury Road | PR1 7UP PR1 7UQ PR1 7UR PR2 3BS PR2 3BT PR2 3BU |
| Broughton Street | PR1 7US PR1 7UT PR1 7UU |
| Butler Place | PR1 6BS |
| Cambridge Close | PR1 7PR |
| Cambridge Court | PR1 7SU |
| Cambridge Street | PR1 7XA |
| Cambridge Walk | PR1 7SL |
| College Court | PR1 7RN PR1 7RU |
| Crofters Green | PR1 7UG |
| Dallas Street | PR1 7UX PR1 7UY |
| Derwentwater Place | PR1 6DL |
| Eldon Street | PR1 7YD PR1 7YE |
| Elliott Street | PR1 7XN |
| Elmsley Street | PR1 7XD PR1 7XE |
| English Martyrs Place | PR1 6DN |
| Garstang Road | PR1 1LA PR1 1LB PR1 1NA PR1 1NN PR1 1US PR2 3BH PR2 3EB |
| Hardcastle Road | PR2 3DL PR2 3DN PR2 3DP |
| Havelock Street | PR1 7RP |
| Haysworth Street | PR1 7RT |
| Henderson Street | PR1 7XP PR1 7XQ PR1 7XR |
| Houldsworth Road | PR2 3DQ |
| Jemmett Street | PR1 7XH PR1 7XJ |
| Kenmure Place | PR1 6DD |
| Lockhart Road | PR1 6BT |
| Lorraine Avenue | PR2 3BL PR2 3BN |
| Lovat Road | PR1 6DP PR1 6DQ |
| Lowndes Street | PR1 7XS PR1 7XT PR1 7XU |
| Lytham Road | PR2 8JD PR2 8JE |
| Miles Walk | PR1 7NN |
| Moor Hall Street | PR1 7XL |
| Moor Park Avenue | PR1 6AS |
| Muncaster Road | PR1 6BD PR1 6BQ |
| Otway Street | PR1 7XB |
| Plungington Road | PR1 7RA PR1 7RB PR1 7UD PR2 3PQ PR2 3PR |
| Queens Road | PR2 3BQ PR2 3EA PR2 3FD |
| Ripon Street | PR1 7UJ PR1 7UL |
| Shuttleworth Road | PR1 6DA PR1 6DB |
| St Georges Road | PR1 1PQ PR1 6BU |
| St James Road | PR1 6DJ |
| St Thomas Road | PR1 6AX |
| Symonds Road | PR2 3DH PR2 3DJ |
| Trafford Street | PR1 7XX PR1 7XY PR1 7YA PR1 7YB |
Transport near Moor Park
- FAQ
- Price Paid By Year
- Property Type Price
Frequently asked questions about Moor Park
What is the average price for a property for sale in Moor Park?
The average price for a property for sale in Moor Park is £130,030. This amount is 42% lower than the average price in Preston. There are 1,775 property listings for sale in Moor Park.
What streets have the most expensive properties for sale in Moor Park?
The streets with the most expensive properties for sale in Moor Park are Brackenbury Road at an average of £213,822, Lorraine Avenue at an average of £213,750 and Lytham Road at an average of £211,666.
What streets have the most affordable properties for sale in Moor Park?
The streets with the most affordable properties for sale in Moor Park are Trafford Street at an average of £70,000, Albert Road at an average of £82,350 and St Georges Road at an average of £84,833.
Which train stations are available in or near Moor Park?
Some of the train stations available in or near Moor Park are Preston, Lostock Hall and Bamber Bridge.
Property Price Paid in Moor Park by Year
The average sold property price by year was:
| Year | Average Sold Price | Price Change |
Sold Properties
|
|---|---|---|---|
| 2025 | £124,619 | -8% |
83 Properties |
| 2024 | £135,094 | 4% |
85 Properties |
| 2023 | £130,234 | 11% |
91 Properties |
| 2022 | £115,444 | 4% |
127 Properties |
| 2021 | £110,460 | 14% |
107 Properties |
| 2020 | £94,594 | -2% |
63 Properties |
| 2019 | £96,542 | -2% |
76 Properties |
| 2018 | £98,388 | 8% |
83 Properties |
| 2017 | £90,229 | -26% |
90 Properties |
| 2016 | £113,259 | 15% |
72 Properties |
| 2015 | £96,547 | -9% |
76 Properties |
| 2014 | £105,405 | 14% |
59 Properties |
| 2013 | £90,785 | -5% |
59 Properties |
| 2012 | £94,880 | 3% |
62 Properties |
| 2011 | £92,126 | -3% |
64 Properties |
| 2010 | £95,151 | -5% |
79 Properties |
| 2009 | £100,311 | -19% |
66 Properties |
| 2008 | £119,270 | 5% |
88 Properties |
| 2007 | £113,254 | 12% |
172 Properties |
| 2006 | £99,962 | -3% |
153 Properties |
| 2005 | £103,419 | 8% |
151 Properties |
| 2004 | £95,065 | 28% |
194 Properties |
| 2003 | £68,915 | 23% |
184 Properties |
| 2002 | £53,325 | 13% |
170 Properties |
| 2001 | £46,473 | 17% |
159 Properties |
| 2000 | £38,587 | -3% |
141 Properties |
| 1999 | £39,719 | - |
127 Properties |
| 1998 | £39,703 | 9% |
89 Properties |
| 1997 | £36,198 | 6% |
167 Properties |
| 1996 | £34,027 | -5% |
134 Properties |
| 1995 | £35,884 | - |
118 Properties |
Property Price per Property Type in Moor Park
Here you can find historic sold price data in order to help with your property search.
The average Property Paid Price for specific property types in the last three years are:
| Property Type | Average Sold Price | Sold Properties |
|---|---|---|
| Semi Detached House | £170,637.00 | 28 Semi Detached Houses |
| Detached House | £150,500.00 | 3 Detached Houses |
| Terraced House | £126,243.00 | 211 Terraced Houses |
| Flat | £106,529.00 | 17 Flats |

