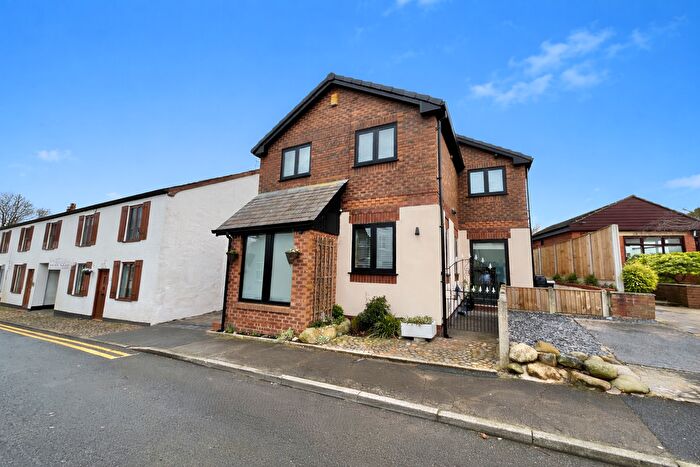
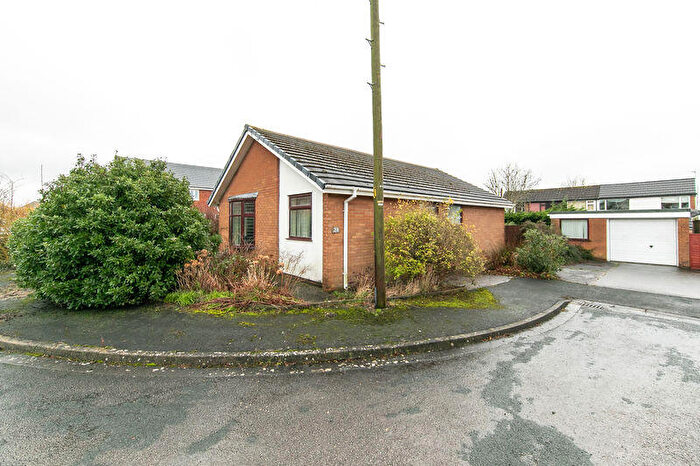
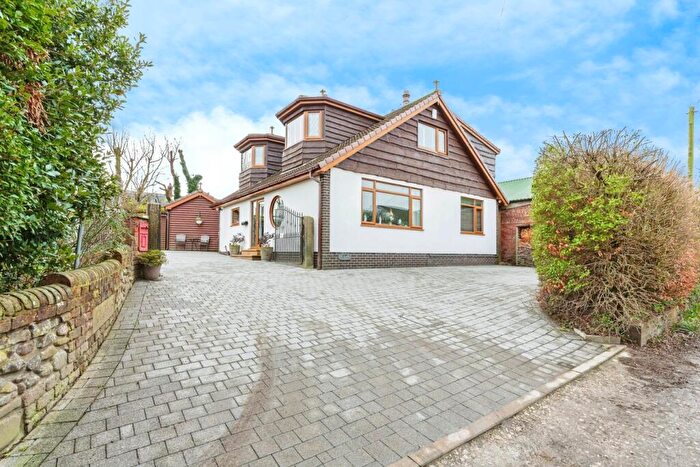
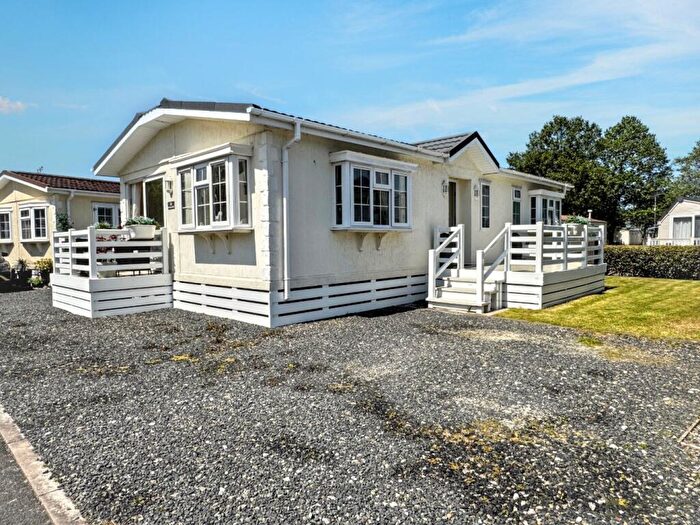
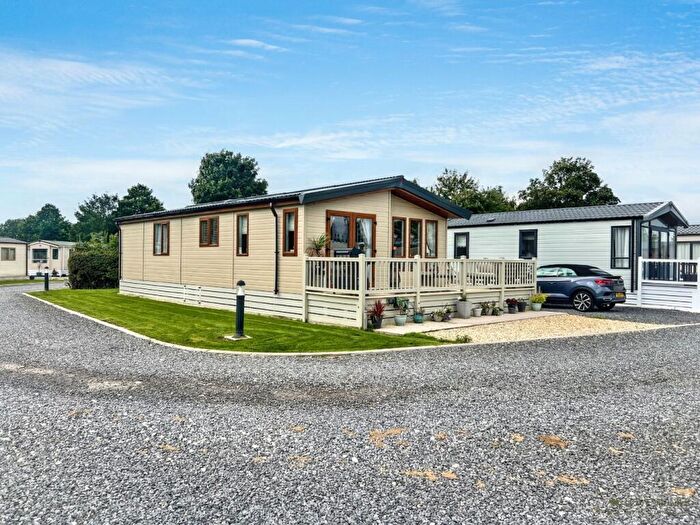
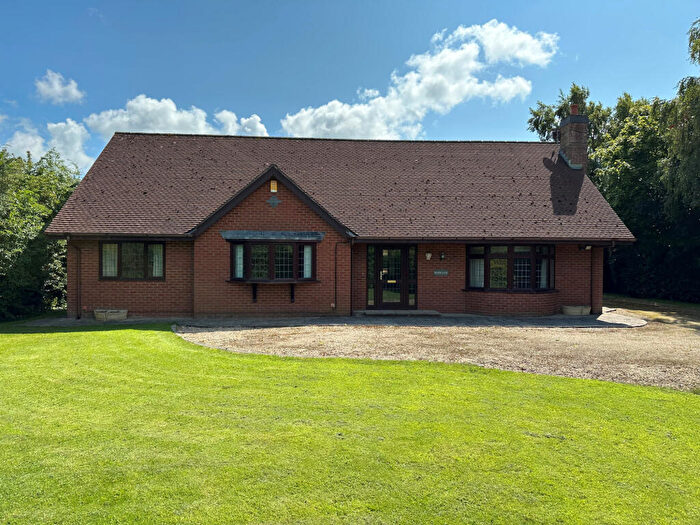
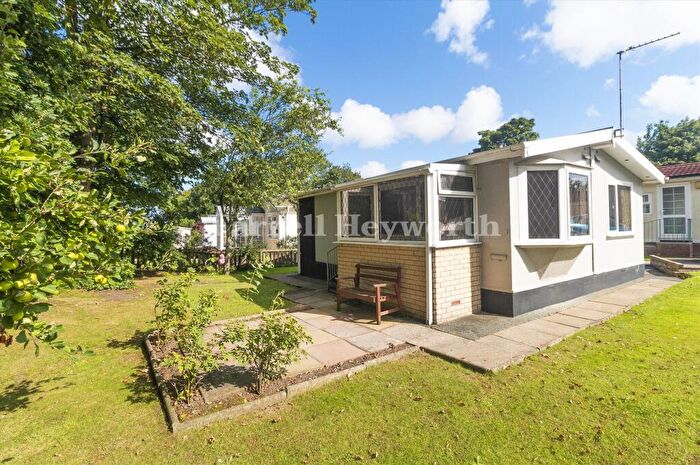
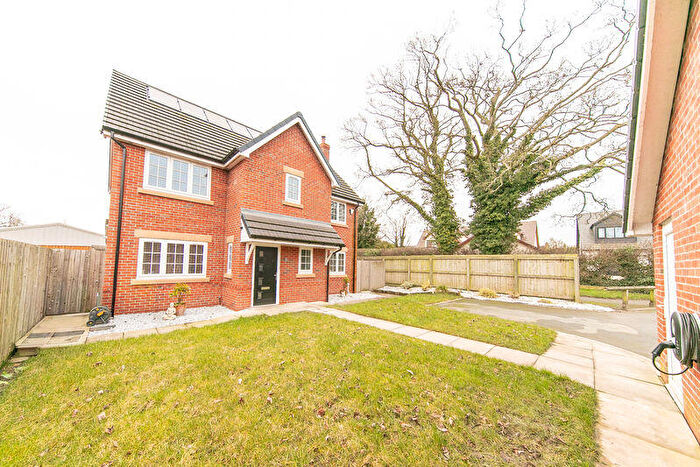
Houses for sale & to rent in Pilling, Preston
House Prices in Pilling
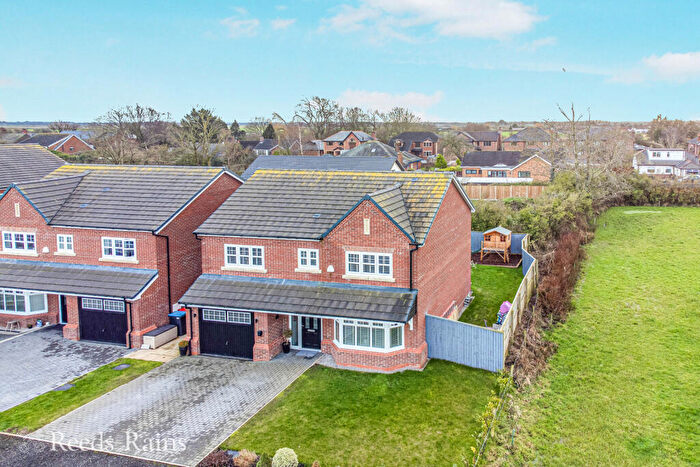
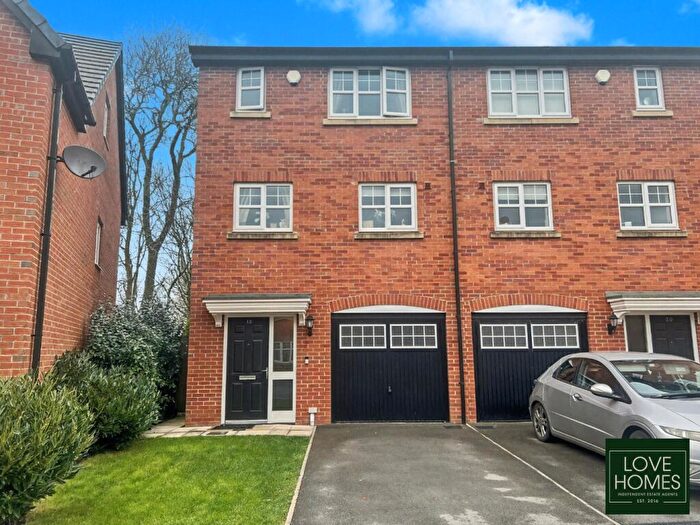
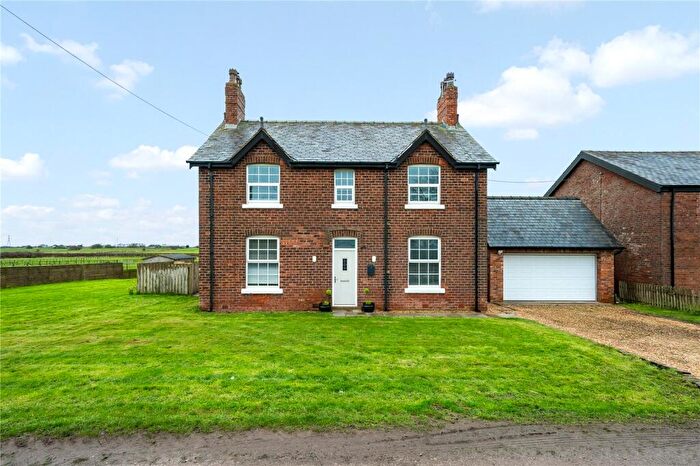
Properties in Pilling have an average house price of £306,511.00 and had 58 Property Transactions within the last 3 years¹.
Pilling is an area in Preston, Lancashire with 888 households², where the most expensive property was sold for £720,000.00.
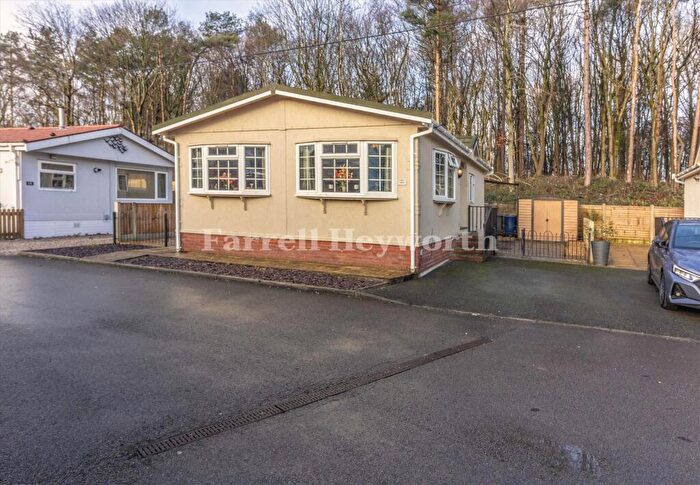
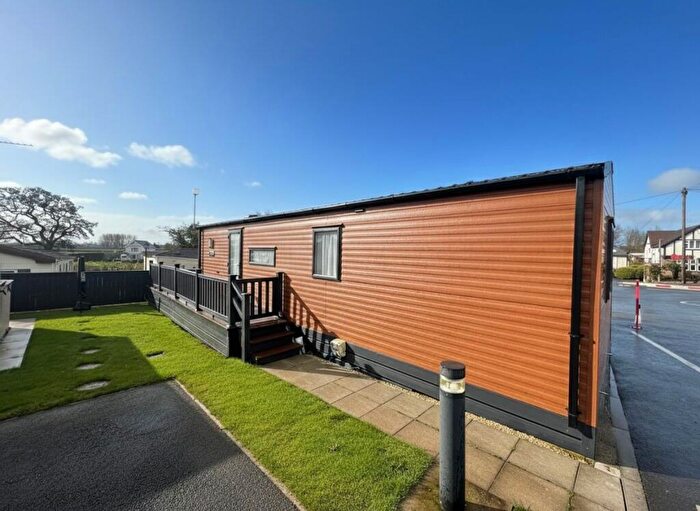
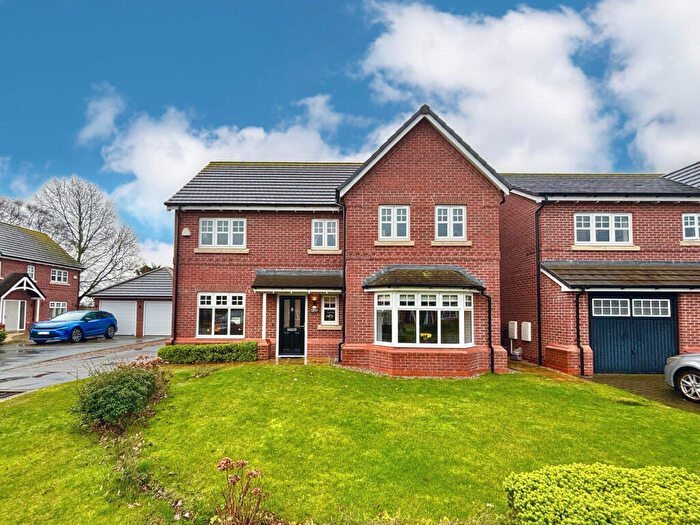
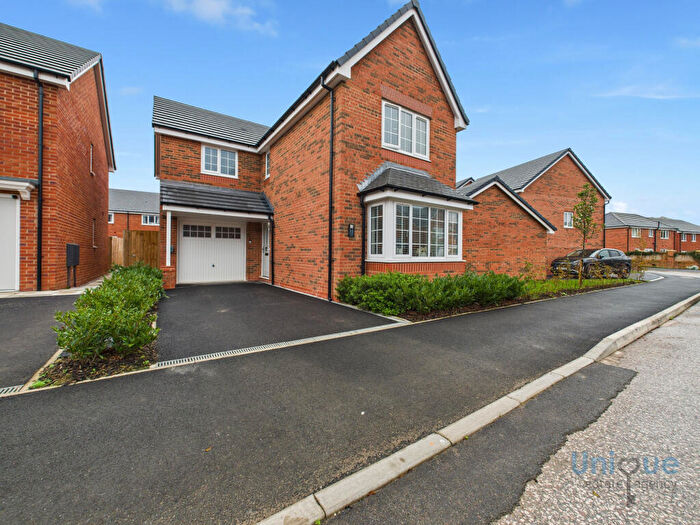
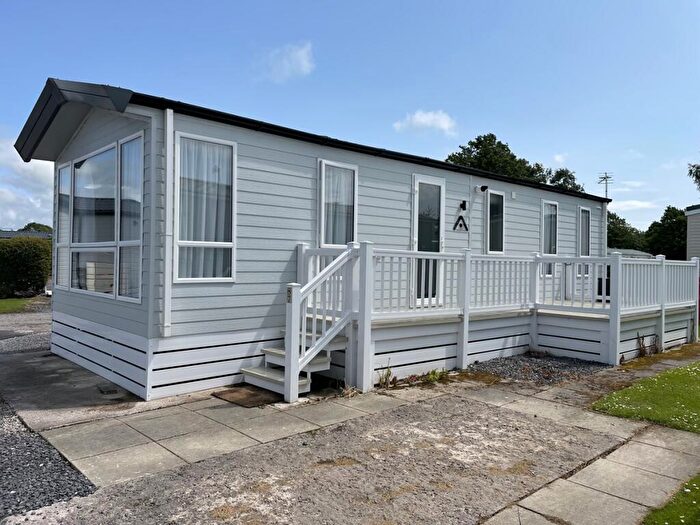
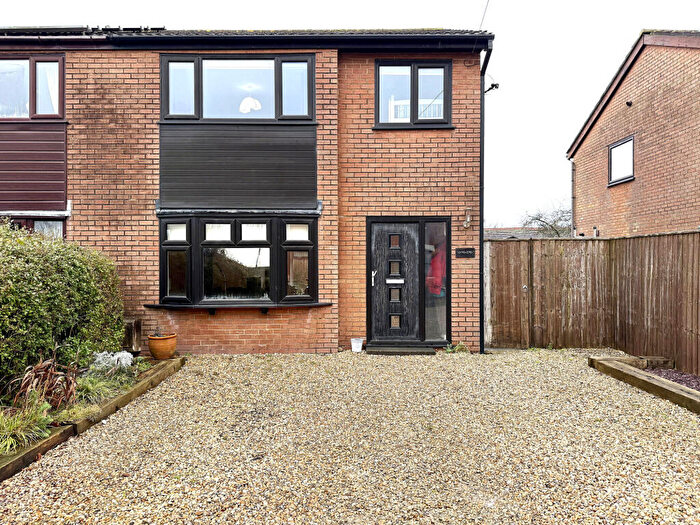
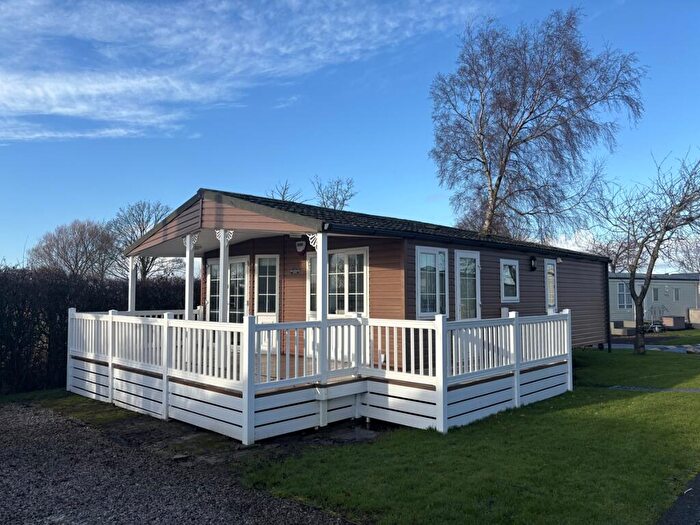
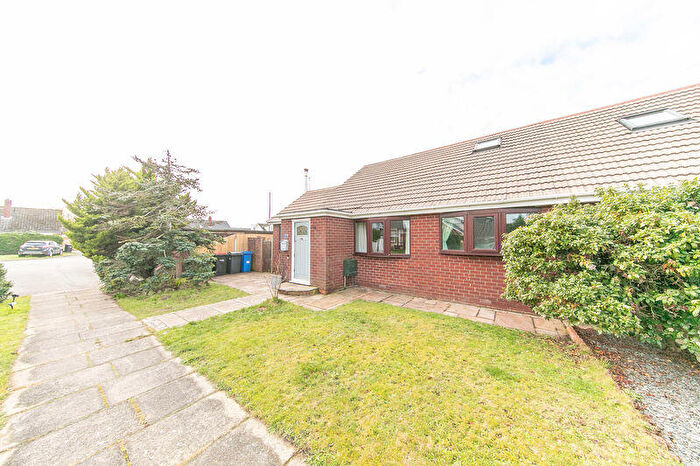
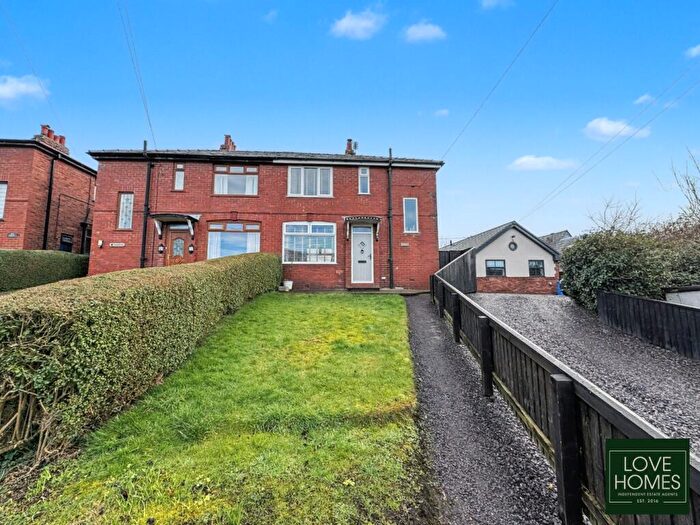
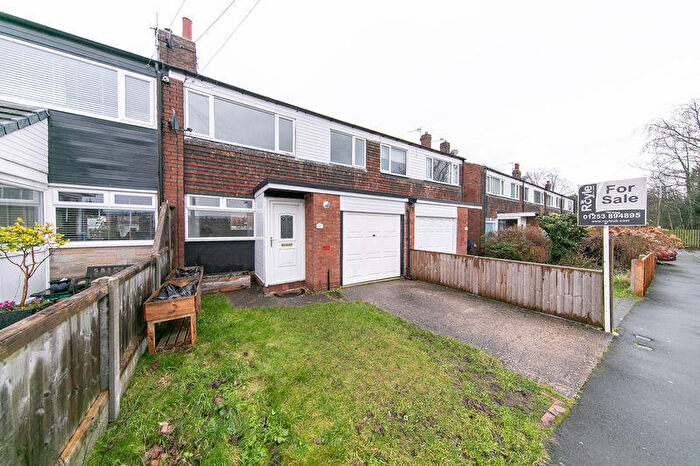
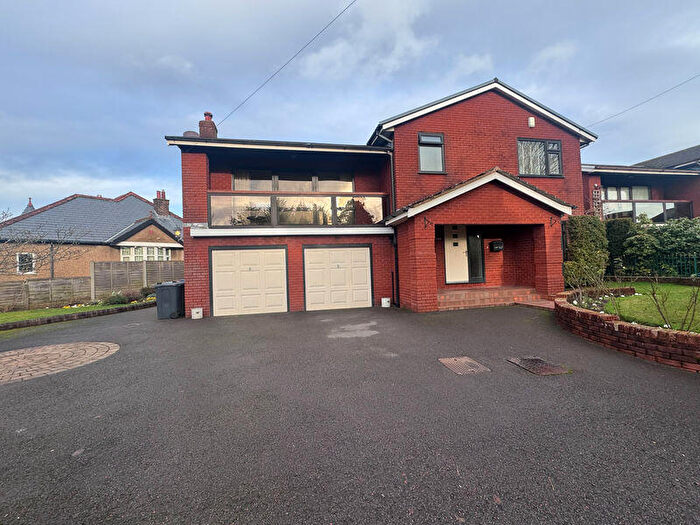
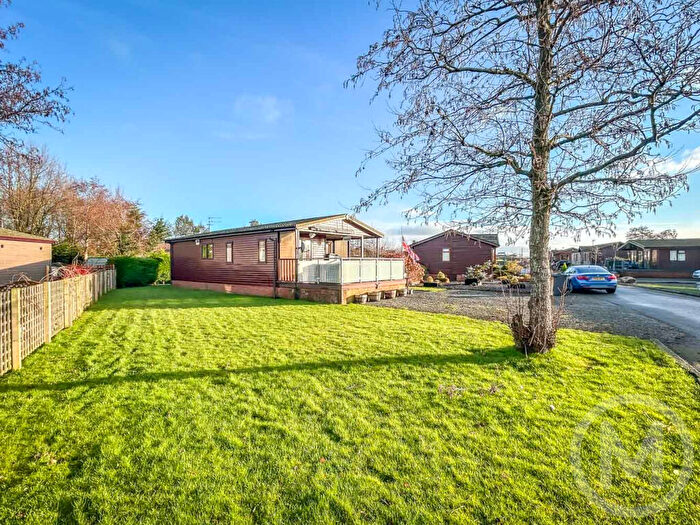
Properties for sale in Pilling
Roads and Postcodes in Pilling
Navigate through our locations to find the location of your next house in Pilling, Preston for sale or to rent.
| Streets | Postcodes |
|---|---|
| Bluebell Close | PR3 6HW |
| Bone Hill Lane | PR3 0LE |
| Bradshaw Lane | PR3 6AY PR3 6SN PR3 6AJ |
| Bradshaw Lane Cottages | PR3 6AX |
| Broadfleet Close | PR3 6BT |
| Carr Close | PR3 6HX |
| Carr Lane | PR3 6HH |
| Chapel Close | PR3 6HF |
| Cherry Tree Close | PR3 6AW |
| Church Lane | PR3 0LA |
| Duck Street | PR3 6HN |
| Field House Lane | PR3 6BG |
| Fluke Hall Lane | PR3 6HA PR3 6HP PR3 6HQ |
| Gardeners Close | PR3 6DA |
| Garstang Road | PR3 6AL PR3 6AQ PR3 6AR PR3 0FU |
| Georges Grove | PR3 6DH |
| Green Dicks Lane | PR3 6HR |
| Head Dyke Lane | PR3 6SD PR3 6SJ |
| Holme Close | PR3 6HY |
| Hooles Lane | PR3 6HU |
| Horse Park Lane | PR3 6AS |
| Island Lane | PR3 0LB |
| Laburnum Cottages | PR3 6AF |
| Lambs Lane | PR3 6SB |
| Lancaster Road | PR3 6AE PR3 6AU PR3 6SQ PR3 6SR PR3 6BF |
| Libby Lane | PR3 6HG |
| Longwood Lane | PR3 6SH |
| May Tree Lane | PR3 6DE |
| Memorial Road | PR3 6DD |
| Morley Lane | PR3 6BY |
| Moss House Lane | PR3 6BX |
| Neds Lane | PR3 6HT |
| New House Lane | PR3 0JT |
| New Lane | PR3 6BA |
| Park Lane | PR3 0JU |
| Poppy Field Way | PR3 6DB |
| School Lane | PR3 0JY PR3 6AA PR3 6HB |
| Shaws Lane | PR3 6SA |
| Skitham Lane | PR3 6BD |
| Smallwood Hey | PR3 6HE PR3 6HJ |
| Smallwood Hey Road | PR3 6BZ |
| St Johns Avenue | PR3 6HD |
| Stakepool Drive | PR3 6BU |
| Tarnbrook Cottages | PR3 6AG |
| Taylors Lane | PR3 6AB |
| Wheel Lane | PR3 6HL |
| Whitters Lane | PR3 0JR |
| Williams Way | PR3 6DG |
| Woods Lane | PR3 6BB |
| PR3 6AH PR3 0JS PR3 6AP PR3 6DF |
Transport near Pilling
-
Poulton-Le-Fylde Station
-
Heysham Port Station
-
Layton Station
-
Lancaster Station
-
Kirkham and Wesham Station
-
Blackpool North Station
- FAQ
- Price Paid By Year
- Property Type Price
Frequently asked questions about Pilling
What is the average price for a property for sale in Pilling?
The average price for a property for sale in Pilling is £306,511. This amount is 37% higher than the average price in Preston. There are 956 property listings for sale in Pilling.
What streets have the most expensive properties for sale in Pilling?
The streets with the most expensive properties for sale in Pilling are Skitham Lane at an average of £583,750, Duck Street at an average of £535,000 and New House Lane at an average of £367,500.
What streets have the most affordable properties for sale in Pilling?
The streets with the most affordable properties for sale in Pilling are Stakepool Drive at an average of £192,900, Bradshaw Lane at an average of £210,000 and Gardeners Close at an average of £226,250.
Which train stations are available in or near Pilling?
Some of the train stations available in or near Pilling are Poulton-Le-Fylde, Heysham Port and Layton.
Property Price Paid in Pilling by Year
The average sold property price by year was:
| Year | Average Sold Price | Price Change |
Sold Properties
|
|---|---|---|---|
| 2025 | £316,063 | 4% |
19 Properties |
| 2024 | £303,655 | 1% |
19 Properties |
| 2023 | £300,150 | -4% |
20 Properties |
| 2022 | £313,651 | 5% |
31 Properties |
| 2021 | £298,958 | 13% |
43 Properties |
| 2020 | £258,782 | 18% |
32 Properties |
| 2019 | £212,682 | -21% |
37 Properties |
| 2018 | £256,397 | -13% |
34 Properties |
| 2017 | £289,982 | 2% |
28 Properties |
| 2016 | £283,332 | 32% |
21 Properties |
| 2015 | £193,050 | -21% |
29 Properties |
| 2014 | £233,263 | 17% |
19 Properties |
| 2013 | £192,956 | -15% |
23 Properties |
| 2012 | £222,058 | 1% |
17 Properties |
| 2011 | £220,222 | -12% |
15 Properties |
| 2010 | £245,957 | 8% |
12 Properties |
| 2009 | £227,272 | -4% |
25 Properties |
| 2008 | £237,244 | -9% |
18 Properties |
| 2007 | £259,095 | 2% |
25 Properties |
| 2006 | £254,973 | -18% |
38 Properties |
| 2005 | £301,202 | 32% |
21 Properties |
| 2004 | £206,050 | -1% |
29 Properties |
| 2003 | £208,742 | 34% |
35 Properties |
| 2002 | £138,668 | 6% |
41 Properties |
| 2001 | £129,997 | 21% |
38 Properties |
| 2000 | £102,526 | 20% |
26 Properties |
| 1999 | £82,416 | -2% |
18 Properties |
| 1998 | £84,043 | 15% |
23 Properties |
| 1997 | £71,035 | -3% |
27 Properties |
| 1996 | £73,500 | -11% |
21 Properties |
| 1995 | £81,261 | - |
21 Properties |
Property Price per Property Type in Pilling
Here you can find historic sold price data in order to help with your property search.
The average Property Paid Price for specific property types in the last three years are:
| Property Type | Average Sold Price | Sold Properties |
|---|---|---|
| Semi Detached House | £248,523.00 | 28 Semi Detached Houses |
| Detached House | £399,804.00 | 23 Detached Houses |
| Terraced House | £231,928.00 | 7 Terraced Houses |

