
Houses for sale & to rent in Newburgh, Wigan
House Prices in Newburgh
Properties in Newburgh have an average house price of £357k and had 35 Property Transactions within the last 3 years¹.
Newburgh is an area in Wigan, Lancashire with 432 households², where the most expensive property was sold for £645k.
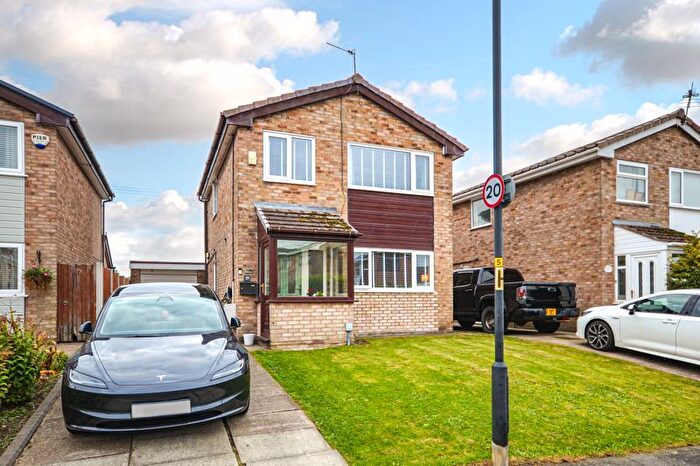
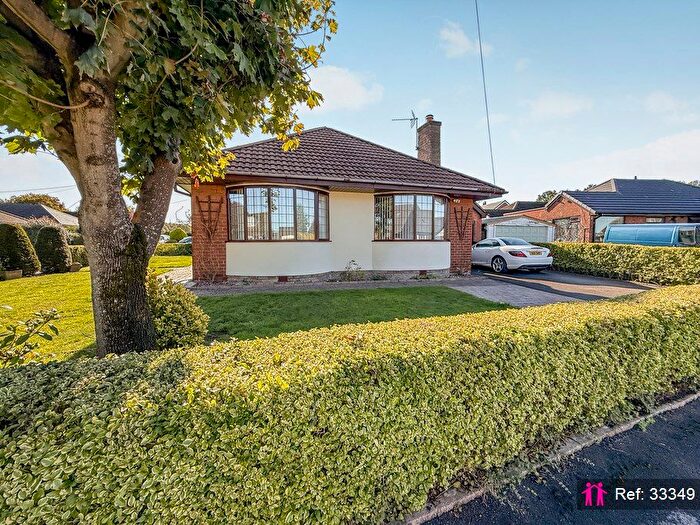
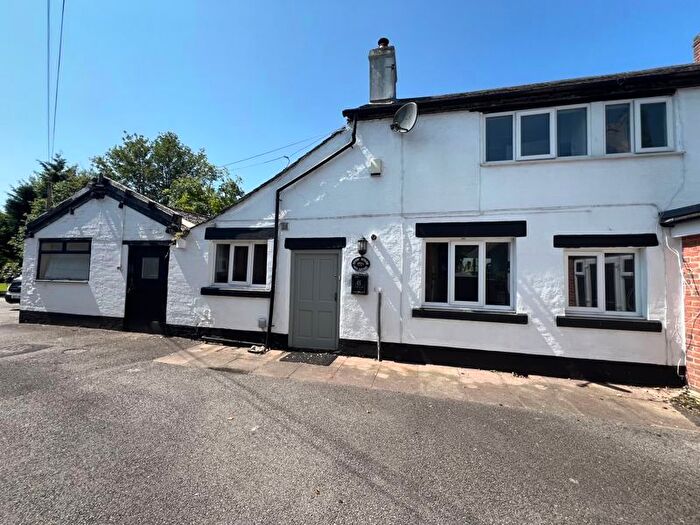
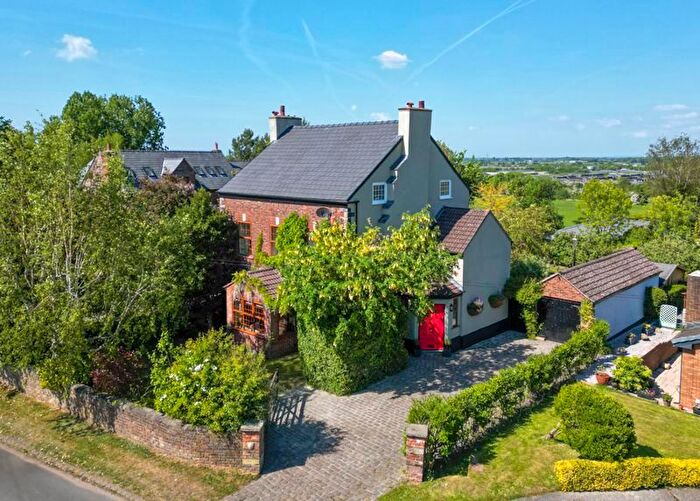
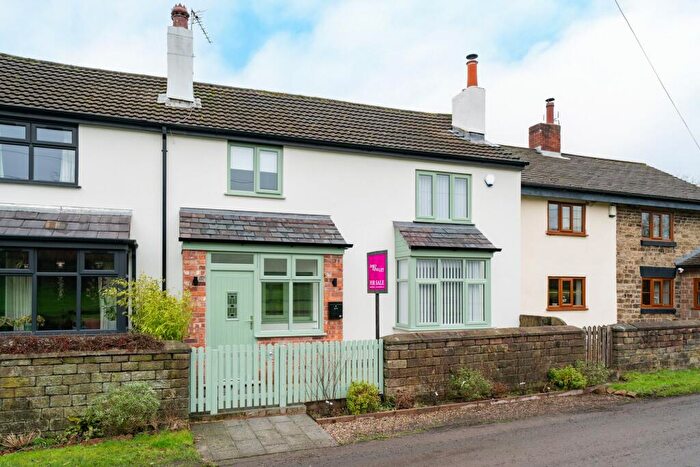
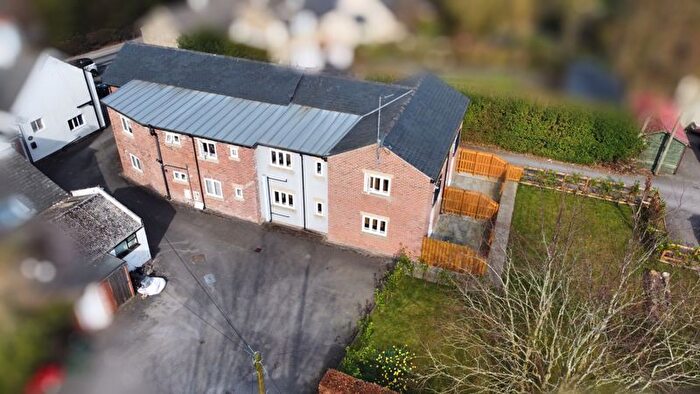
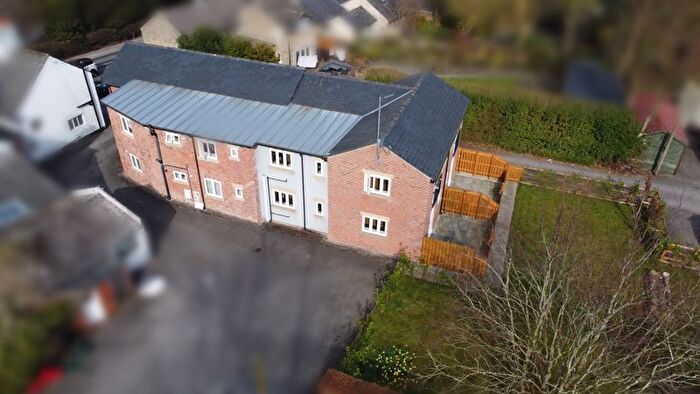
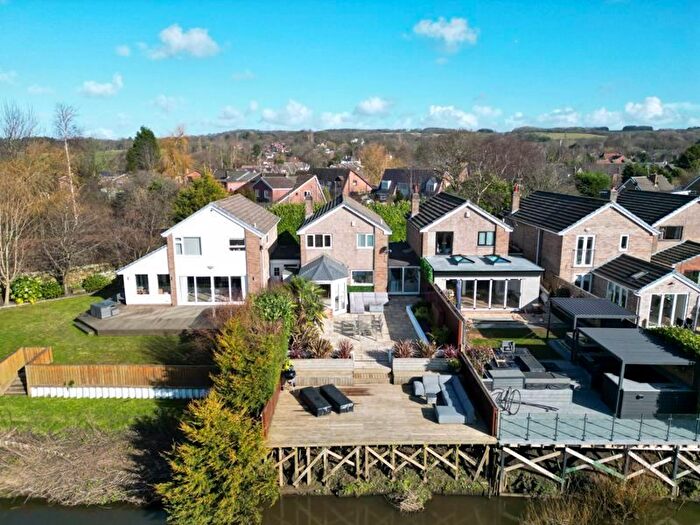
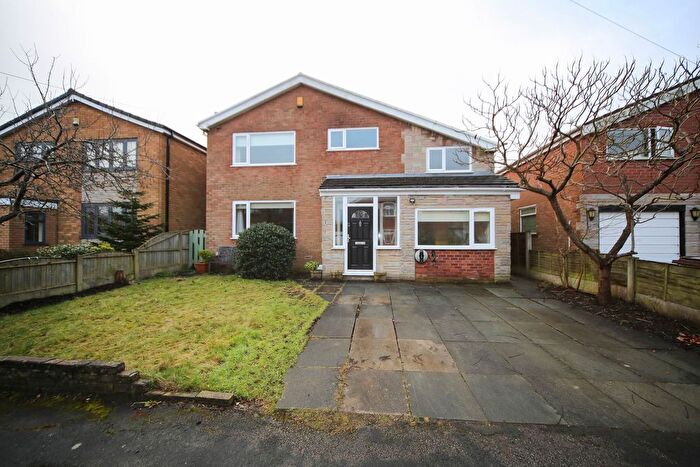
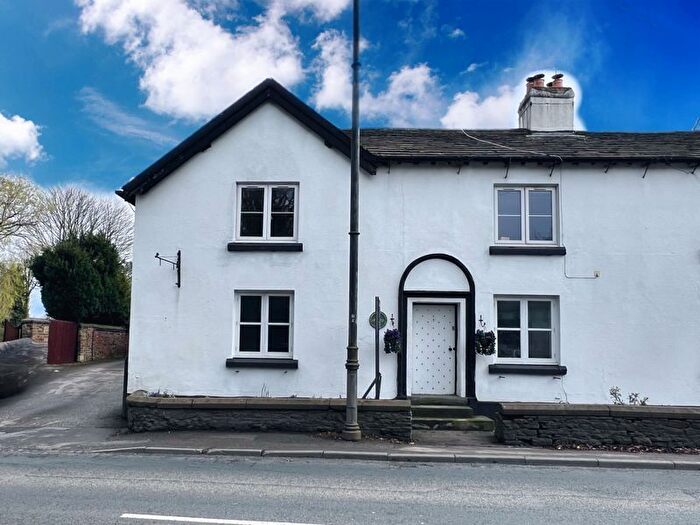
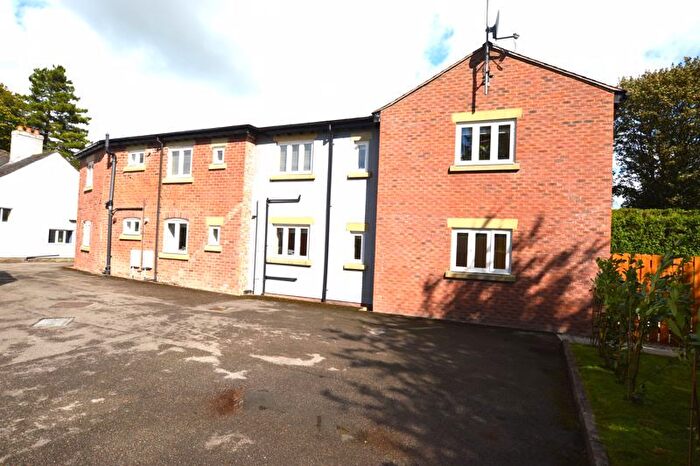
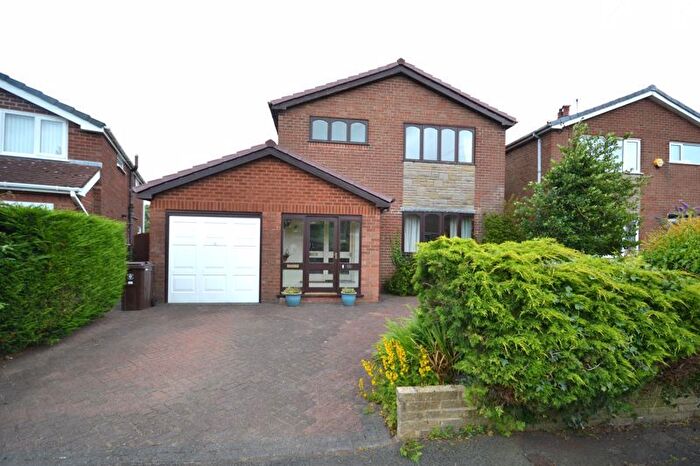
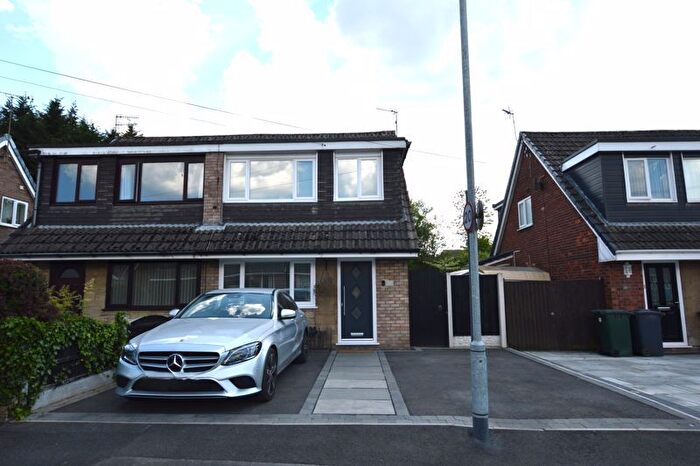
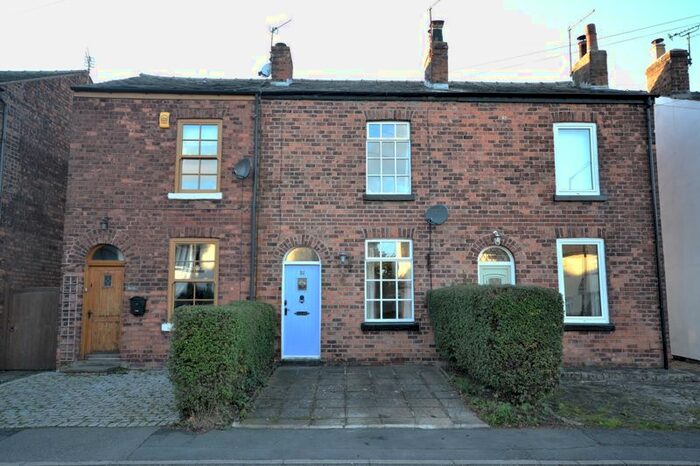
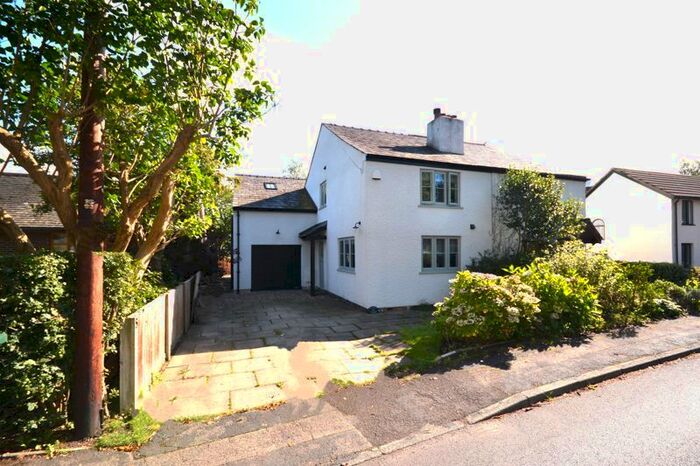
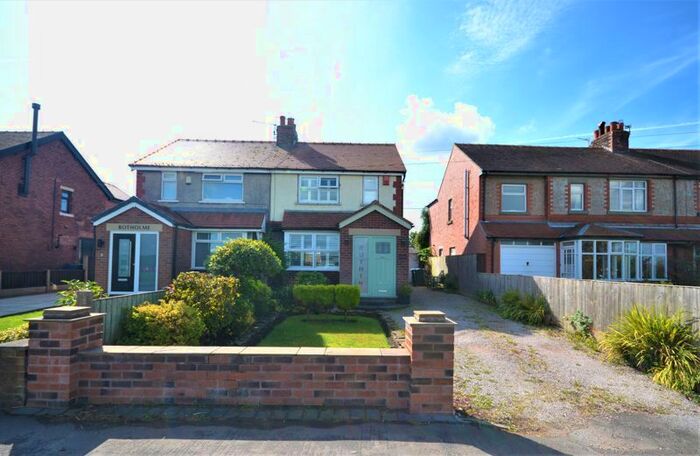
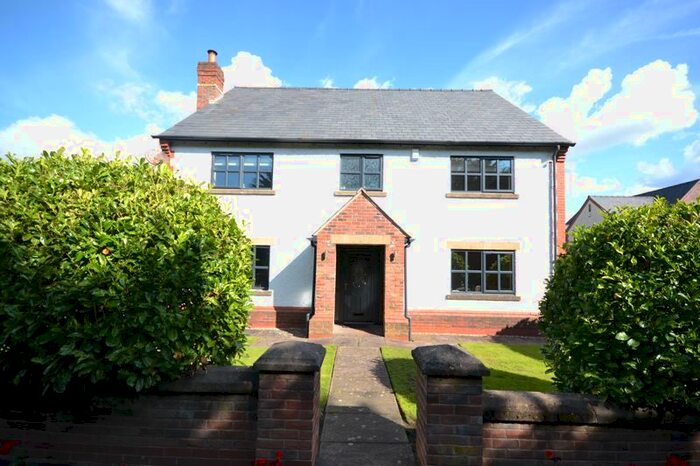
Previously listed properties in Newburgh
![]()
If you are looking to sell your house, let it out, or receive a property valuation, an expert can help you.
Click the button below to get started.


Roads and Postcodes in Newburgh
Navigate through our locations to find the location of your next house in Newburgh, Wigan for sale or to rent.
| Streets | Postcodes |
|---|---|
| Acrefield | WN8 7LJ |
| Ash Brow | WN8 7NF WN8 7NG |
| Back Lane | WN8 7UQ WN8 7UW WN8 7XB |
| Beacon Lane | WN8 7SD |
| Cinnamon Nook | WN8 7UN |
| Clovelly Drive | WN8 7LY |
| Cobbs Brow Lane | WN8 7NB WN8 7ND WN8 7SF |
| Course Lane | WN8 7LA WN8 7UB WN8 7UG WN8 7XD |
| Culvert Lane | WN8 7XA |
| Deans Lane | WN8 7UT |
| Doe Meadow | WN8 7LH WN8 7LZ |
| Ferrett Lane | WN8 7XF |
| New Acres | WN8 7TU |
| Pine Close | WN8 7LD |
| Ranleigh Drive | WN8 7NA |
| Sandy Close | WN8 7UY |
| Sandy Lane | WN8 7TT |
| Smithy Brow | WN8 7NE |
| Spencers Bridge | WN8 7UH |
| Tabbys Nook | WN8 7LN |
| Tears Lane | WN8 7UA |
| The Hawthorns | WN8 7LL |
| Woodrow Drive | WN8 7LB |
Transport near Newburgh
-
 Parbold Station
 -
Hoscar Station
-
Burscough Junction Station
-
Burscough Bridge Station
-
Appley Bridge Station
- FAQ
- Price Paid By Year
- Property Type Price
Frequently asked questions about Newburgh
What is the average price for a property for sale in Newburgh?
The average price for a property for sale in Newburgh is £356,714. This amount is 0.8% lower than the average price in Wigan. There are 38 property listings for sale in Newburgh.
What streets have the most expensive properties for sale in Newburgh?
The streets with the most expensive properties for sale in Newburgh are Back Lane at an average of £485,666, Sandy Lane at an average of £458,333 and Ash Brow at an average of £442,500.
What streets have the most affordable properties for sale in Newburgh?
The streets with the most affordable properties for sale in Newburgh are Cobbs Brow Lane at an average of £226,250, Doe Meadow at an average of £300,000 and Clovelly Drive at an average of £305,666.
Which train stations are available in or near Newburgh?
Some of the train stations available in or near Newburgh are Parbold, Hoscar and Burscough Junction.
Property Price Paid in Newburgh by Year
The average sold property price by year was:
| Year | Average Sold Price | Price Change |
Sold Properties
|
|---|---|---|---|
| 2025 | £319,600 | -9% |
5 Properties |
| 2024 | £349,138 | -10% |
18 Properties |
| 2023 | £383,541 | -10% |
12 Properties |
| 2022 | £423,307 | 23% |
13 Properties |
| 2021 | £326,475 | 5% |
20 Properties |
| 2020 | £310,791 | 21% |
12 Properties |
| 2019 | £244,863 | 0,2% |
18 Properties |
| 2018 | £244,333 | -7% |
15 Properties |
| 2017 | £261,208 | 3% |
23 Properties |
| 2016 | £252,200 | 17% |
15 Properties |
| 2015 | £209,525 | -21% |
15 Properties |
| 2014 | £252,878 | 12% |
23 Properties |
| 2013 | £223,291 | 10% |
12 Properties |
| 2012 | £201,142 | -29% |
7 Properties |
| 2011 | £260,170 | 12% |
17 Properties |
| 2010 | £230,146 | 7% |
13 Properties |
| 2009 | £213,980 | -7% |
5 Properties |
| 2008 | £229,086 | -13% |
11 Properties |
| 2007 | £257,933 | -22% |
15 Properties |
| 2006 | £315,270 | 19% |
20 Properties |
| 2005 | £256,666 | -14% |
12 Properties |
| 2004 | £292,272 | 39% |
11 Properties |
| 2003 | £176,950 | 22% |
13 Properties |
| 2002 | £138,074 | 21% |
25 Properties |
| 2001 | £109,429 | -10% |
11 Properties |
| 2000 | £120,358 | 6% |
18 Properties |
| 1999 | £112,886 | 26% |
19 Properties |
| 1998 | £83,012 | 8% |
12 Properties |
| 1997 | £76,757 | -35% |
19 Properties |
| 1996 | £103,624 | 13% |
18 Properties |
| 1995 | £89,979 | - |
12 Properties |
Property Price per Property Type in Newburgh
Here you can find historic sold price data in order to help with your property search.
The average Property Paid Price for specific property types in the last three years are:
| Property Type | Average Sold Price | Sold Properties |
|---|---|---|
| Semi Detached House | £323,147.00 | 17 Semi Detached Houses |
| Terraced House | £206,666.00 | 3 Terraced Houses |
| Detached House | £424,766.00 | 15 Detached Houses |