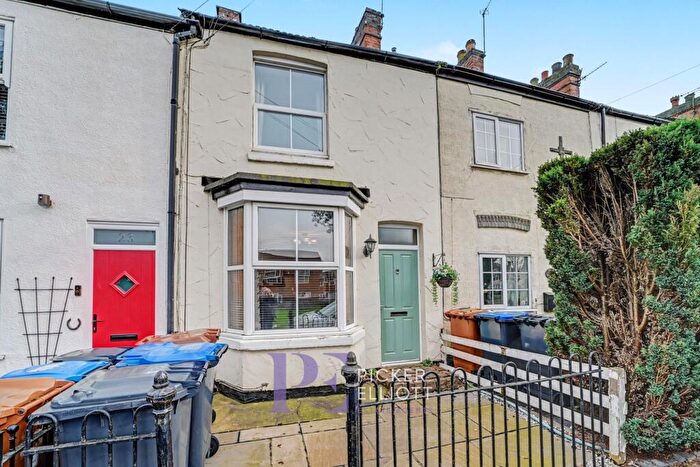
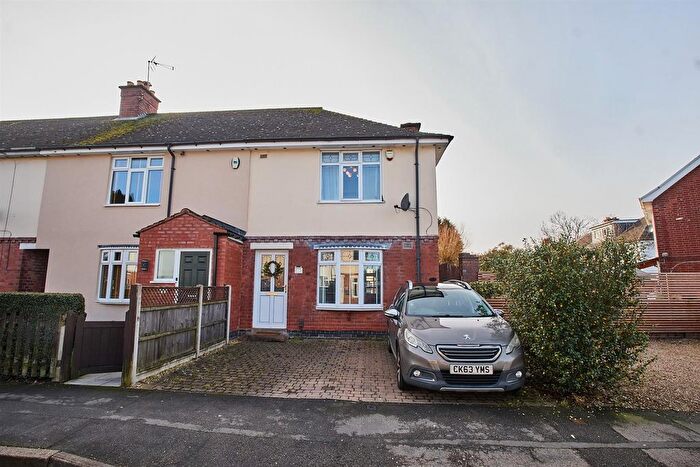
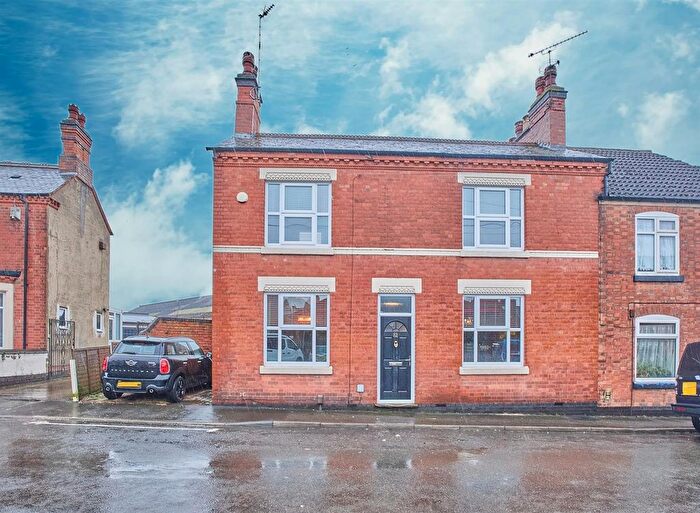
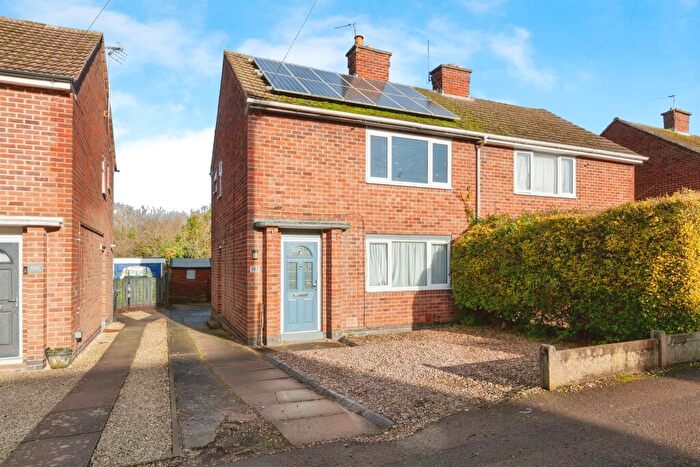
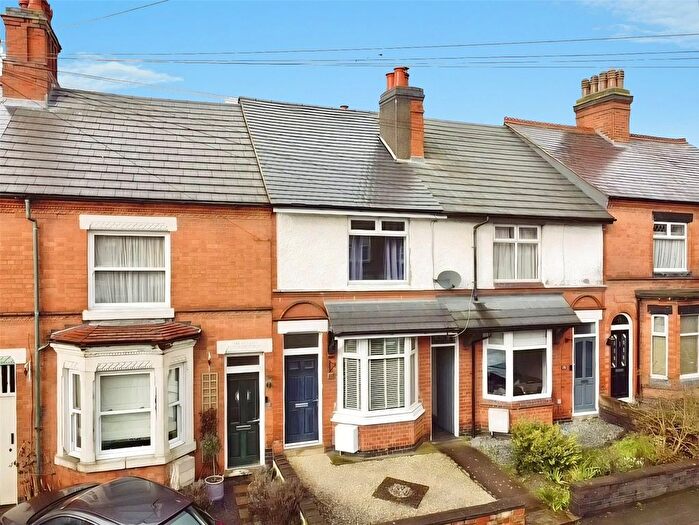
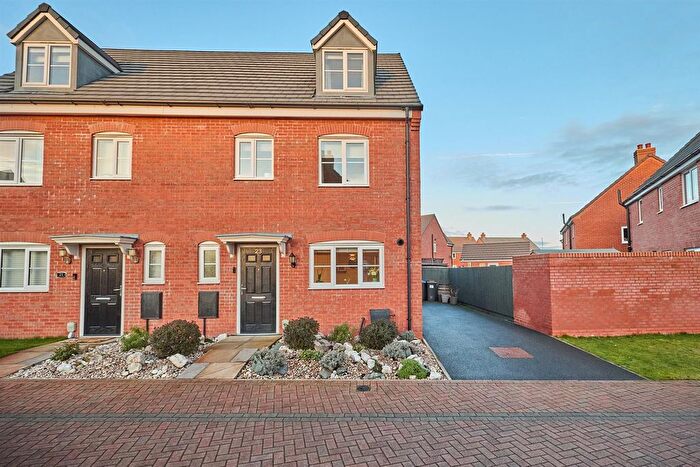
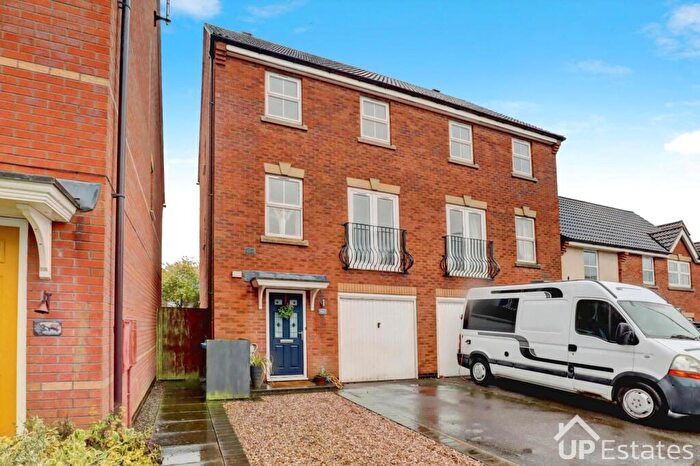
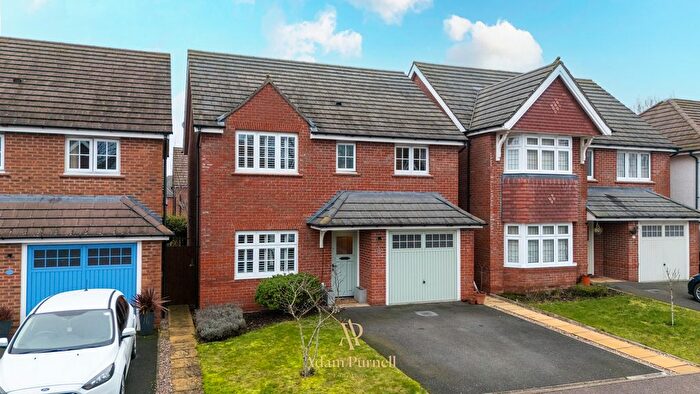
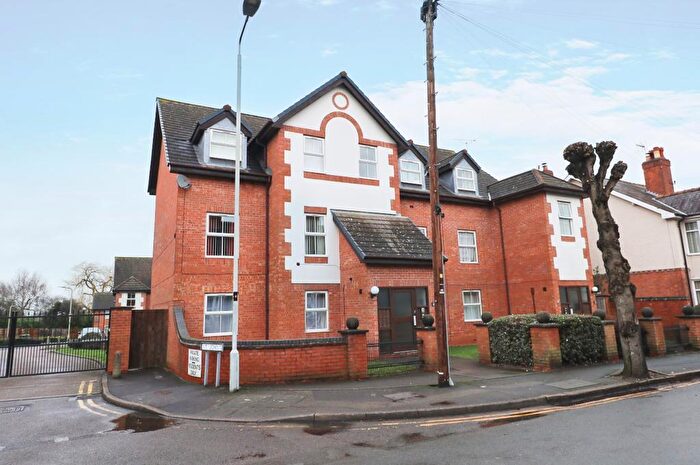
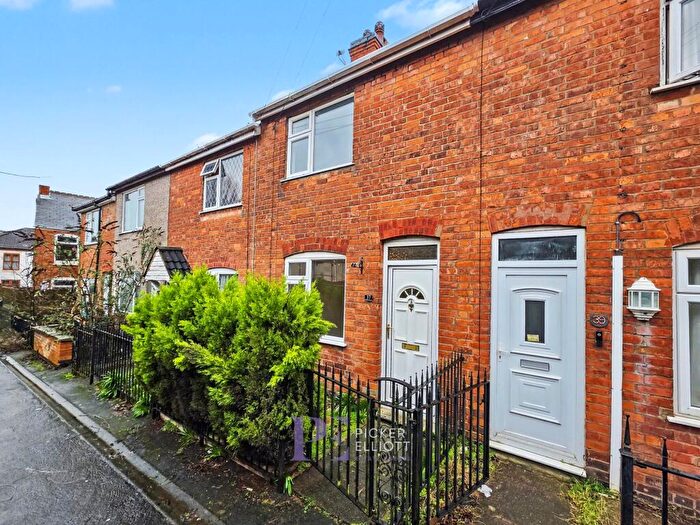
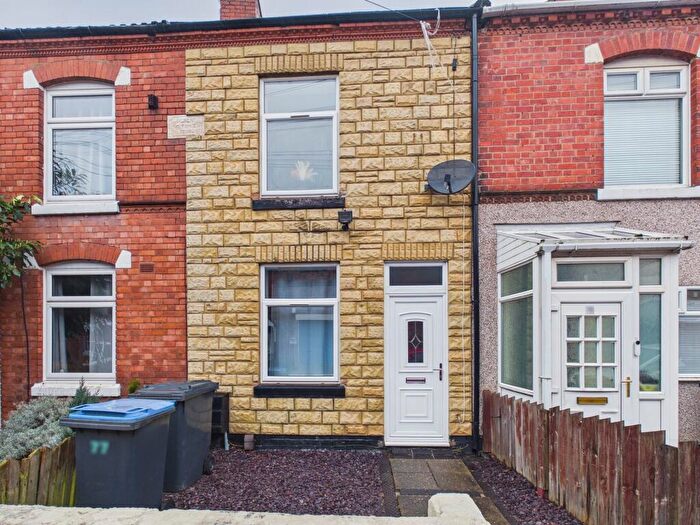
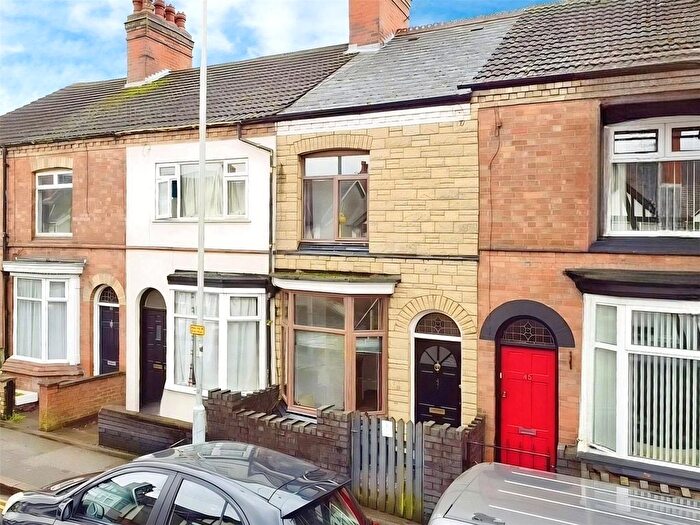
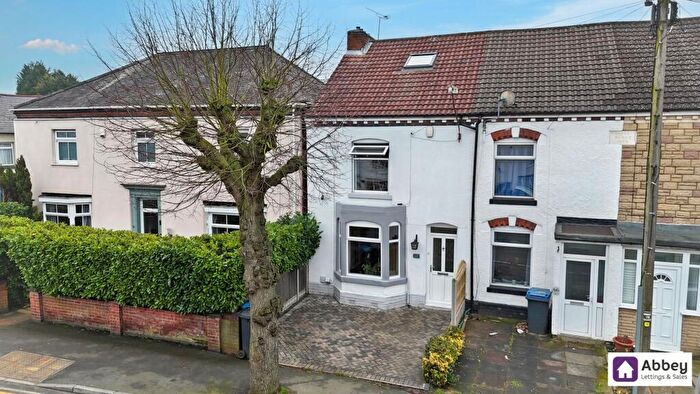
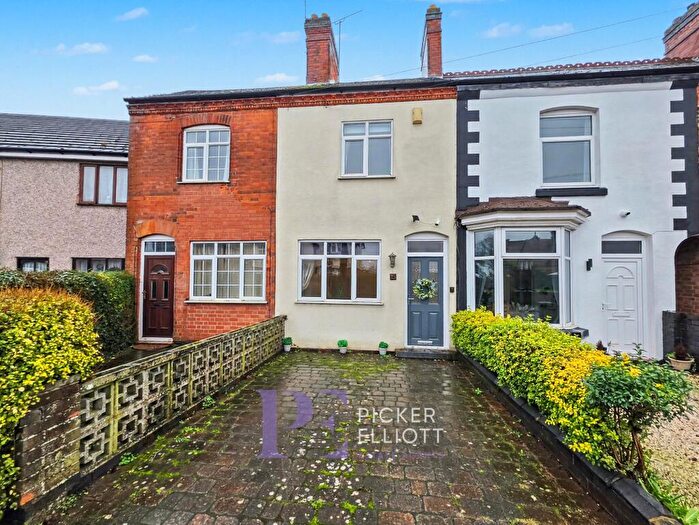
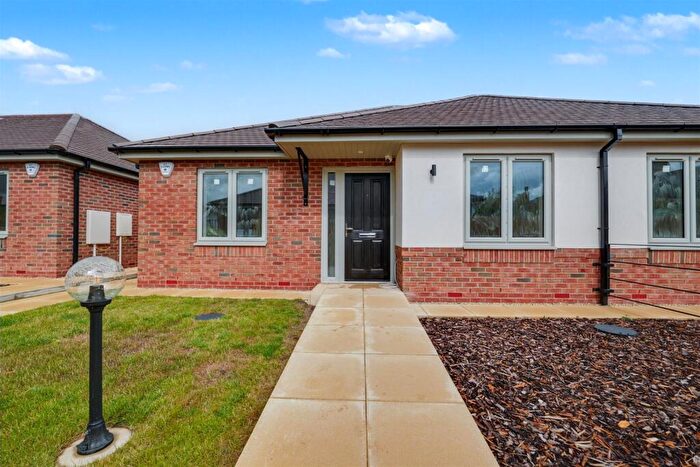
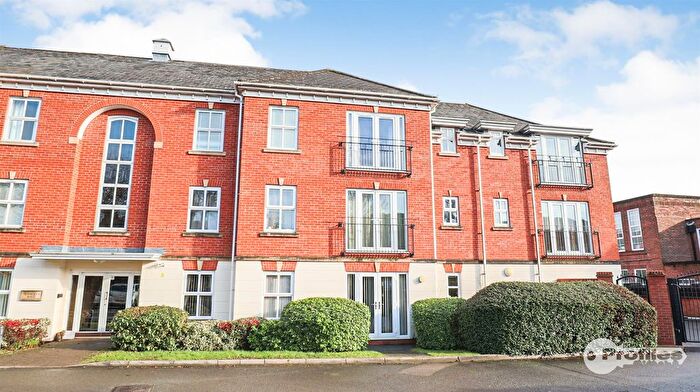
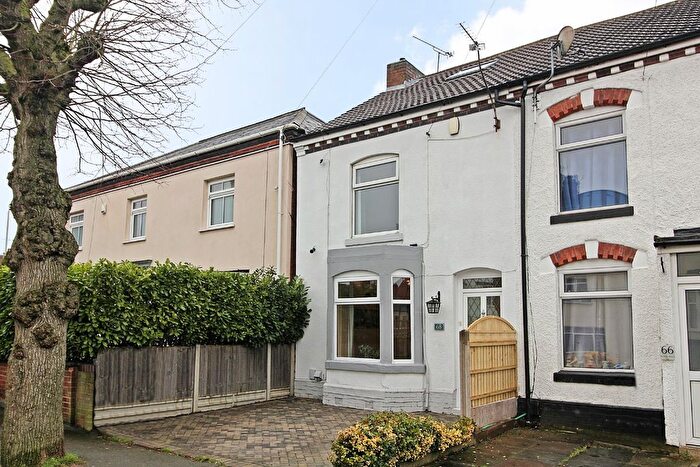
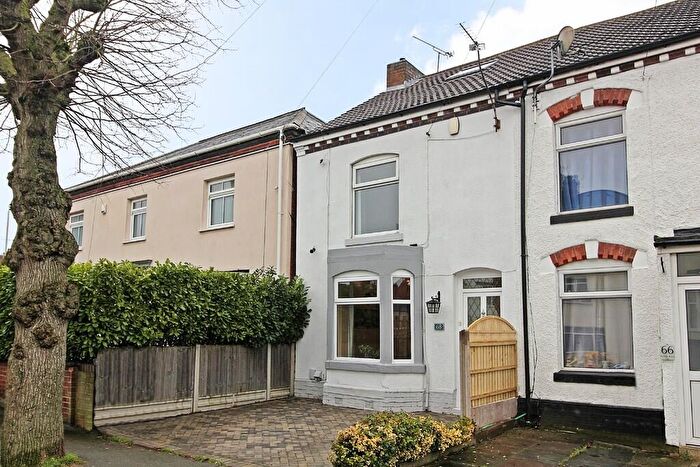
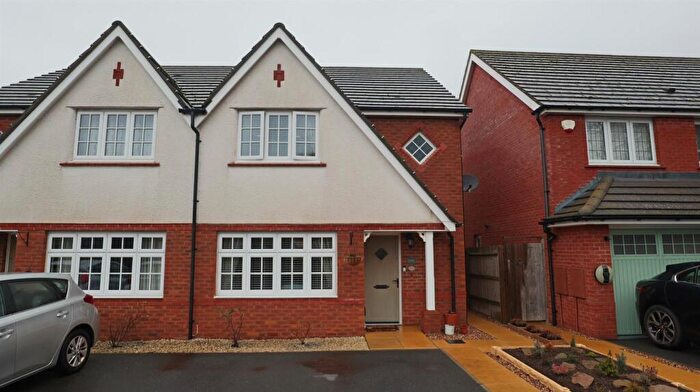
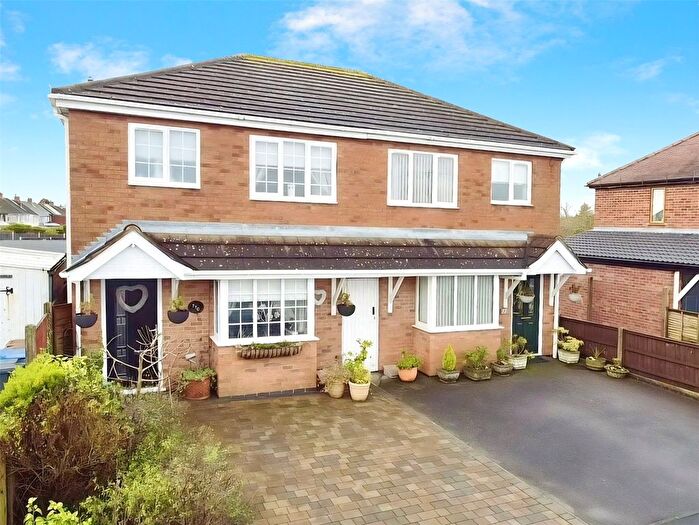
Houses for sale & to rent in Hinckley Castle, Hinckley


House Prices in Hinckley Castle

Properties in Hinckley Castle have an average house price of £208,852.00 and had 545 Property Transactions within the last 3 years¹.
Hinckley Castle is an area in Hinckley, Leicestershire with 2,762 households², where the most expensive property was sold for £725,000.00.


Properties for sale in Hinckley Castle

icon

Be the first to know about new property listings

Save this search to be notified as soon as new listings are available.


Roads and Postcodes in Hinckley Castle

Navigate through our locations to find the location of your next house in Hinckley Castle, Hinckley for sale or to rent.

Streets Postcodes
Argents Mead LE10 1FL
Arran Way LE10 0UA
Bennett Close LE10 1BJ
Blockleys Yard LE10 0AG
Bradley Row LE10 1BF
Brandon Road LE10 0JW
Brick Kiln Street LE10 0NA
Britannia Centre LE10 1RU
Browning Drive LE10 0SH
Brunel Road LE10 0AA
Brunel Road West LE10 0ZH
Bute Close LE10 0SJ
Canning Street LE10 0AQ
Castle Street LE10 1DA LE10 1DD LE10 1DB
Chessher Street LE10 0AH
Church Walk LE10 1DN LE10 1DW
Churchmead Court LE10 1FH
Clarence Road LE10 1BL LE10 1DP LE10 1DR
Clarendon Road LE10 0PJ LE10 0PL
Cleveland Road LE10 0AJ
Coley Close LE10 1AA
Coventry Road LE10 0JT LE10 0JR
Davenport Terrace LE10 1EZ
Edwards Centre LE10 0BB
Elizabeth Coxhead Gardens LE10 0AY LE10 0RR
Fabius Close LE10 0GS
Ferry Pickering Close LE10 0YN
Friary Close LE10 1HD
George Street LE10 0AL
Gladstone Terrace LE10 1HE LE10 1HP
Granby Close LE10 0PN
Granby Road LE10 0PW
Granville Gardens LE10 0JD
Granville Road LE10 0PP
Hansom Court LE10 1NG
Hawley Road LE10 0PR
Hill Street LE10 1DS LE10 1DT LE10 1DX
Hollycroft LE10 0HE
Hollycroft Crescent LE10 0HH
Hurst Road LE10 1AB
Lancaster Road LE10 0AT LE10 0AW
Lanfear Court LE10 0GT
Linden Road LE10 0AR
Lismore Drive LE10 0SR
London Road LE10 1HH LE10 1HQ LE10 1HR
Lower Bond Street LE10 1QU
Manor Court LE10 0AP
Manor Street LE10 0AS
Mansion Street LE10 0AU LE10 0BP
Marchant Road LE10 0LQ
Market Place LE10 1NT LE10 1NU
Mason Court LE10 0JY
Merevale Avenue LE10 0PX LE10 0PY
Merevale Close LE10 0PZ
Mill Hill Road LE10 0AX
Milton Close LE10 0ST
Mistral Close LE10 1XH
Mount Road LE10 1AD LE10 1AE LE10 1AF LE10 1AG LE10 1AY
New Buildings LE10 1HN
Northfield Road LE10 0LH LE10 0LJ
Orchard Street LE10 1DZ
Orkney Close LE10 0TA
Park Road LE10 1HT
Parsons Lane LE10 1XT
Pentland Close LE10 0UE
Porter Close LE10 0YP
Priesthills Road LE10 1AH LE10 1AJ LE10 1AL LE10 1AQ
Princess Road LE10 1EA LE10 1EB
Priory Walk LE10 1HU LE10 1JR LE10 1JT
Queens Park Court LE10 1GZ
Queens Park Flats LE10 1HX
Queens Park Terrace LE10 1HY
Queens Road LE10 1ED LE10 1EE LE10 1EF
Regent Court LE10 0AD
Regent Street LE10 0BA LE10 0AZ
Rieth Close LE10 0YR
Rugby Road LE10 0QA LE10 0QB LE10 0QD LE10 0QE LE10 0FR LE10 9SA LE10 9SB LE10 9SD LE10 9SE LE10 9SF LE10 9SG LE10 9SH LE10 9SJ LE10 9SL LE10 9SN LE10 9SP LE10 9SQ LE10 9SR LE10 9SS LE10 9ST LE10 9SU LE10 9SW LE10 9SX LE10 9SZ LE10 9TA LE10 9TB LE10 9TD LE10 9TE LE10 9TF LE10 9TG LE10 9TH LE10 9WL LE10 9WN LE10 9WP LE10 9WQ LE10 9WR LE10 9WS LE10 9WT LE10 9WU LE10 9WW LE10 9WX LE10 9ZY LE10 9ZZ LE10 9RT LE10 9RU LE10 9RW LE10 9RX LE10 9RY LE10 9RZ LE10 9TJ LE10 9TL LE10 9TN LE10 9TP LE10 9TQ LE10 9TR LE10 9TS LE10 9TT LE10 9TU LE10 9TW LE10 9TX LE10 9TY LE10 9TZ LE10 9UA LE10 9UB LE10 9UD LE10 9UE LE10 9UF LE10 9UG LE10 9UH
Rutland Avenue LE10 0QH
Sandy Crescent LE10 0TG
Shakespeare Drive LE10 0BG
Short Way LE10 0YS
Southfield Road LE10 1RF LE10 1TR LE10 1UA LE10 1UB LE10 1UD LE10 1UF LE10 1UG LE10 1US
Spa Lane LE10 1JB
Springfield Road LE10 1AN
St Georges Avenue LE10 0TE LE10 0TF
St Marys Road LE10 1EQ
Station Road LE10 1AP LE10 1AW LE10 1AR LE10 1AT LE10 1BA LE10 1BH
Station Yard LE10 1UE
Stockwell Head LE10 1RD
Stockwell Road LE10 1RG
Swinburne Road LE10 0TQ
Tennyson Road LE10 0TH
The Borough LE10 1NL LE10 1NN LE10 1NR LE10 1NS
The Crescent LE10 0QQ
The Grove LE10 0JZ
The Horsefair LE10 0AE LE10 0AN
The Lawns LE10 1DY LE10 1BN
The Narrows LE10 1EH
Thornfield Way LE10 1BE
Thornycroft Road LE10 1BG LE10 1BQ
Trinity Court LE10 0BY
Trinity Lane LE10 0BH LE10 0BJ LE10 0BQ LE10 0BS LE10 0BT LE10 0BL
Trinity Vicarage Road LE10 0BU LE10 0BX
Waterloo Road LE10 0QJ
Westfield Road LE10 0QN LE10 0QW
Westray Drive LE10 0TL
Willowbank Close LE10 0ZW LE10 0ZX
Willowbank Road LE10 0QF LE10 0QP
Wood Street LE10 1JQ
Wood Street Close LE10 1JS
LE10 1WL LE10 1WZ LE10 1YL LE10 1ZL LE10 3ZT LE10 9DQ LE10 9DS LE10 9EG LE10 9EJ LE10 9EL LE10 9EU LE10 9FH LE10 9FN LE10 9FP LE10 9FW LE10 9FX LE10 9GD LE10 9GE LE10 9GH LE10 9GJ LE10 9GL LE10 9GN LE10 9GP LE10 9GQ LE10 9GR LE10 9GS LE10 9GT LE10 9GU LE10 9YZ LE10 9GZ LE10 9HE LE10 9HF

Transport near Hinckley Castle

Frequently asked questions about Hinckley Castle


What is the average price for a property for sale in Hinckley Castle?

The average price for a property for sale in Hinckley Castle is £208,852. This amount is 20% lower than the average price in Hinckley. There are 1,722 property listings for sale in Hinckley Castle.


What streets have the most expensive properties for sale in Hinckley Castle?

The streets with the most expensive properties for sale in Hinckley Castle are Thornfield Way at an average of £467,500, Spa Lane at an average of £412,500 and Springfield Road at an average of £387,406.


What streets have the most affordable properties for sale in Hinckley Castle?

The streets with the most affordable properties for sale in Hinckley Castle are Granville Gardens at an average of £86,500, Trinity Court at an average of £115,666 and Mason Court at an average of £128,700.


Which train stations are available in or near Hinckley Castle?

Some of the train stations available in or near Hinckley Castle are Hinckley, Nuneaton and Bermuda Park.


Property Price Paid in Hinckley Castle by Year

The average sold property price by year was:

Year Average Sold Price Price Change
Sold Properties icon
2024 £210,690
icon
-9%
71 Properties
2023 £230,006
icon
10%
122 Properties
2022 £206,733
icon
5%
160 Properties
2021 £196,495
icon
3%
192 Properties
2020 £191,082
icon
10%
107 Properties
2019 £172,311
icon
-5%
139 Properties
2018 £180,148
icon
-2%
147 Properties
2017 £184,491
icon
7%
207 Properties
2016 £170,949
icon
15%
245 Properties
2015 £145,967
icon
12%
190 Properties
2014 £128,431
icon
9%
132 Properties
2013 £117,148
icon
2%
120 Properties
2012 £114,755
icon
-7%
70 Properties
2011 £123,109
icon
0,1%
66 Properties
2010 £122,927
icon
-4%
67 Properties
2009 £127,363
icon
-6%
53 Properties
2008 £134,498
icon
-3%
87 Properties
2007 £138,106
icon
6%
179 Properties
2006 £130,353
icon
5%
210 Properties
2005 £124,111
icon
5%
200 Properties
2004 £118,478
icon
5%
187 Properties
2003 £112,172
icon
27%
191 Properties
2002 £82,182
icon
15%
209 Properties
2001 £69,540
icon
8%
201 Properties
2000 £63,688
icon
15%
181 Properties
1999 £54,164
icon
9%
168 Properties
1998 £49,400
icon
11%
155 Properties
1997 £43,929
icon
1%
142 Properties
1996 £43,400
icon
-3%
136 Properties
1995 £44,585
-
110 Properties
Source: Land Registry

Property Price per Property Type in Hinckley Castle

Here you can find historic sold price data in order to help with your property search.

The average Property Paid Price for specific property types in the last three years are:

Property Type Average Sold Price Sold Properties
Flat £130,769.00 106 Flats
Semi Detached House £235,263.00 149 Semi Detached Houses
Terraced House £182,486.00 209 Terraced Houses
Detached House £330,480.00 81 Detached Houses
Source: Land Registry