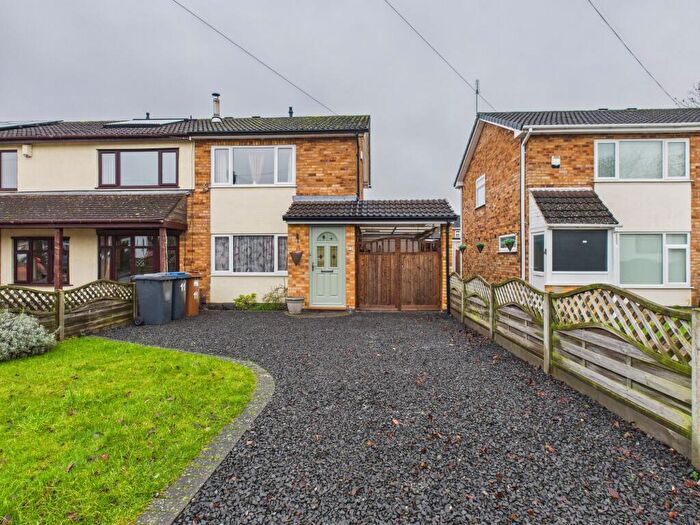
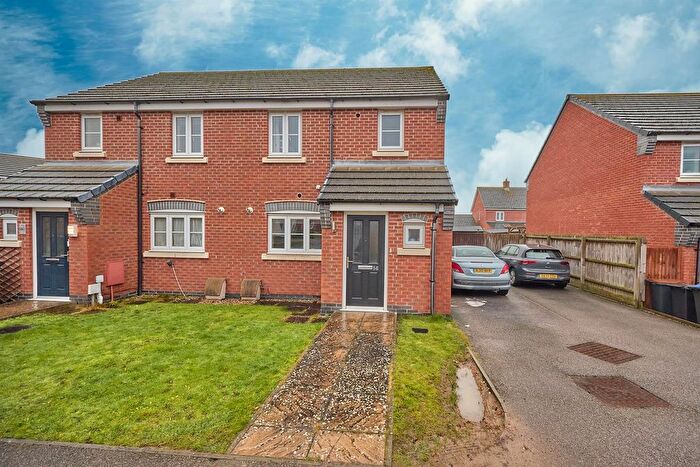
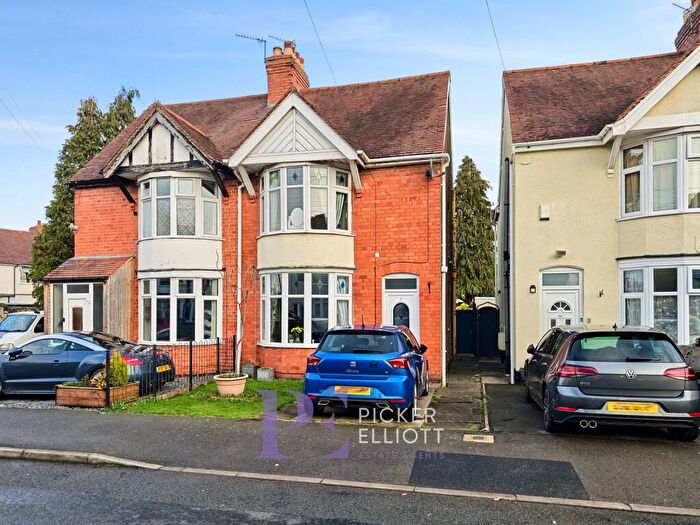
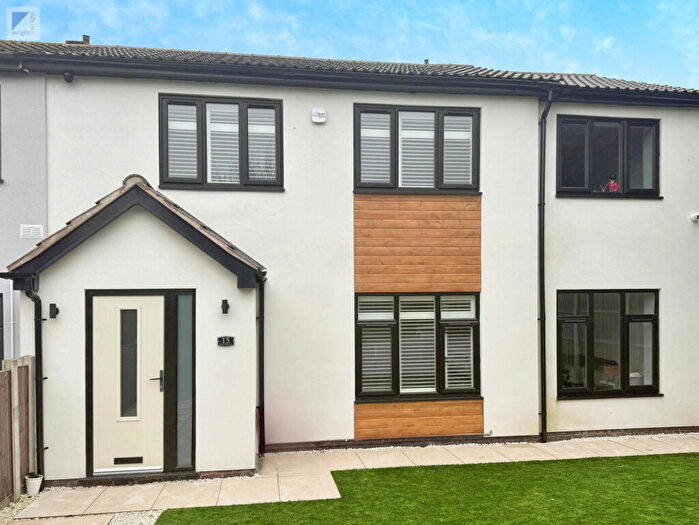
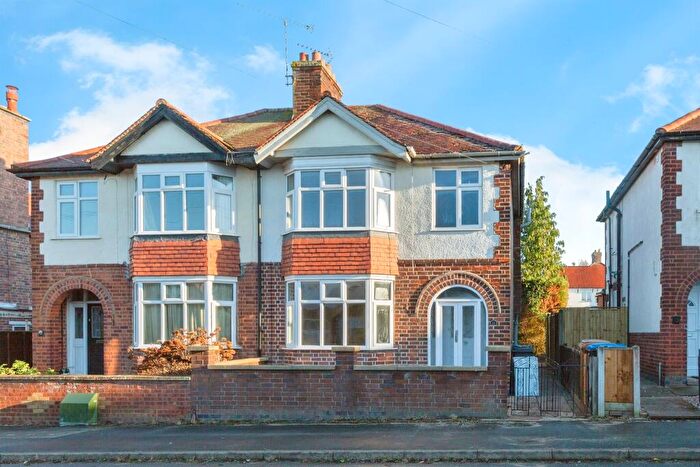
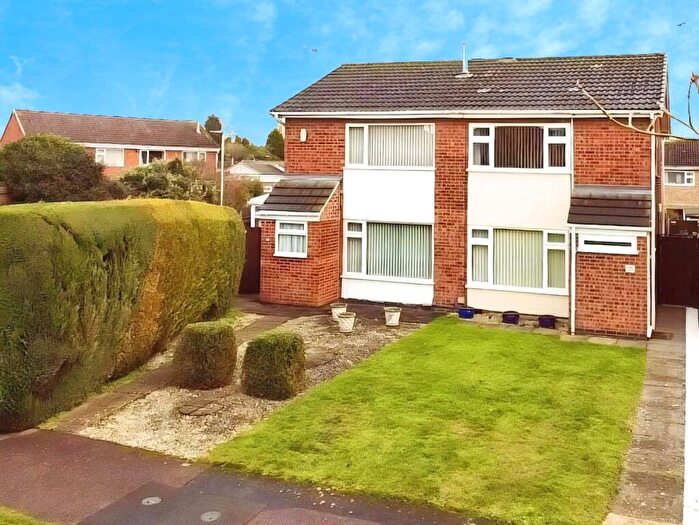
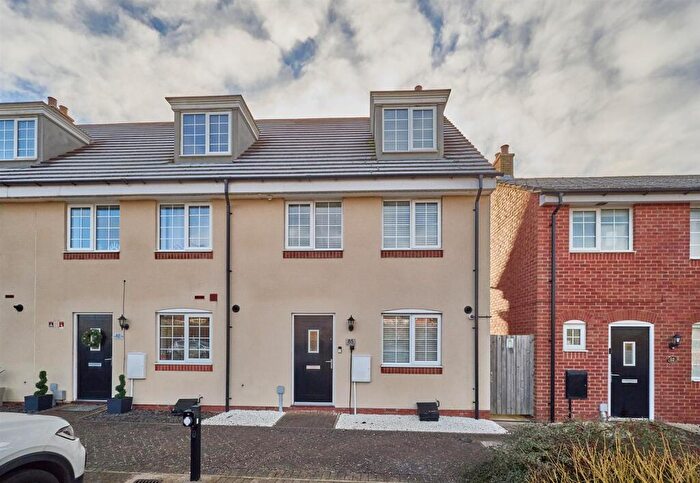
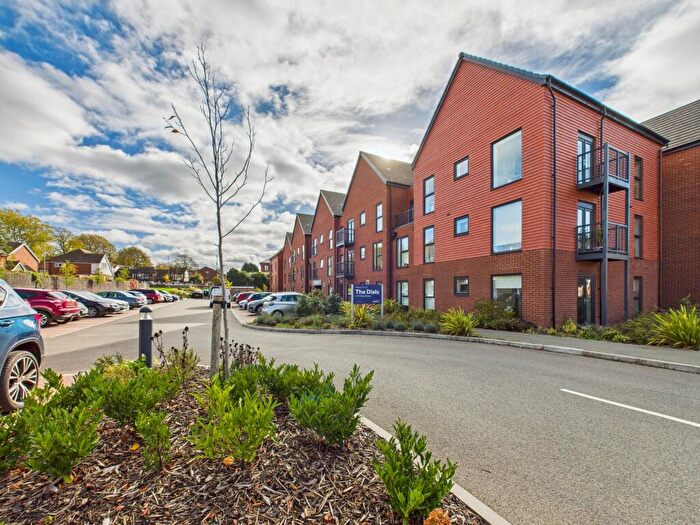
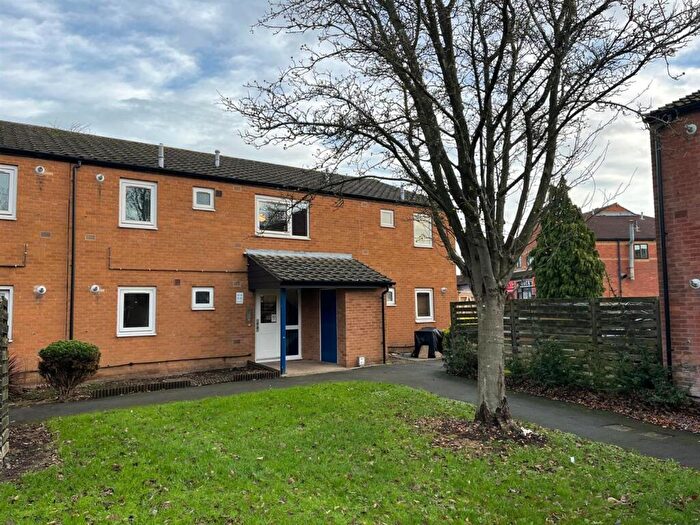
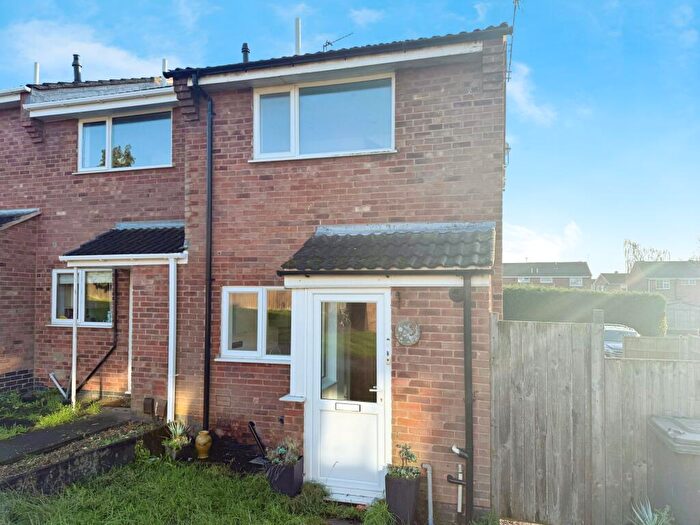
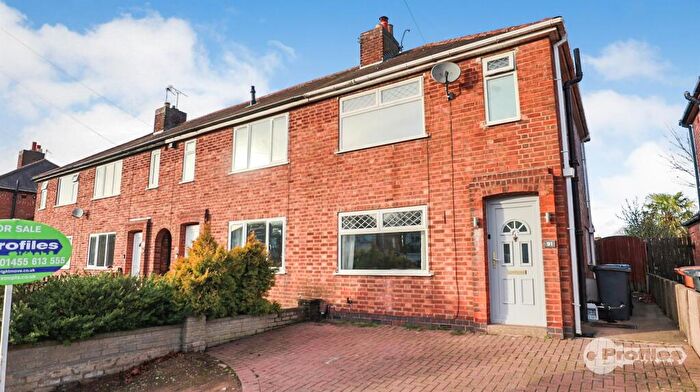
Houses for sale & to rent in Hinckley Clarendon, Hinckley
House Prices in Hinckley Clarendon
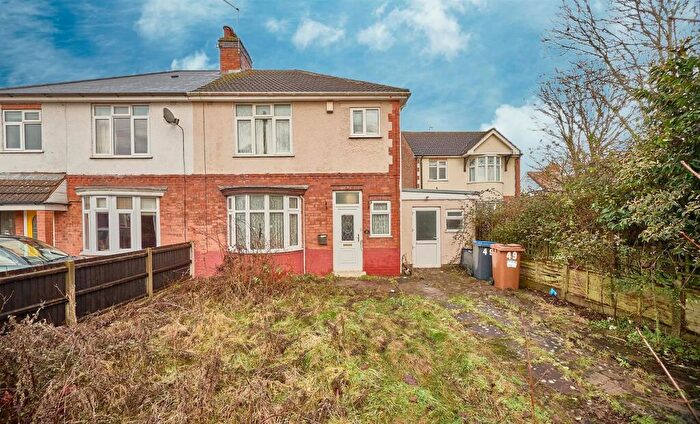
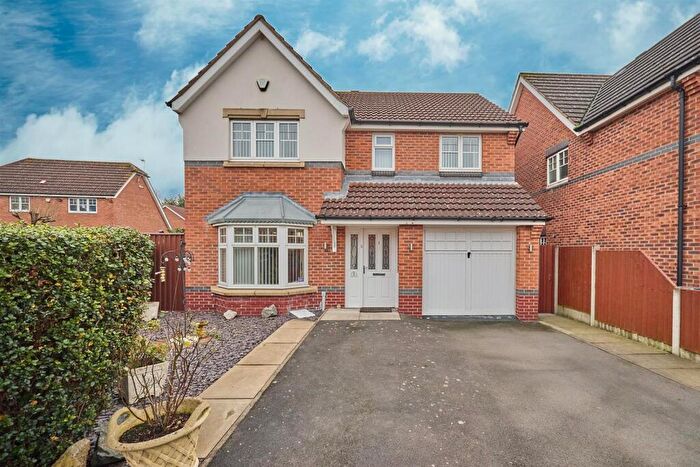
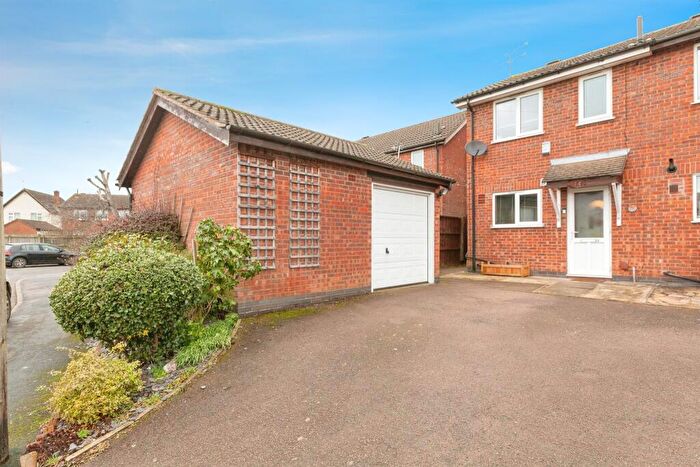
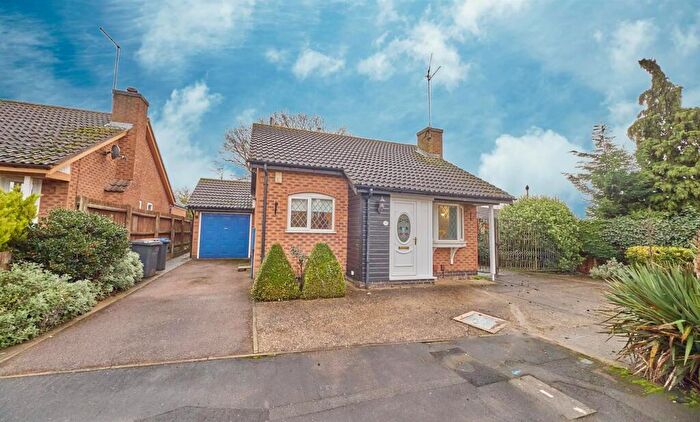
Properties in Hinckley Clarendon have an average house price of £240,842.00 and had 403 Property Transactions within the last 3 years¹.
Hinckley Clarendon is an area in Hinckley, Leicestershire with 3,679 households², where the most expensive property was sold for £660,000.00.
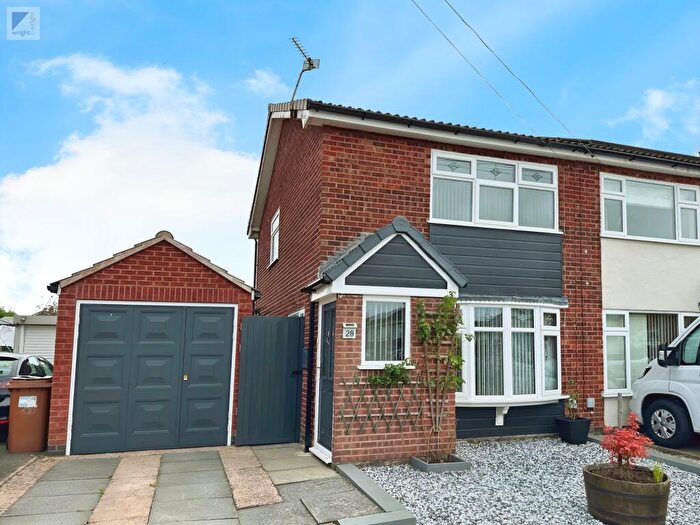
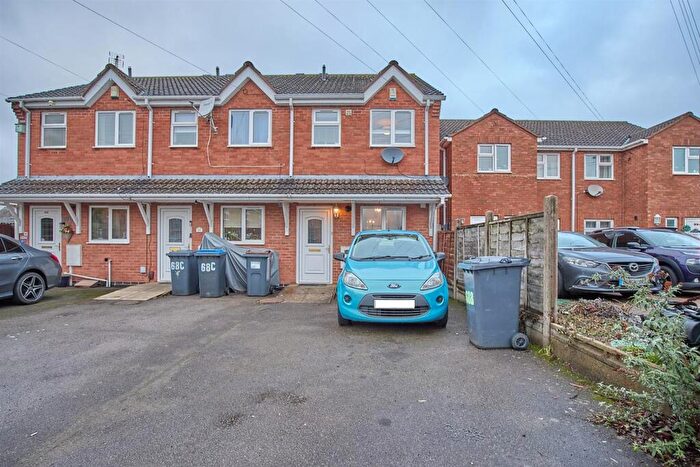
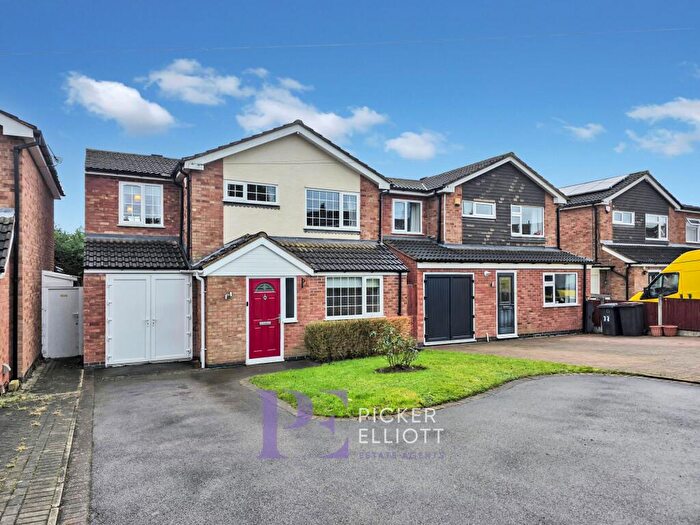
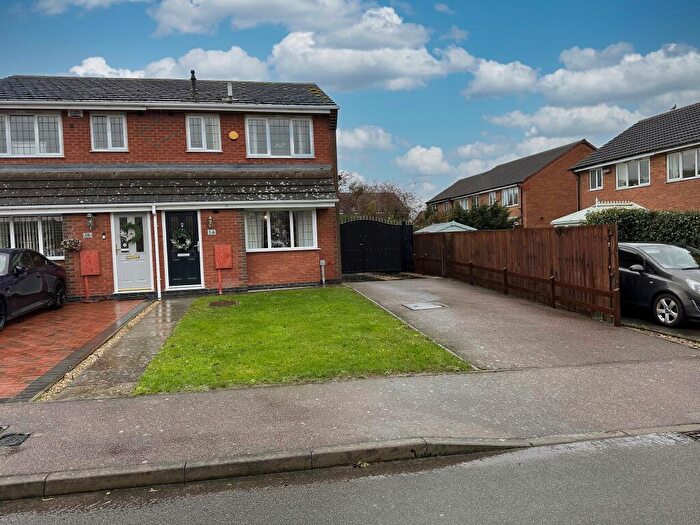
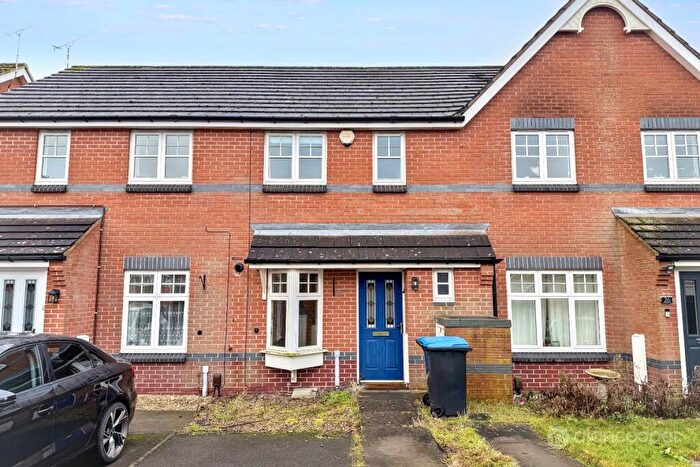
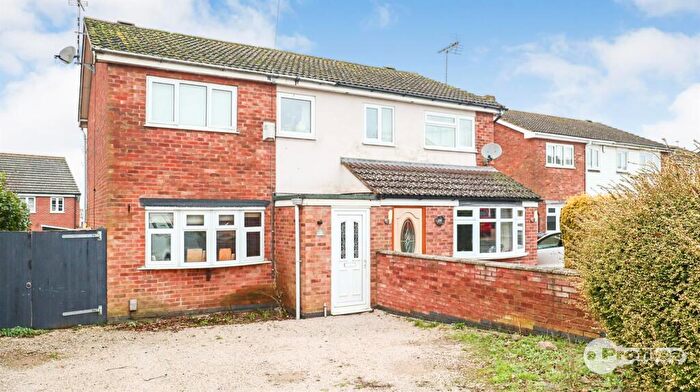
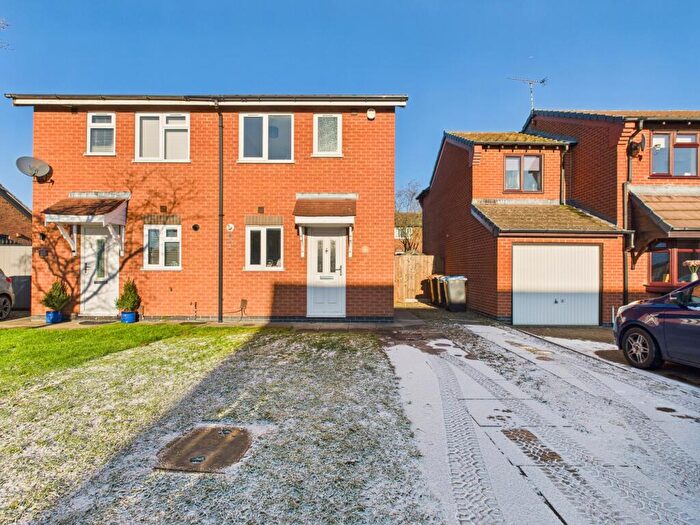
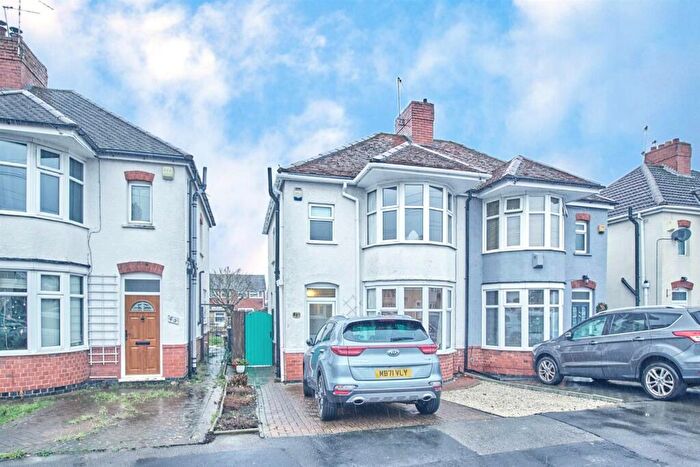
Properties for sale in Hinckley Clarendon
Roads and Postcodes in Hinckley Clarendon
Navigate through our locations to find the location of your next house in Hinckley Clarendon, Hinckley for sale or to rent.
| Streets | Postcodes |
|---|---|
| Alan Bray Close | LE10 3BP |
| Applebees Meadow | LE10 0FL |
| Applebees Walk | LE10 0FW |
| Armada Court | LE10 0JQ |
| Armadale Close | LE10 0SZ |
| Ashford Road | LE10 0JL |
| Avon Walk | LE10 0XS |
| Bader Close | LE10 0FN |
| Barlestone Drive | LE10 0XZ |
| Beams Meadow | LE10 0FY |
| Beaumont Avenue | LE10 0JN |
| Bosworth Close | LE10 0XW |
| Brascote Road | LE10 0YE |
| Brechin Close | LE10 0UX |
| Brenfield Drive | LE10 0UW |
| Brindley Road | LE10 3BG LE10 3BY |
| Brodick Close | LE10 0TU |
| Brodick Road | LE10 0TX |
| Brookdale | LE10 0NX |
| Brosdale Drive | LE10 0SW |
| Bunneys Meadow | LE10 0FQ |
| Caldon Close | LE10 0PQ |
| Canal Way | LE10 0DE |
| Cherwell Close | LE10 0SB |
| Clifton Way | LE10 0XN |
| Coldstream Close | LE10 0WS |
| Copinsay Close | LE10 0WX |
| Coventry Road | LE10 0JS LE10 0JU LE10 0NE LE10 0NF LE10 0NG LE10 0NH LE10 0NJ LE10 0NQ LE10 0NB |
| Crammond Close | LE10 0UP |
| Cromarty Drive | LE10 0RX |
| Crosskirk Road | LE10 0RS |
| Dale End Close | LE10 0PD |
| Damson Court | LE10 0ND |
| Danelaw Court | LE10 0NU |
| Dart Close | LE10 0WA |
| Dodwells Bridge Industrial Estate | LE10 3BS |
| Dodwells Road | LE10 3BX LE10 3BZ |
| Dove Close | LE10 0RY |
| Embleton Close | LE10 0UB |
| Eskdale Road | LE10 0NP LE10 0NW |
| Faraday Road | LE10 3DE |
| Faray Drive | LE10 0WZ |
| Ferndale Grove | LE10 0PH |
| Fleming Road | LE10 3DU LE10 3UJ |
| Florian Way | LE10 0WG |
| Freswick Close | LE10 0RW |
| Gallus Drive | LE10 0BE |
| Glenbarr Close | LE10 0UR |
| Glenbarr Drive | LE10 0UT |
| Gometra Close | LE10 0WP |
| Gosford Drive | LE10 0SX |
| Greenfinch Road | LE10 3GL |
| Greyhound Croft | LE10 0FX LE10 0QS |
| Hadrian Close | LE10 0NL |
| Hammonds Way | LE10 3EQ |
| Harrowbrook Road | LE10 3DJ |
| Hays Lane | LE10 0LA |
| Jacknell Close | LE10 3BN |
| John Nichols Street | LE10 0LB LE10 0LD |
| Jovian Drive | LE10 0BF |
| Kilberry Close | LE10 0YZ |
| Kilmarie Close | LE10 0WN |
| King Georges Way | LE10 0LF LE10 0LE |
| Kinross Way | LE10 0WF |
| Langdale Road | LE10 0NR LE10 0NS |
| Lapwing Drive | LE10 3FJ LE10 3FL |
| Lawnswood | LE10 0YB |
| Lawton Close | LE10 0YG |
| Laxford Close | LE10 0WR |
| Leven Close | LE10 0UJ |
| Leysmill Close | LE10 0RU |
| Lime Kilns Way | LE10 3EL |
| Livia Close | LE10 0FA |
| Lochmore Close | LE10 0TY |
| Lochmore Drive | LE10 0TZ |
| Lochmore Way | LE10 0UN |
| Lomond Close | LE10 0UD |
| Long Meadow Drive | LE10 0FD LE10 0FS LE10 0FT LE10 0FU |
| Lossiemouth Road | LE10 0SA |
| Lovetts Close | LE10 0YH |
| Lyneham Close | LE10 0XY |
| Mallard Drive | LE10 0GN |
| Mandarin Close | LE10 0GR |
| Maple Drive | LE10 3BE LE10 3BH |
| Marcian Close | LE10 0FB |
| Marina Court | LE10 3BF |
| Marywell Close | LE10 0RT |
| Melrose Close | LE10 0UL |
| Merry Hurst Place | LE10 0FG |
| Milfoil Close | LE10 0DF |
| Moray Close | LE10 0UY |
| Newton Road | LE10 3DS |
| Nuffield Road | LE10 3DG LE10 3DT |
| Nutts Lane | LE10 0NT LE10 3EG LE10 3QQ LE10 3EJ |
| Oban Road | LE10 0LL |
| Odstone Drive | LE10 0YQ |
| Oronsay Close | LE10 0WY |
| Paddock Way | LE10 0BZ LE10 0FJ |
| Partridge Road | LE10 3ET LE10 3FA |
| Pinfold Close | LE10 0FP |
| Rannoch Close | LE10 0UU |
| Riddon Drive | LE10 0UF LE10 0UG |
| Rook Close | LE10 3EP |
| Rosemary Way | LE10 0LN |
| Roston Drive | LE10 0UQ LE10 0US LE10 0XP |
| Rydal Close | LE10 0PG |
| Samphrey Close | LE10 0WL |
| Sansome Drive | LE10 0YJ LE10 0YL |
| Severn Avenue | LE10 0YD |
| Shapinsay Drive | LE10 0WT |
| Soar Way | LE10 0XU |
| Sparrow Close | LE10 3FB |
| Stadium Lane | LE10 0RP |
| Stirling Avenue | LE10 0SU |
| Stock Dove Close | LE10 3FD |
| Strathmore Road | LE10 0LP LE10 0LR LE10 0LS LE10 0LW |
| Sunnydale Crescent | LE10 0PA |
| Sunnydale Road | LE10 0PB |
| Tame Way | LE10 0XT |
| Teal Drive | LE10 0GP |
| Thirlmere Road | LE10 0PE LE10 0PF |
| Trent Road | LE10 0XX LE10 0YA |
| Turtle Dove Close | LE10 3FG |
| Venture Court | LE10 3BT |
| Walcote Close | LE10 0YF |
| Watling Street | LE10 3ED |
| Waveney Close | LE10 0BN |
| Wensum Close | LE10 0XH |
| West Hyde | LE10 0FH |
| Westfield Court | LE10 0QR |
| Westfield Road | LE10 0LT LE10 0LU |
| Weston Close | LE10 0XR |
| Whittle Road | LE10 3DZ |
| Whitworth Avenue | LE10 0DA LE10 0DD |
| William Iliffe Street | LE10 0LX LE10 0LY LE10 0LZ |
| Willowdale | LE10 0NZ |
| Windrush Drive | LE10 0NY |
| Wye Close | LE10 0RZ |
| LE10 0QG |
Transport near Hinckley Clarendon
- FAQ
- Price Paid By Year
- Property Type Price
Frequently asked questions about Hinckley Clarendon
What is the average price for a property for sale in Hinckley Clarendon?
The average price for a property for sale in Hinckley Clarendon is £240,842. This amount is 11% lower than the average price in Hinckley. There are 1,157 property listings for sale in Hinckley Clarendon.
What streets have the most expensive properties for sale in Hinckley Clarendon?
The streets with the most expensive properties for sale in Hinckley Clarendon are Caldon Close at an average of £505,000, Pinfold Close at an average of £440,000 and Windrush Drive at an average of £428,714.
What streets have the most affordable properties for sale in Hinckley Clarendon?
The streets with the most affordable properties for sale in Hinckley Clarendon are Tame Way at an average of £103,000, King Georges Way at an average of £121,666 and Lawnswood at an average of £157,500.
Which train stations are available in or near Hinckley Clarendon?
Some of the train stations available in or near Hinckley Clarendon are Hinckley, Nuneaton and Bermuda Park.
Property Price Paid in Hinckley Clarendon by Year
The average sold property price by year was:
| Year | Average Sold Price | Price Change |
Sold Properties
|
|---|---|---|---|
| 2025 | £244,338 | 1% |
129 Properties |
| 2024 | £241,016 | 2% |
147 Properties |
| 2023 | £237,090 | -7% |
127 Properties |
| 2022 | £253,465 | 13% |
178 Properties |
| 2021 | £220,994 | 6% |
199 Properties |
| 2020 | £208,265 | 5% |
169 Properties |
| 2019 | £197,238 | -1% |
180 Properties |
| 2018 | £198,686 | 9% |
197 Properties |
| 2017 | £181,649 | 7% |
258 Properties |
| 2016 | £168,369 | -0,1% |
246 Properties |
| 2015 | £168,533 | 5% |
257 Properties |
| 2014 | £159,286 | 11% |
240 Properties |
| 2013 | £141,682 | -0,2% |
156 Properties |
| 2012 | £142,019 | -3% |
122 Properties |
| 2011 | £146,454 | 5% |
145 Properties |
| 2010 | £138,524 | -1% |
111 Properties |
| 2009 | £139,820 | -5% |
113 Properties |
| 2008 | £146,282 | -3% |
109 Properties |
| 2007 | £150,966 | -2% |
223 Properties |
| 2006 | £153,698 | 3% |
281 Properties |
| 2005 | £148,747 | 6% |
253 Properties |
| 2004 | £139,956 | 10% |
339 Properties |
| 2003 | £125,903 | 19% |
330 Properties |
| 2002 | £102,359 | 17% |
350 Properties |
| 2001 | £84,950 | 15% |
319 Properties |
| 2000 | £71,884 | 13% |
225 Properties |
| 1999 | £62,778 | 14% |
208 Properties |
| 1998 | £54,016 | 2% |
223 Properties |
| 1997 | £52,744 | -2% |
235 Properties |
| 1996 | £53,825 | 3% |
223 Properties |
| 1995 | £52,333 | - |
160 Properties |
Property Price per Property Type in Hinckley Clarendon
Here you can find historic sold price data in order to help with your property search.
The average Property Paid Price for specific property types in the last three years are:
| Property Type | Average Sold Price | Sold Properties |
|---|---|---|
| Flat | £139,950.00 | 15 Flats |
| Semi Detached House | £229,730.00 | 232 Semi Detached Houses |
| Detached House | £332,428.00 | 80 Detached Houses |
| Terraced House | £198,269.00 | 76 Terraced Houses |

