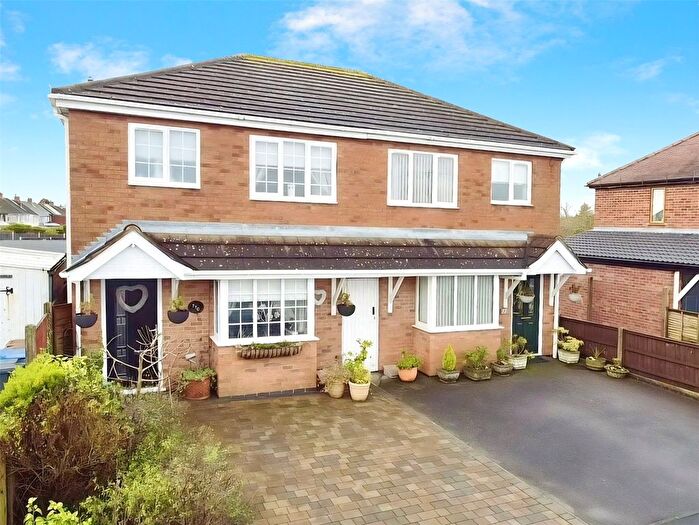
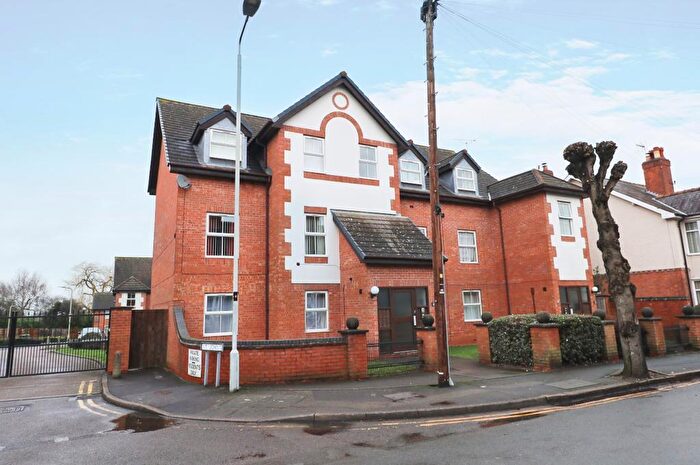
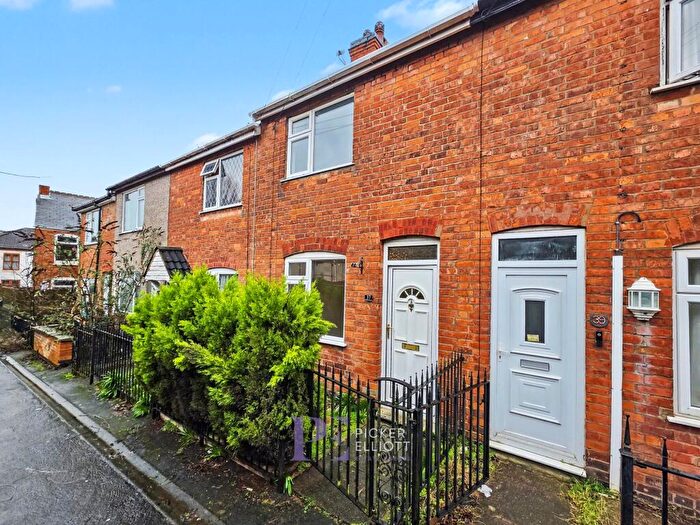
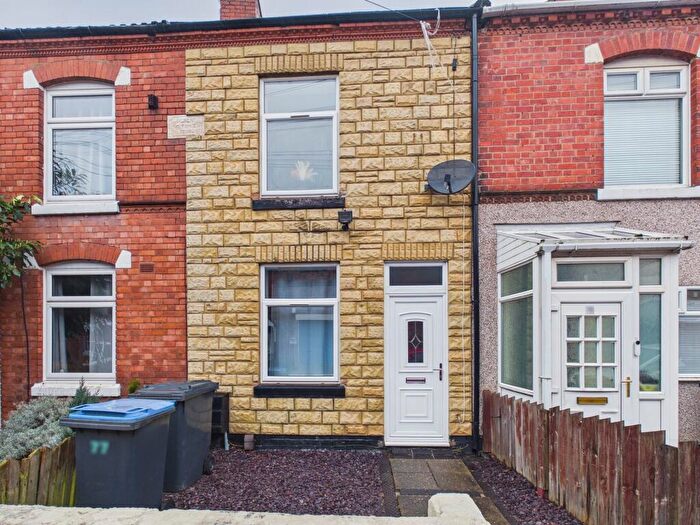
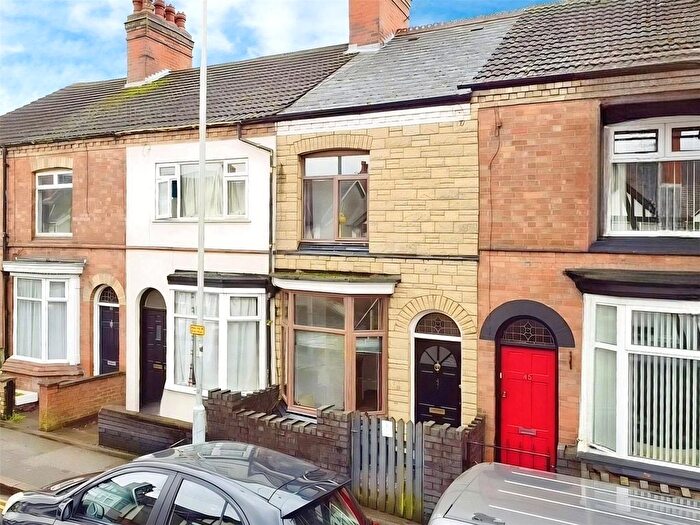
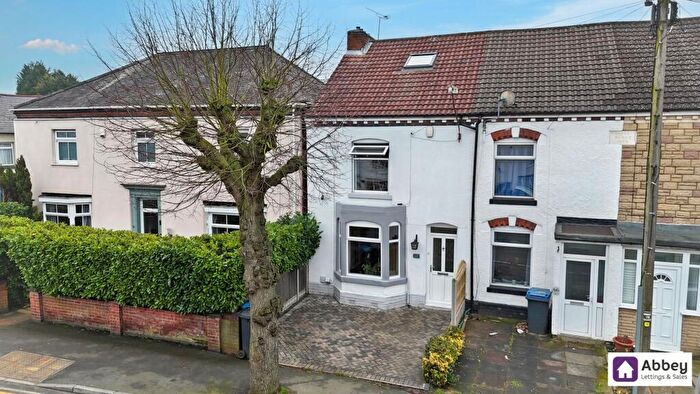
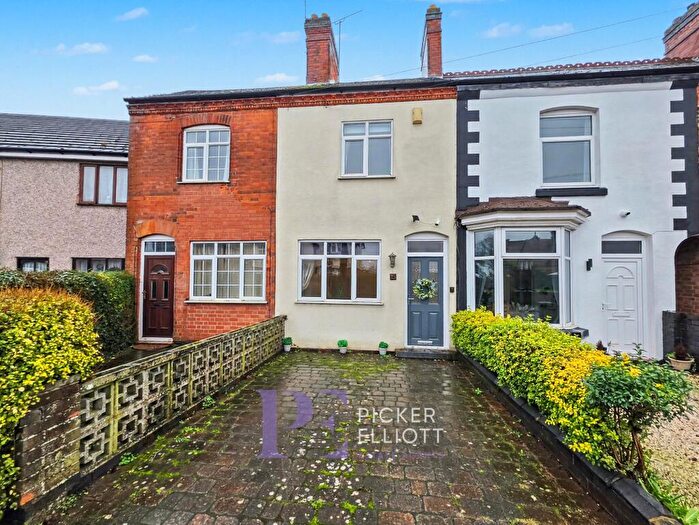
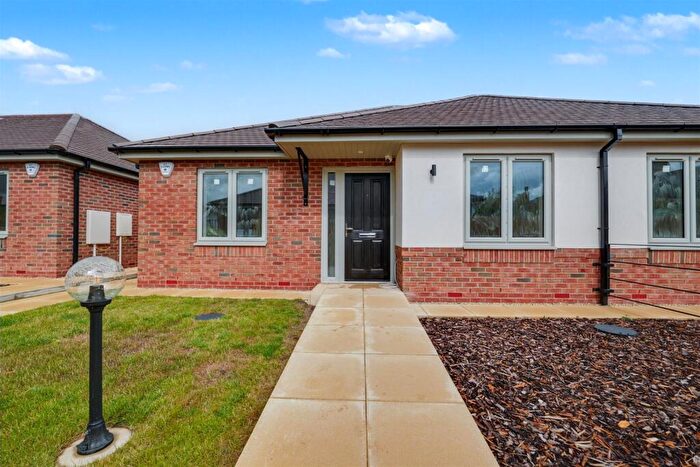
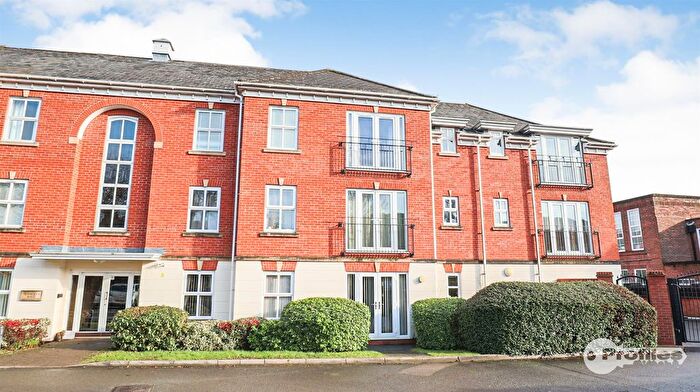
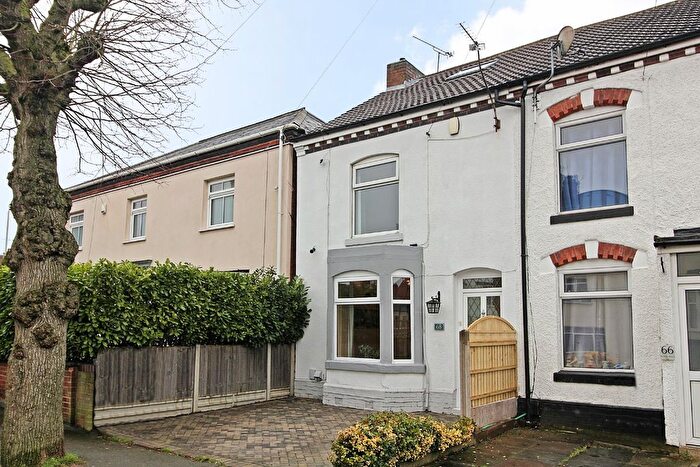
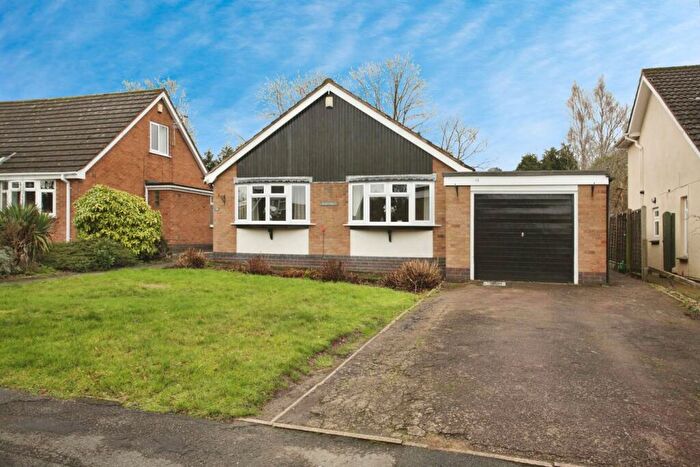
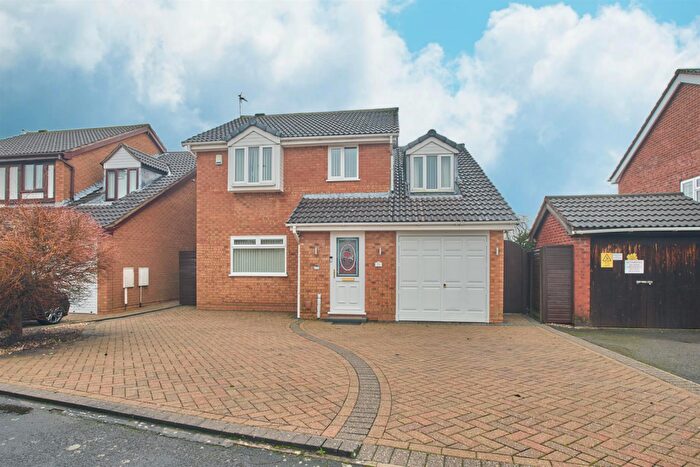
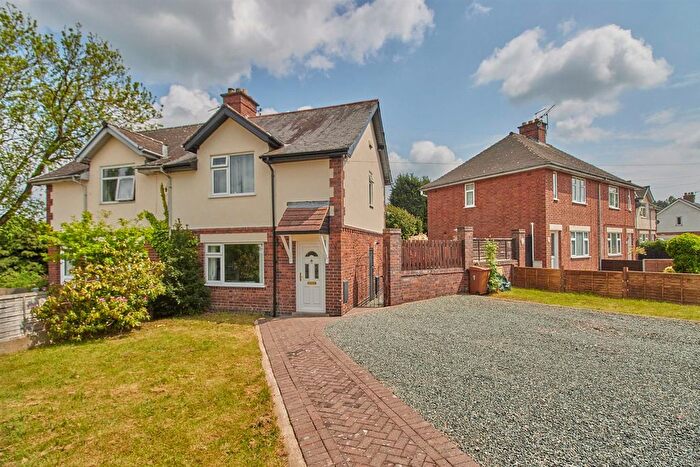
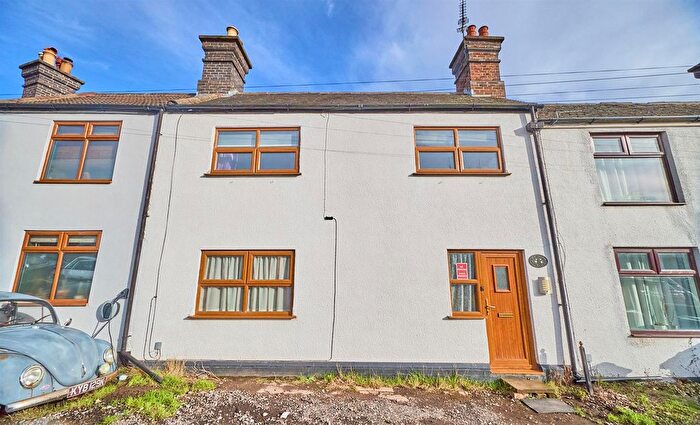
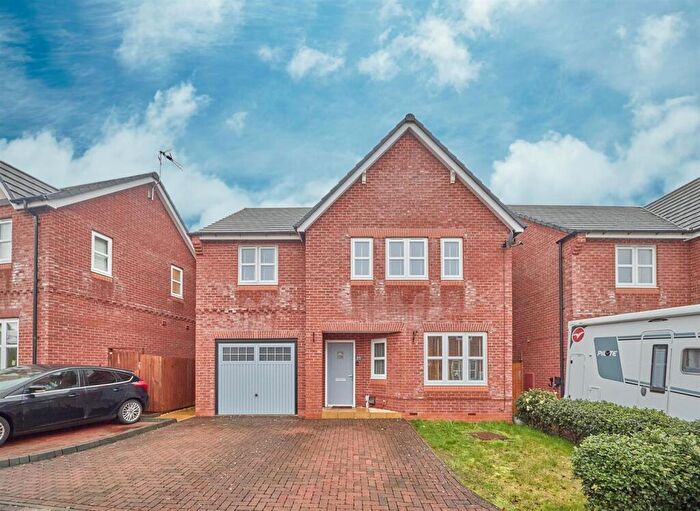
Houses for sale & to rent in Hinckley De Montfort, Hinckley
House Prices in Hinckley De Montfort
Properties in Hinckley De Montfort have an average house price of £270,284.00 and had 466 Property Transactions within the last 3 years¹.
Hinckley De Montfort is an area in Hinckley, Leicestershire with 4,167 households², where the most expensive property was sold for £880,000.00.
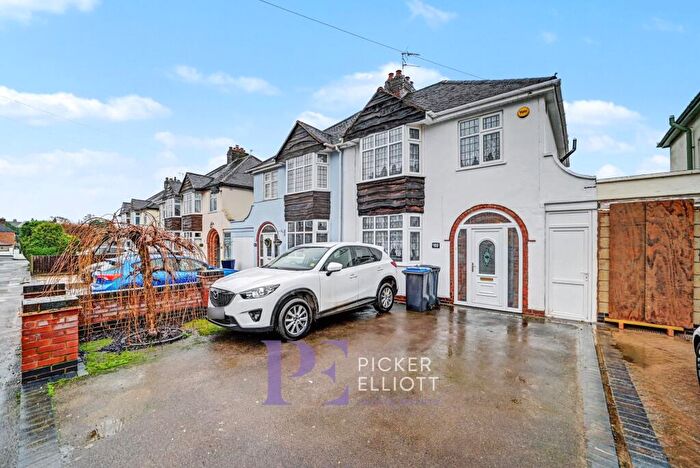
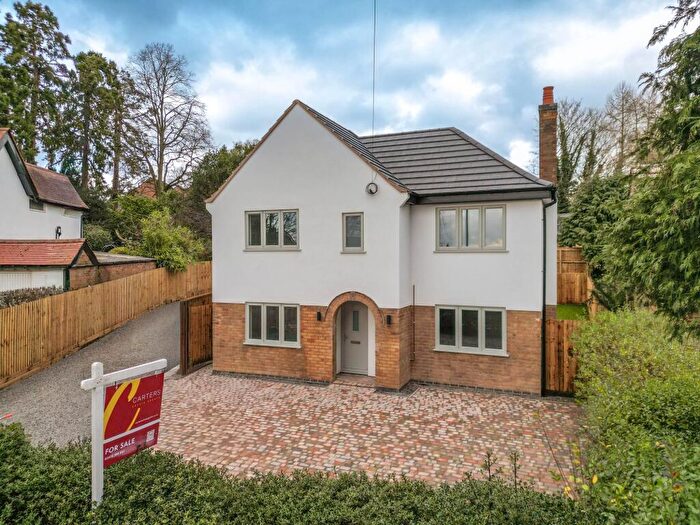
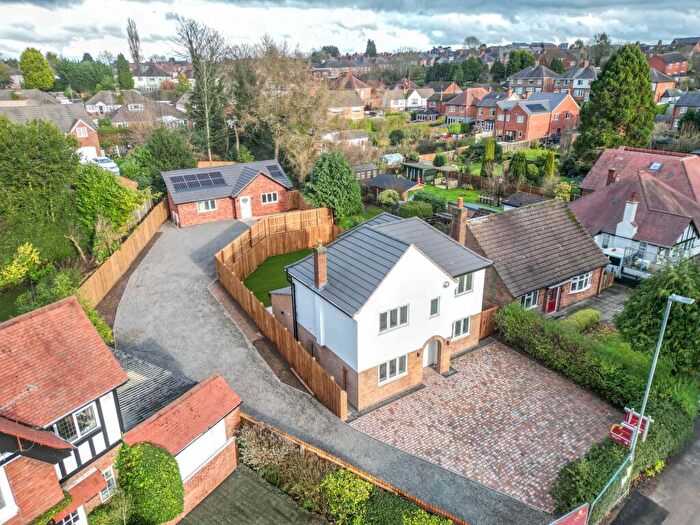
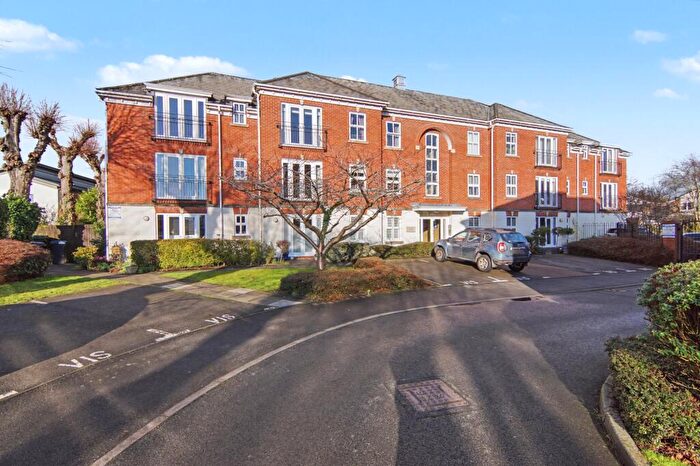
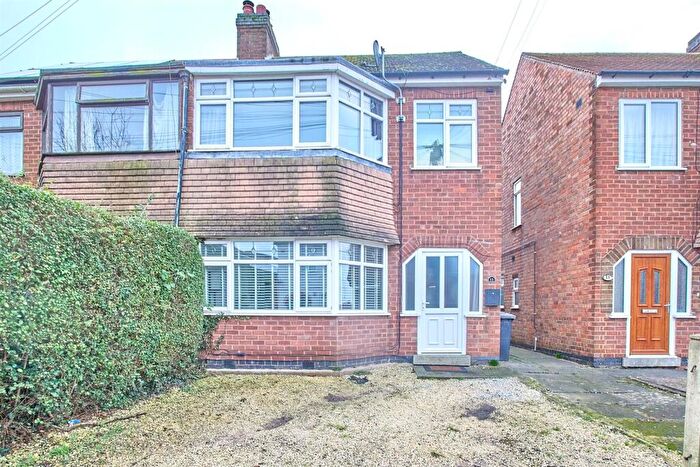
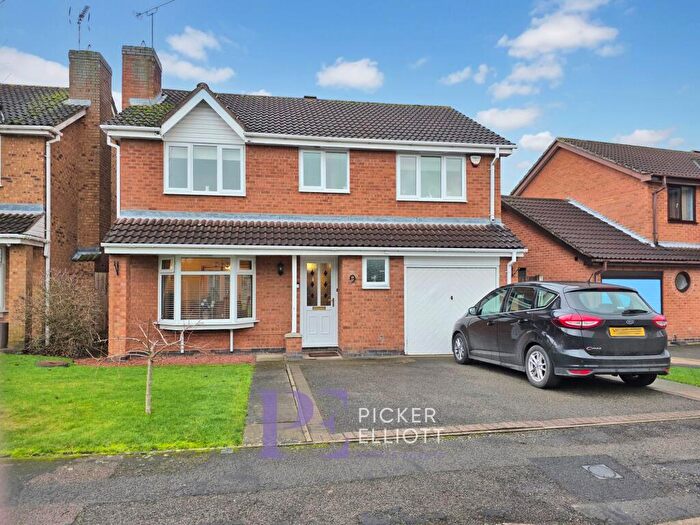
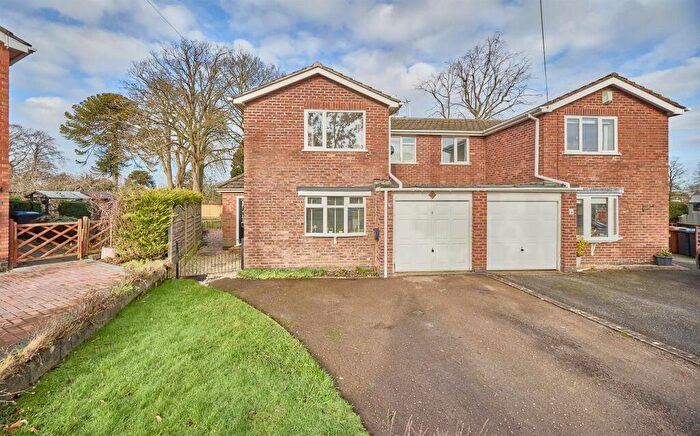
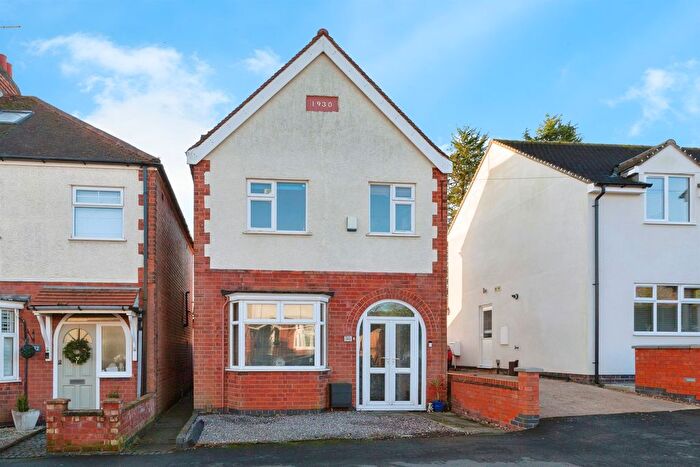
Properties for sale in Hinckley De Montfort
Roads and Postcodes in Hinckley De Montfort
Navigate through our locations to find the location of your next house in Hinckley De Montfort, Hinckley for sale or to rent.
| Streets | Postcodes |
|---|---|
| Albert Road | LE10 1PL |
| Allen Close | LE10 1EP |
| Alma Road | LE10 1PN |
| Ambion Way | LE10 1JH |
| Amsterdam Drive | LE10 1FG |
| Antwerp Close | LE10 1FF |
| Ashby Grange | LE10 1NB |
| Ashby Road | LE10 1RR LE10 1SG LE10 1SH LE10 1SJ LE10 1SL LE10 1SN LE10 1SP LE10 1SQ LE10 1SW LE10 3DA LE10 3FR |
| Athens Close | LE10 1FJ |
| Baines Lane | LE10 1PP |
| Baptist Walk | LE10 1PR |
| Barleyfield | LE10 1YE |
| Barrie Road | LE10 0QU LE10 0QX |
| Barwell Lane | LE10 1SR LE10 1SS |
| Beatty Close | LE10 1PD |
| Bedale Avenue | LE10 1ST |
| Bedford Close | LE10 1TZ |
| Benbow Close | LE10 1RQ |
| Blake Close | LE10 1UR |
| Blenheim Close | LE10 1TT |
| Bodmin Close | LE10 1XP |
| Bowling Green Road | LE10 1EX |
| Bradgate Gardens | LE10 1ND |
| Bradgate Road | LE10 1LA |
| Bramcote Close | LE10 1TL |
| Brookes Yard | LE10 1RE |
| Buckingham Close | LE10 1TU |
| Burbage Common Road | LE10 3DY |
| Butt Lane | LE10 1LB LE10 1LD LE10 1LE |
| Butt Lane Close | LE10 1LF |
| Castlemaine Drive | LE10 1RY |
| Charles Street | LE10 1PT |
| Charnwood Close | LE10 1PU |
| Charnwood Road | LE10 1PX |
| College Lane | LE10 1EY |
| Coppice Close | LE10 1TF |
| Coppice Walk | LE10 1TP |
| Cornwall Way | LE10 1XR |
| Council Road | LE10 1PY |
| Dares Walk | LE10 1PZ |
| Darwin Close | LE10 1SF |
| De Montfort Road | LE10 1LQ |
| Dean Close | LE10 1QA |
| Dean Road | LE10 1LG |
| Dean Road West | LE10 1QB |
| Derby Road | LE10 1QD LE10 1QE LE10 1QF LE10 1QJ |
| Donald Cobley Close | LE10 0ZE |
| Drake Way | LE10 1UW |
| Druid Street | LE10 1QG LE10 1QH LE10 1QQ |
| Eastwoods Road | LE10 1LH |
| Edendale Drive | LE10 1SA |
| Elizabeth Road | LE10 0QY |
| Factory Road | LE10 0DB LE10 0DR LE10 0DS LE10 0DU |
| Falmouth Drive | LE10 1XQ |
| Field Close | LE10 1TH |
| Forest Road | LE10 1HA LE10 1HB |
| Frobisher Close | LE10 1UP |
| Gladstone Close | LE10 1SB |
| Glebe Road | LE10 1HF LE10 1HG |
| Glen Bank | LE10 1LJ |
| Hangmans Lane | LE10 1SU |
| Hansom Road | LE10 1LL |
| Hardy Close | LE10 1PF |
| Harwood Drive | LE10 1UH LE10 1UJ |
| Hawkins Close | LE10 1PE |
| Helsinki Drive | LE10 1FN |
| Highfields Road | LE10 1UT LE10 1UU |
| Holliers Walk | LE10 1QW |
| Holywell Fields | LE10 1EG LE10 1EJ |
| Island Close | LE10 1LN |
| Jarvis Close | LE10 1PG |
| Jeffries Close | LE10 1QS |
| Jellicoe Way | LE10 1PB |
| John Street | LE10 1UX LE10 1UY LE10 1UZ |
| Kent Drive | LE10 1UL LE10 1UN |
| King Street | LE10 1QT |
| Kingston Drive | LE10 1TX |
| Kirfield Drive | LE10 1SX |
| Laneside Drive | LE10 1TG |
| Langham Close | LE10 1BD |
| Leicester Road | LE10 1LP LE10 1LR LE10 1LS LE10 1LT LE10 1LU LE10 1LW LE10 3DR |
| London Road | LE10 1HJ LE10 1HL |
| Middlefield Close | LE10 0RJ |
| Middlefield Court | LE10 0QT |
| Middlefield Lane | LE10 0QZ LE10 0RA LE10 0RB |
| Middlefield Place | LE10 0RL |
| Mill View | LE10 1XD |
| Nelson Drive | LE10 1PH |
| Netherley Court | LE10 0RN |
| Netherley Road | LE10 0RD LE10 0RE LE10 0RF |
| New Buildings | LE10 1HW |
| New Street | LE10 1QY LE10 1QZ |
| Newquay Close | LE10 1XN |
| Norwood Close | LE10 1TS |
| Olympic Way | LE10 1ES LE10 1ET |
| Osbaston Close | LE10 1TN |
| Paris Close | LE10 1EW |
| Penzance Close | LE10 1XJ |
| Portland Drive | LE10 1SE |
| Queen Victoria Court | LE10 1PS |
| Radmore Road | LE10 0RG LE10 0RQ |
| Raleigh Close | LE10 1RX |
| Ribblesdale Avenue | LE10 1SY |
| Richmond Gate | LE10 0AF LE10 0BW LE10 0BD |
| Richmond Road | LE10 0DZ |
| Rodney Close | LE10 1PA |
| Sandford Close | LE10 1JJ |
| Saville Close | LE10 1SZ |
| Sheepy Close | LE10 1JL |
| Shelley Gardens | LE10 1TA |
| Spa Close | LE10 1HZ |
| Spa Gardens | LE10 1JN |
| Spa Lane | LE10 1JA |
| Spencer Street | LE10 1RB |
| St Francis Close | LE10 0EW LE10 0PU |
| St Johns | LE10 1NX |
| St Louis Close | LE10 1FP |
| St Pauls Gardens | LE10 1NY |
| Stockholm Close | LE10 1FZ |
| Stoneygate Drive | LE10 1TB LE10 1TD |
| Sunnyside | LE10 1TE |
| Sunnyside Park | LE10 1PJ |
| Sutton Close | LE10 1TW |
| Teign Bank Close | LE10 0EB |
| Teign Bank Road | LE10 0ED |
| The Rills | LE10 1NA |
| Trafford Road | LE10 1LY |
| Trevor Road | LE10 1JD |
| Truro Close | LE10 1XL |
| Tudor Road | LE10 0EF LE10 0EQ |
| Tweedside Close | LE10 1TQ |
| Upper Bond Street | LE10 1AX LE10 1RH LE10 1RP LE10 1RT LE10 1RW LE10 1NZ LE10 1RJ LE10 1RL LE10 1RN LE10 1WA LE10 1WB |
| Warwick Gardens | LE10 1SD |
| Well Lane | LE10 1QL |
| Welwyn Road | LE10 1JE |
| Wendover Drive | LE10 1UQ |
| Wentworth Close | LE10 1RZ |
| Wheatfield Way | LE10 1YG LE10 1BB LE10 1EL |
| Woburn Close | LE10 1TY |
| Woodland Road | LE10 1JF LE10 1JG |
| Yeoman Close | LE10 1EN |
| York Road | LE10 0RH |
| Zealand Close | LE10 1TJ |
| LE10 1YF |
Transport near Hinckley De Montfort
-
Hinckley Station
-
Nuneaton Station
-
Bermuda Park Station
-
Bedworth Station
-
Narborough Station
-
Atherstone Station
-
Coventry Arena Station
-
South Wigston Station
- FAQ
- Price Paid By Year
- Property Type Price
Frequently asked questions about Hinckley De Montfort
What is the average price for a property for sale in Hinckley De Montfort?
The average price for a property for sale in Hinckley De Montfort is £270,284. This amount is 0.4% higher than the average price in Hinckley. There are 1,315 property listings for sale in Hinckley De Montfort.
What streets have the most expensive properties for sale in Hinckley De Montfort?
The streets with the most expensive properties for sale in Hinckley De Montfort are Spa Lane at an average of £690,000, Hansom Road at an average of £595,000 and St Louis Close at an average of £565,000.
What streets have the most affordable properties for sale in Hinckley De Montfort?
The streets with the most affordable properties for sale in Hinckley De Montfort are Allen Close at an average of £97,500, St Johns at an average of £100,000 and Bedford Close at an average of £130,000.
Which train stations are available in or near Hinckley De Montfort?
Some of the train stations available in or near Hinckley De Montfort are Hinckley, Nuneaton and Bermuda Park.
Property Price Paid in Hinckley De Montfort by Year
The average sold property price by year was:
| Year | Average Sold Price | Price Change |
Sold Properties
|
|---|---|---|---|
| 2025 | £270,927 | 0,1% |
157 Properties |
| 2024 | £270,671 | 1% |
157 Properties |
| 2023 | £269,221 | 2% |
152 Properties |
| 2022 | £263,238 | 7% |
206 Properties |
| 2021 | £243,584 | 2% |
265 Properties |
| 2020 | £238,558 | 14% |
169 Properties |
| 2019 | £204,272 | -9% |
184 Properties |
| 2018 | £223,343 | 5% |
211 Properties |
| 2017 | £211,674 | 8% |
218 Properties |
| 2016 | £194,360 | -4% |
223 Properties |
| 2015 | £202,082 | 0,3% |
296 Properties |
| 2014 | £201,477 | 4% |
321 Properties |
| 2013 | £193,618 | 23% |
229 Properties |
| 2012 | £148,614 | -12% |
97 Properties |
| 2011 | £165,903 | 3% |
92 Properties |
| 2010 | £161,534 | 2% |
105 Properties |
| 2009 | £157,595 | -6% |
124 Properties |
| 2008 | £167,157 | -4% |
124 Properties |
| 2007 | £174,344 | 11% |
260 Properties |
| 2006 | £155,400 | 1% |
278 Properties |
| 2005 | £154,459 | 7% |
181 Properties |
| 2004 | £144,073 | 11% |
242 Properties |
| 2003 | £127,815 | 18% |
274 Properties |
| 2002 | £104,841 | 16% |
294 Properties |
| 2001 | £87,702 | 17% |
217 Properties |
| 2000 | £72,934 | -6% |
258 Properties |
| 1999 | £77,367 | 19% |
255 Properties |
| 1998 | £62,886 | -3% |
220 Properties |
| 1997 | £64,539 | 13% |
217 Properties |
| 1996 | £56,426 | 12% |
210 Properties |
| 1995 | £49,919 | - |
167 Properties |
Property Price per Property Type in Hinckley De Montfort
Here you can find historic sold price data in order to help with your property search.
The average Property Paid Price for specific property types in the last three years are:
| Property Type | Average Sold Price | Sold Properties |
|---|---|---|
| Flat | £123,601.00 | 57 Flats |
| Semi Detached House | £246,786.00 | 136 Semi Detached Houses |
| Detached House | £380,874.00 | 169 Detached Houses |
| Terraced House | £201,699.00 | 104 Terraced Houses |

