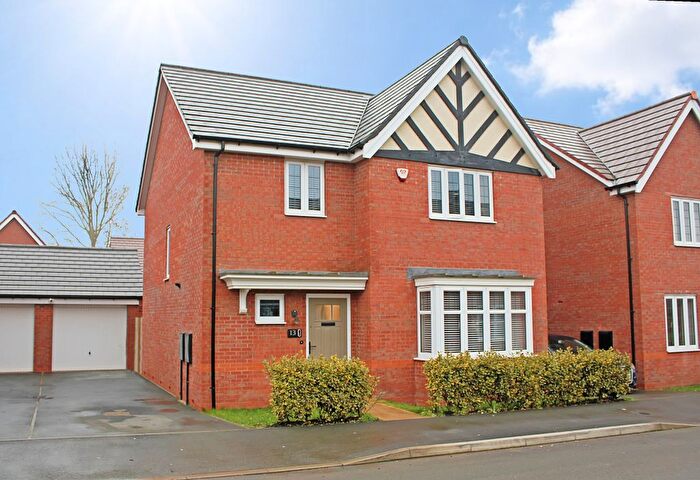
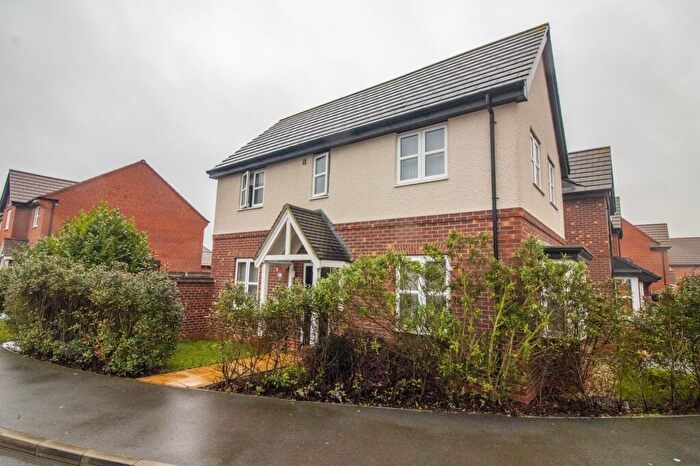
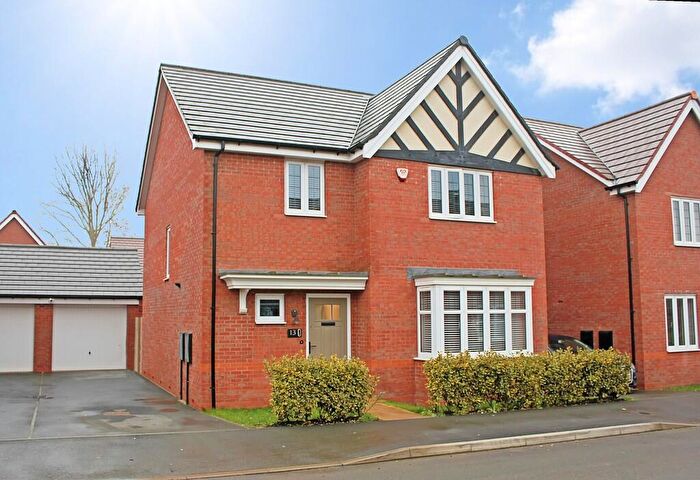
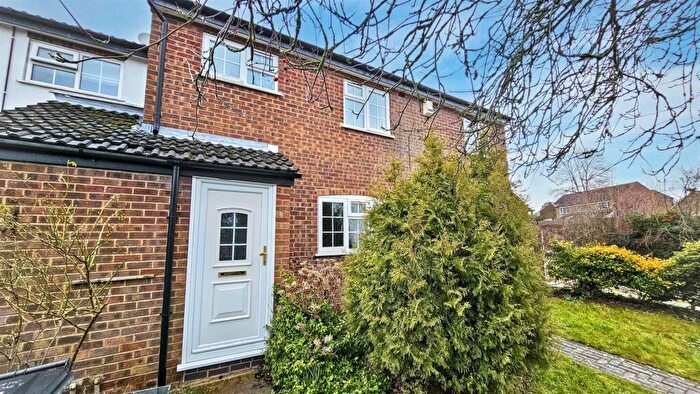
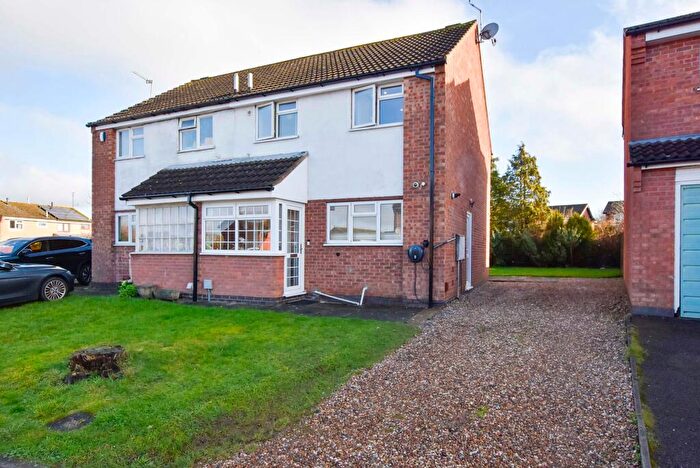
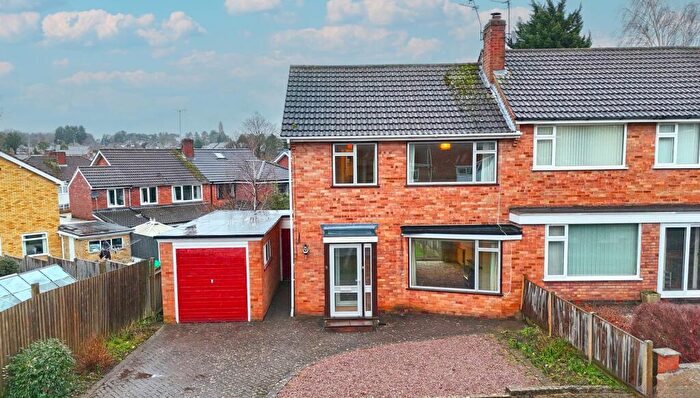
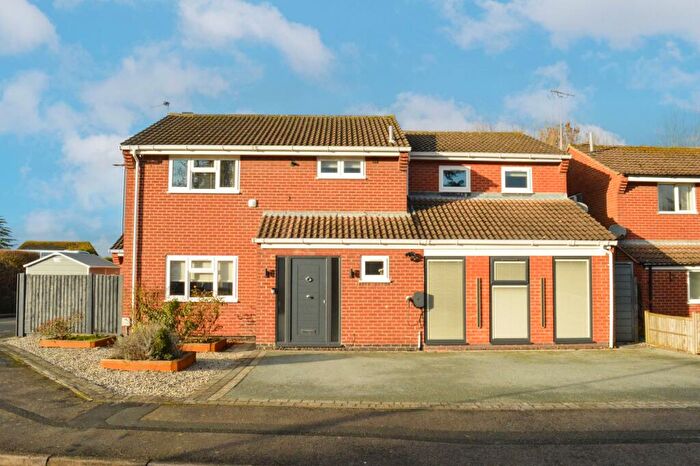
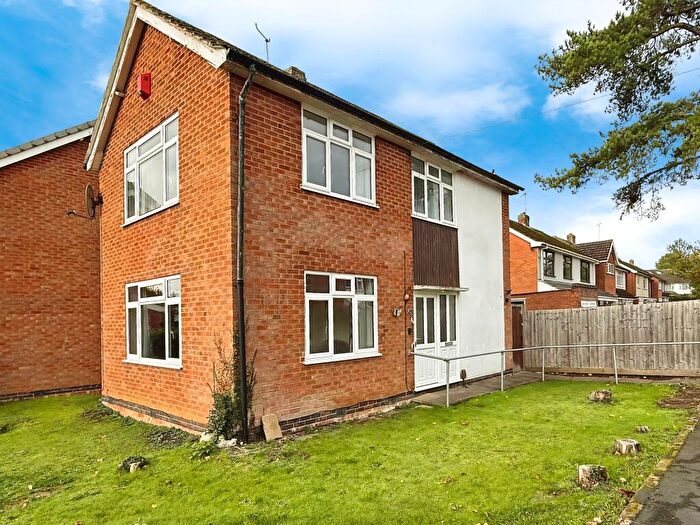
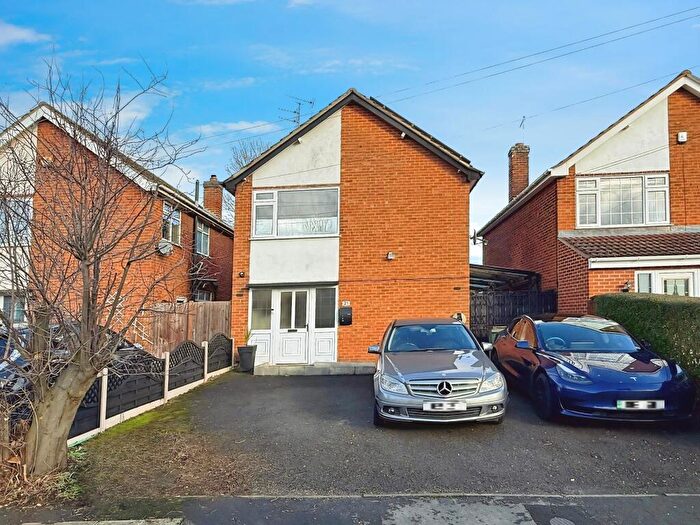
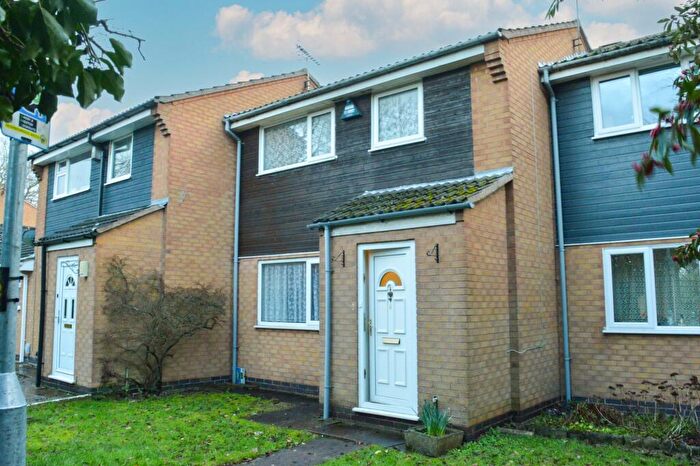
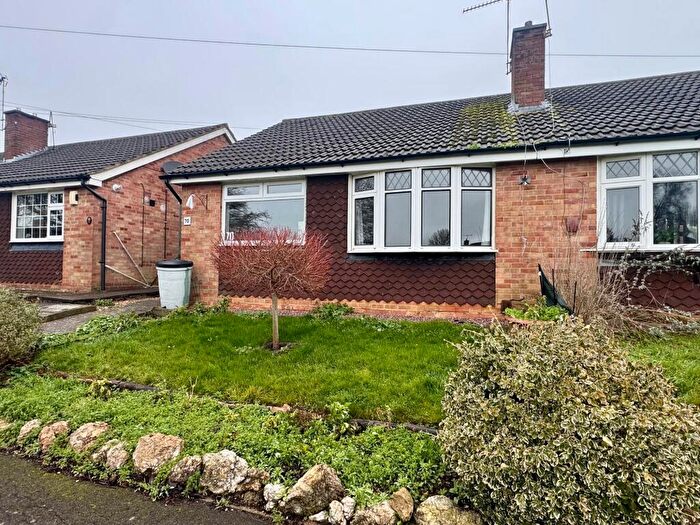
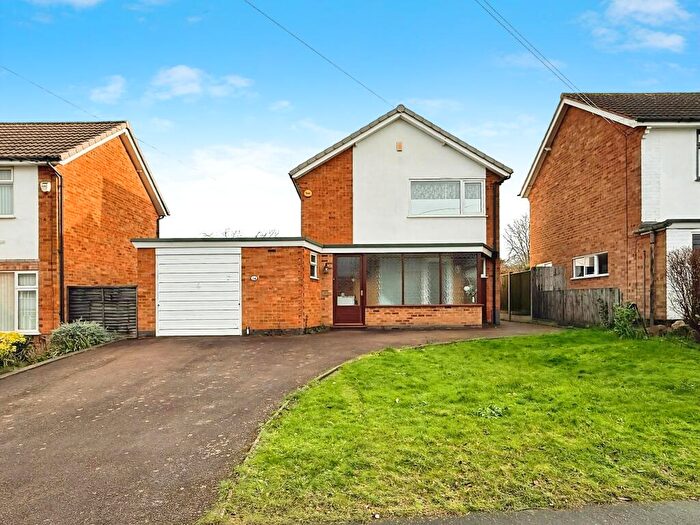
Houses for sale & to rent in Oadby Brocks Hill, Leicester
House Prices in Oadby Brocks Hill
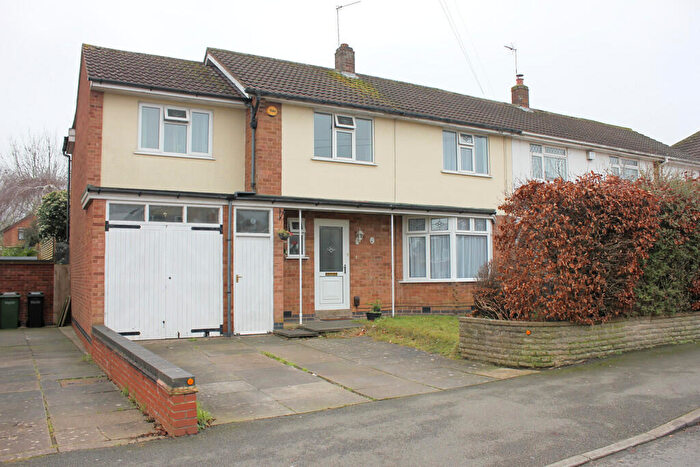
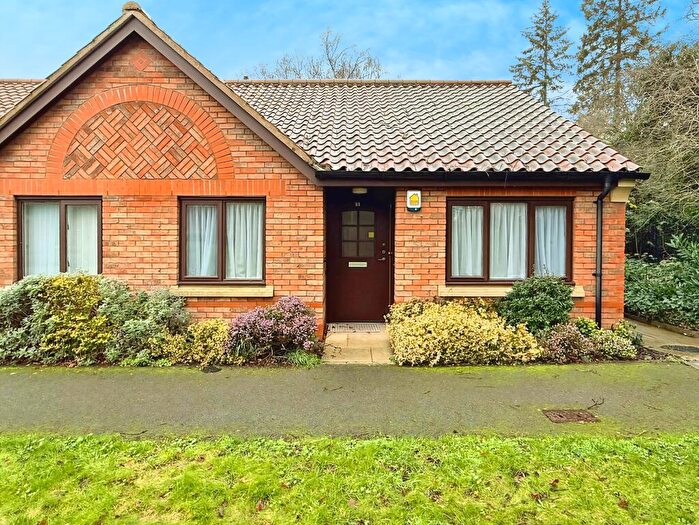
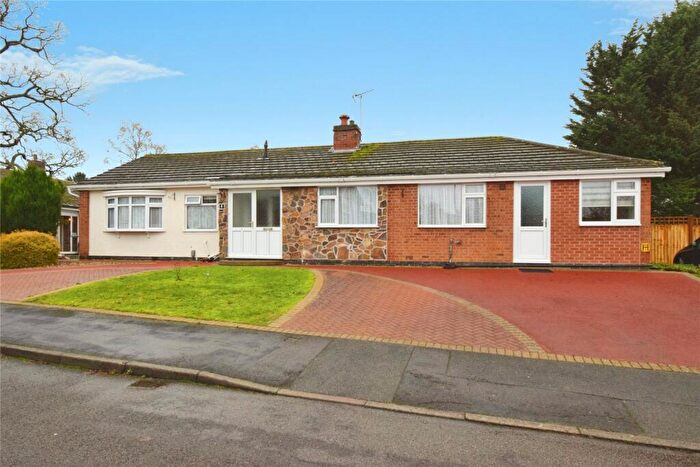
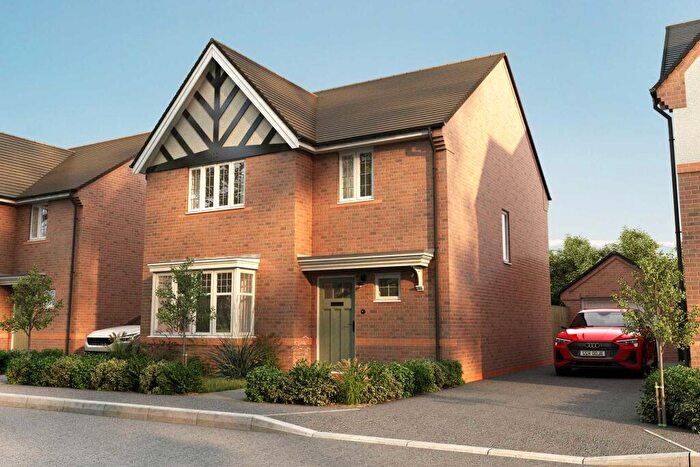
Properties in Oadby Brocks Hill have an average house price of £322,918.00 and had 119 Property Transactions within the last 3 years¹.
Oadby Brocks Hill is an area in Leicester, Leicestershire with 1,451 households², where the most expensive property was sold for £630,000.00.
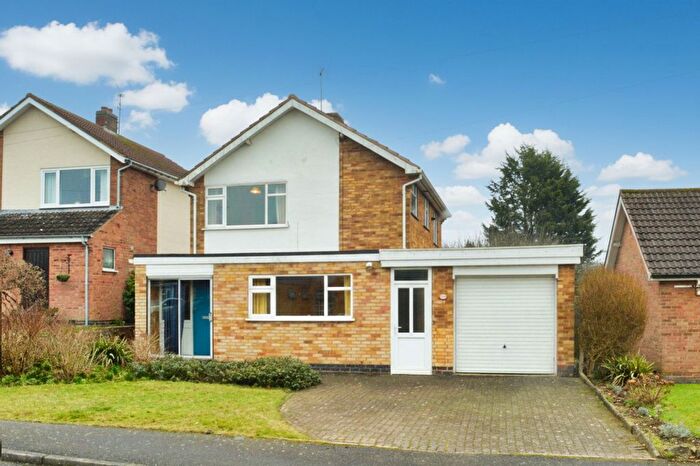
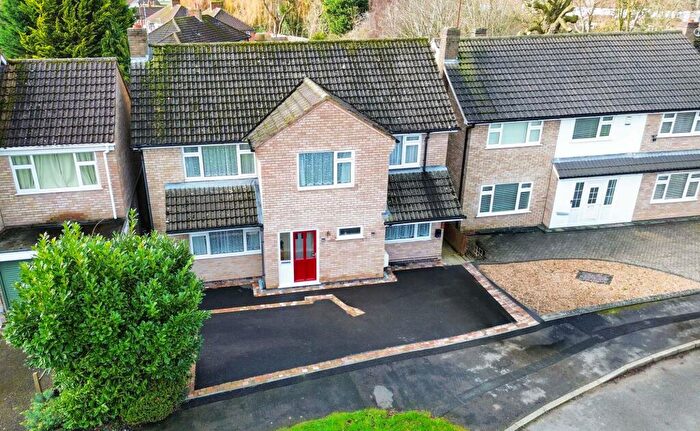
Properties for sale in Oadby Brocks Hill
Roads and Postcodes in Oadby Brocks Hill
Navigate through our locations to find the location of your next house in Oadby Brocks Hill, Leicester for sale or to rent.
| Streets | Postcodes |
|---|---|
| Ash Tree Road | LE2 5TD LE2 5TE LE2 5TF LE2 5YB |
| Ashton Close | LE2 5WH |
| Ashtree Close | LE2 5TA |
| Ashtree Road | LE2 5TB LE2 5YA LE2 5YD |
| Badgers Holt | LE2 5PU |
| Barnet Close | LE2 5WA |
| Belper Close | LE2 5WB |
| Berridge Drive | LE2 5RA |
| Briar Close | LE2 5TG |
| Briar Walk | LE2 5UE LE2 5UF |
| Briarmeads | LE2 5WD LE2 5WE |
| Broxfield Close | LE2 5WJ |
| Canon Close | LE2 5RF |
| Coombe Place | LE2 5TH |
| Coombe Rise | LE2 5TJ LE2 5TT LE2 5TU LE2 5TW LE2 5TX LE2 5TZ |
| Devonshire Walk | LE2 5UQ |
| Durrad Drive | LE2 4TT |
| Fairstone Hill | LE2 5RH LE2 5RJ LE2 5RL LE2 5RN |
| Fenton Close | LE2 5WU |
| Frensham Close | LE2 5WF |
| Gardiner View | LE2 4UT |
| Glen Road | LE2 4RF LE2 4PG |
| Glen Way | LE2 5YE LE2 5YF |
| Hidcote Road | LE2 5PE LE2 5PF LE2 5PG LE2 5PH |
| Highcroft Avenue | LE2 5UG LE2 5UH |
| Highleys Drive | LE2 5TL |
| Hill Way | LE2 5YG |
| Howdon Road | LE2 5WP LE2 5WQ |
| Hyde Close | LE2 5UN |
| Jamie Marcus Way | LE2 4RZ |
| Kensington Close | LE2 5UL |
| Kew Drive | LE2 5TS |
| London Road | LE2 5RS |
| Lowcroft Drive | LE2 5UD |
| Margaret Anne Road | LE2 5UW |
| Marston Close | LE2 5WL |
| Mere Lane | LE2 4SA |
| Orchard Close | LE2 5PL |
| Oxted Rise | LE2 5WG |
| Park Crescent | LE2 5YH LE2 5YJ |
| Pine Tree Close | LE2 5US |
| Pine Tree Gardens | LE2 5UT |
| Portland Walk | LE2 5TY |
| Richmond Way | LE2 5TR |
| Ridge Way | LE2 5TN LE2 5TP LE2 5TQ |
| Riston Close | LE2 5WN |
| Shipston Hill | LE2 5PS |
| Sibton Lane | LE2 5UA |
| St James Close | LE2 5UR |
| Sutton Close | LE2 5WT |
| Tilton Drive | LE2 5WW |
| Tollgate Close | LE2 4TZ |
| Turner Rise | LE2 5SG LE2 5SH |
| Vandyke Road | LE2 5UB |
| Wakeling View | LE2 4UQ |
| Washbrook Lane | LE2 5JJ |
| Weston Rise | LE2 4WA |
| Whiteoaks Road | LE2 5YL |
| Wickham Road | LE2 5SJ |
| Windsor Close | LE2 5UP |
Transport near Oadby Brocks Hill
- FAQ
- Price Paid By Year
- Property Type Price
Frequently asked questions about Oadby Brocks Hill
What is the average price for a property for sale in Oadby Brocks Hill?
The average price for a property for sale in Oadby Brocks Hill is £322,918. This amount is 4% higher than the average price in Leicester. There are 1,529 property listings for sale in Oadby Brocks Hill.
What streets have the most expensive properties for sale in Oadby Brocks Hill?
The streets with the most expensive properties for sale in Oadby Brocks Hill are Briar Walk at an average of £535,000, Ashtree Road at an average of £433,750 and Hill Way at an average of £416,250.
What streets have the most affordable properties for sale in Oadby Brocks Hill?
The streets with the most affordable properties for sale in Oadby Brocks Hill are Margaret Anne Road at an average of £180,000, Jamie Marcus Way at an average of £193,000 and Kensington Close at an average of £206,250.
Which train stations are available in or near Oadby Brocks Hill?
Some of the train stations available in or near Oadby Brocks Hill are South Wigston, Leicester and Narborough.
Property Price Paid in Oadby Brocks Hill by Year
The average sold property price by year was:
| Year | Average Sold Price | Price Change |
Sold Properties
|
|---|---|---|---|
| 2025 | £322,727 | 8% |
29 Properties |
| 2024 | £297,312 | -17% |
43 Properties |
| 2023 | £346,462 | 0,2% |
47 Properties |
| 2022 | £345,854 | 4% |
51 Properties |
| 2021 | £333,442 | 1% |
93 Properties |
| 2020 | £330,255 | 8% |
104 Properties |
| 2019 | £302,740 | 8% |
71 Properties |
| 2018 | £279,956 | 6% |
38 Properties |
| 2017 | £262,579 | 8% |
44 Properties |
| 2016 | £240,952 | 1% |
54 Properties |
| 2015 | £237,787 | 14% |
39 Properties |
| 2014 | £204,346 | 1% |
42 Properties |
| 2013 | £203,089 | -1% |
28 Properties |
| 2012 | £204,241 | 0,4% |
34 Properties |
| 2011 | £203,370 | 6% |
34 Properties |
| 2010 | £190,557 | 8% |
38 Properties |
| 2009 | £175,879 | -9% |
47 Properties |
| 2008 | £191,054 | -2% |
32 Properties |
| 2007 | £195,054 | 3% |
64 Properties |
| 2006 | £189,897 | 0,3% |
63 Properties |
| 2005 | £189,298 | 6% |
54 Properties |
| 2004 | £178,785 | 9% |
59 Properties |
| 2003 | £161,983 | 23% |
61 Properties |
| 2002 | £124,891 | 14% |
62 Properties |
| 2001 | £107,716 | 17% |
79 Properties |
| 2000 | £89,508 | 8% |
58 Properties |
| 1999 | £82,601 | 9% |
70 Properties |
| 1998 | £74,792 | 2% |
58 Properties |
| 1997 | £73,471 | 17% |
66 Properties |
| 1996 | £61,035 | -4% |
62 Properties |
| 1995 | £63,607 | - |
56 Properties |
Property Price per Property Type in Oadby Brocks Hill
Here you can find historic sold price data in order to help with your property search.
The average Property Paid Price for specific property types in the last three years are:
| Property Type | Average Sold Price | Sold Properties |
|---|---|---|
| Semi Detached House | £289,322.00 | 58 Semi Detached Houses |
| Detached House | £354,561.00 | 58 Detached Houses |
| Terraced House | £360,666.00 | 3 Terraced Houses |

