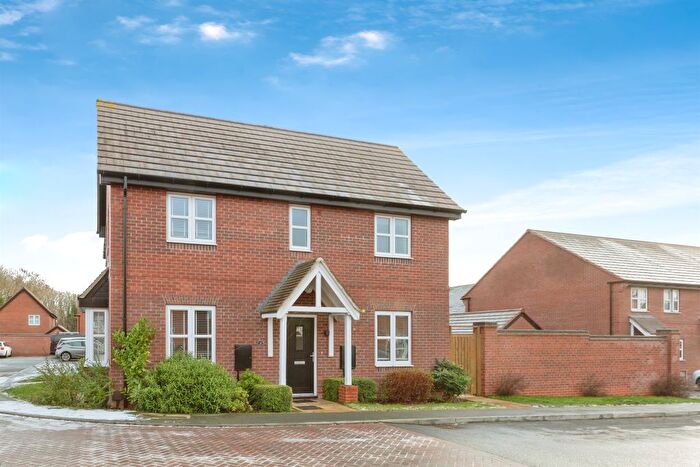
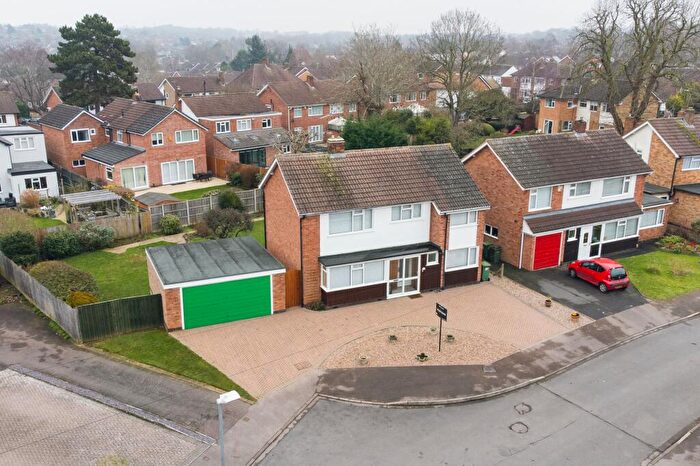
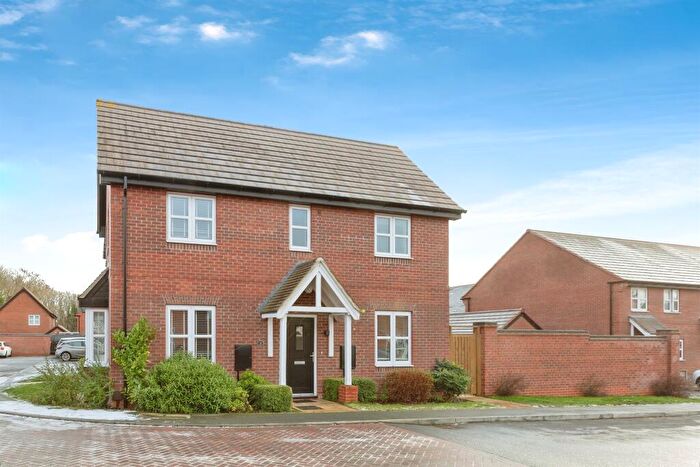
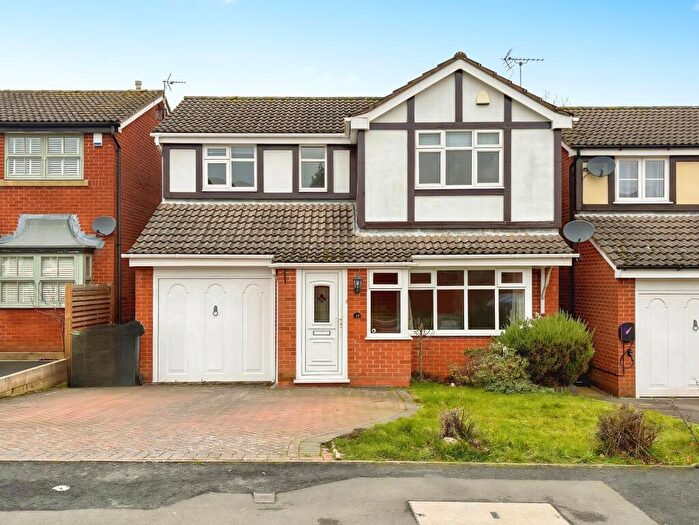
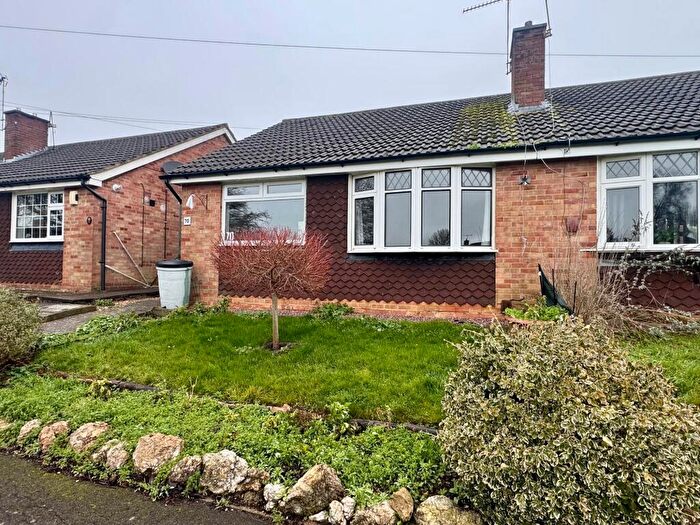
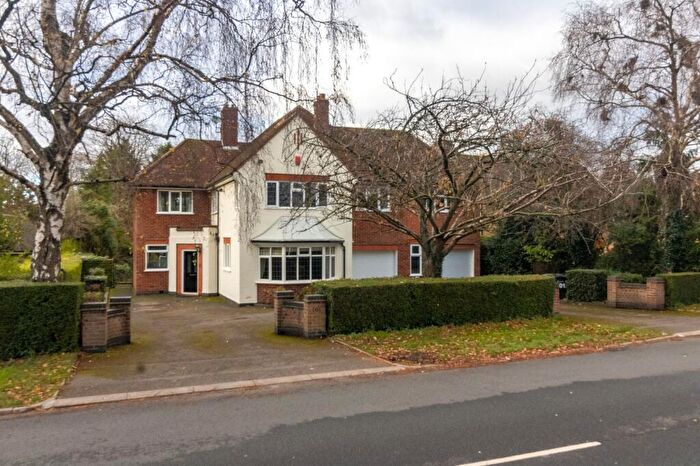
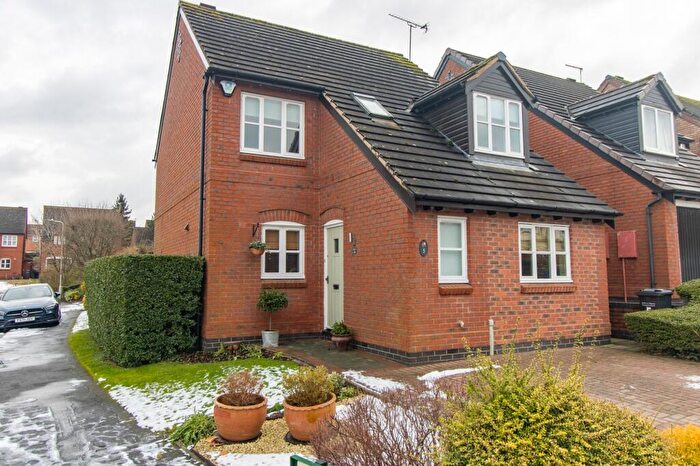
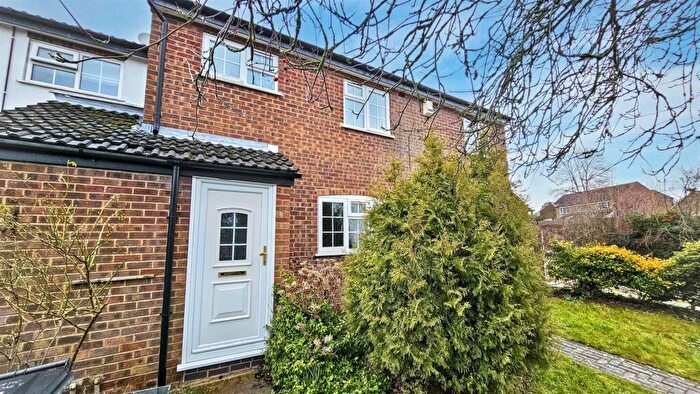
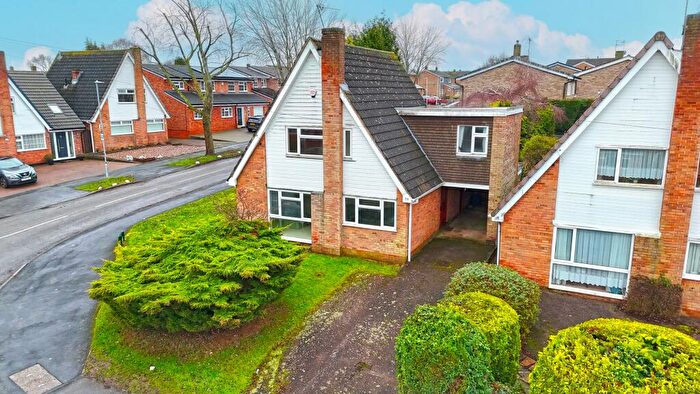
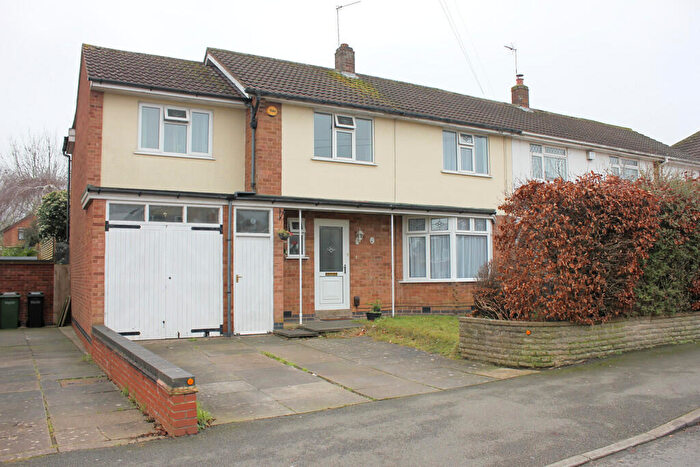
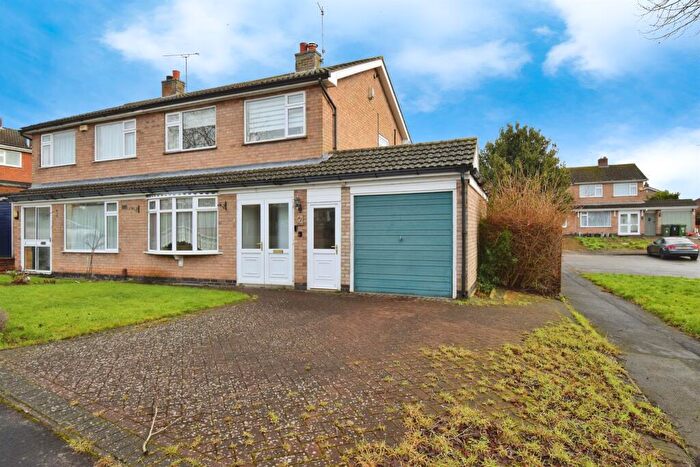
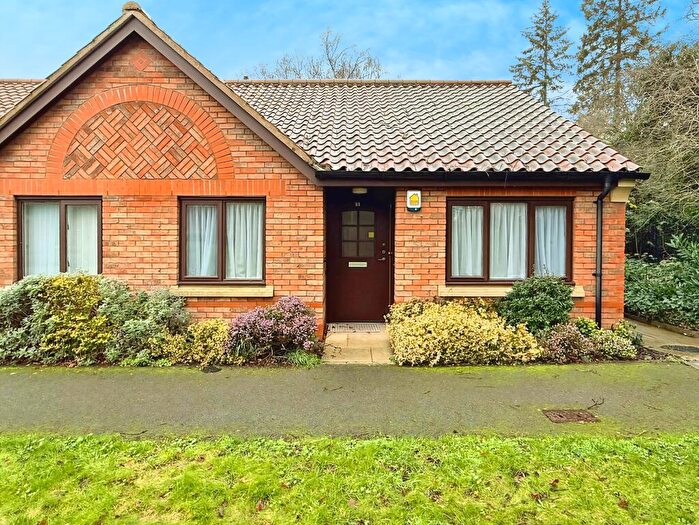
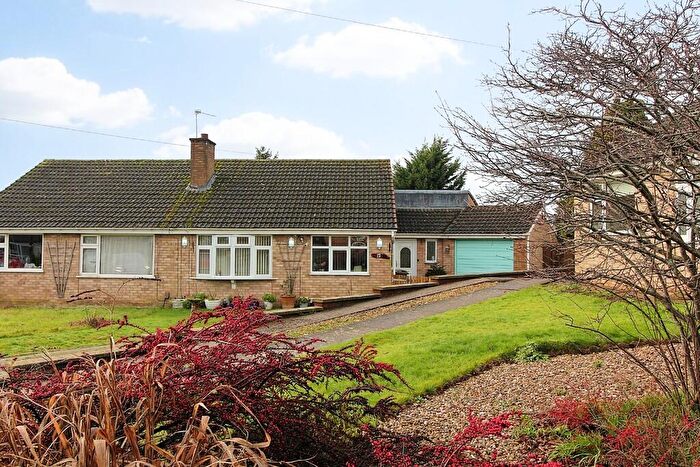
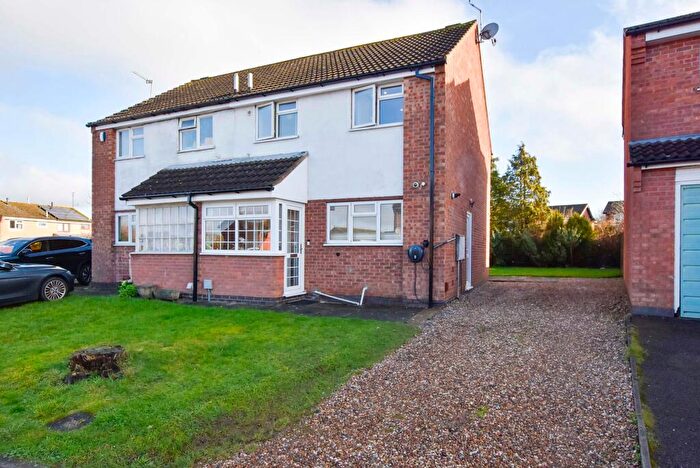
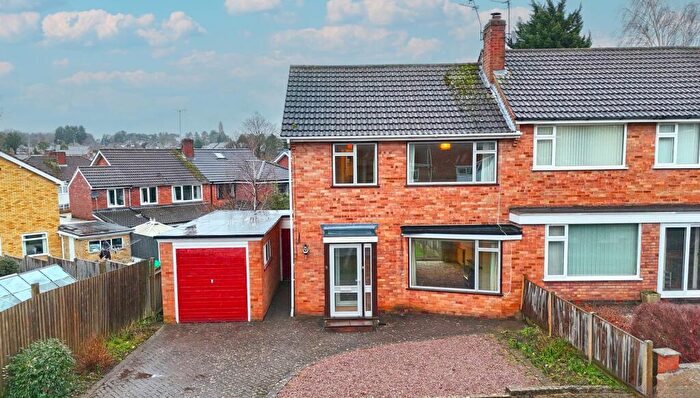
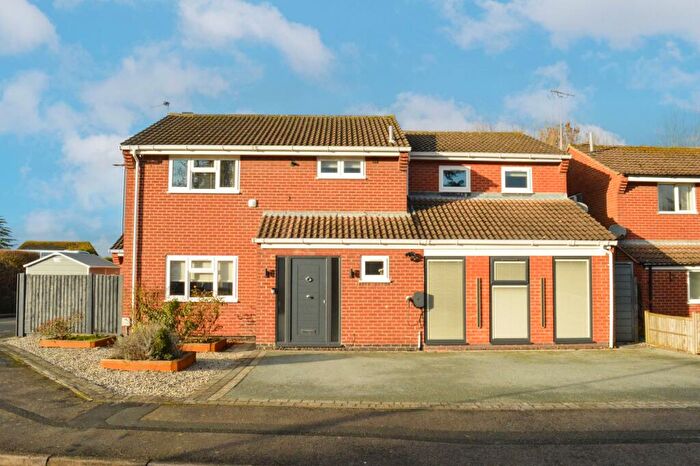
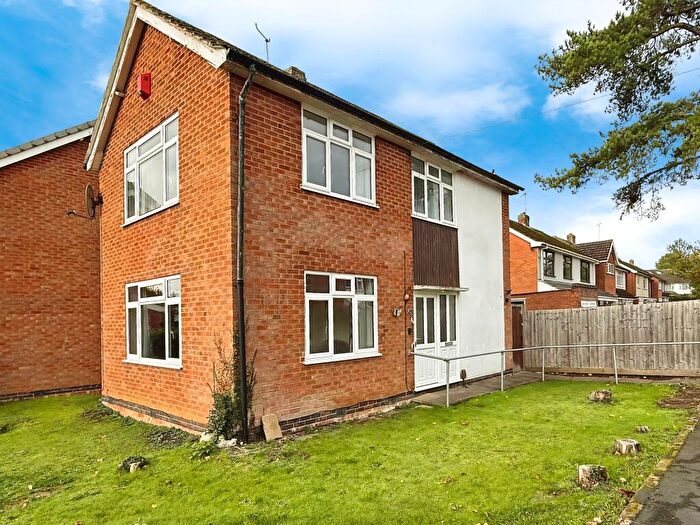
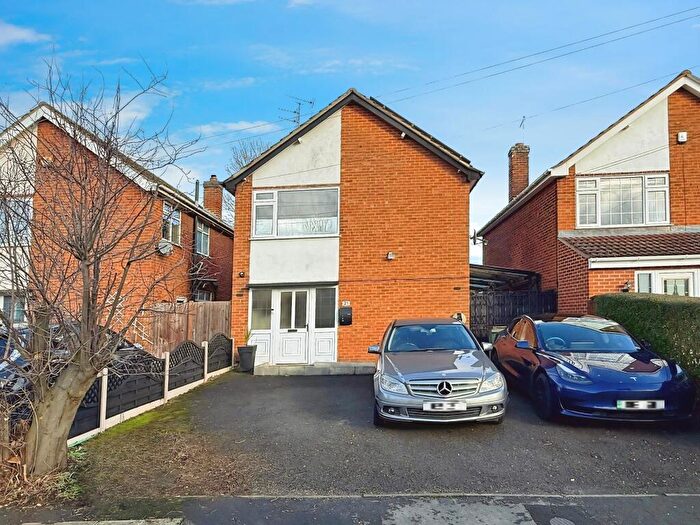
Houses for sale & to rent in Oadby Uplands, Leicester
House Prices in Oadby Uplands
Properties in Oadby Uplands have an average house price of £314,787.00 and had 111 Property Transactions within the last 3 years¹.
Oadby Uplands is an area in Leicester, Leicestershire with 1,519 households², where the most expensive property was sold for £610,000.00.
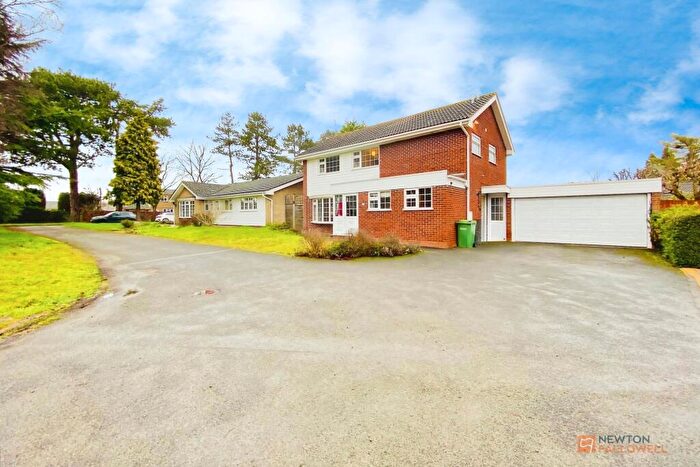
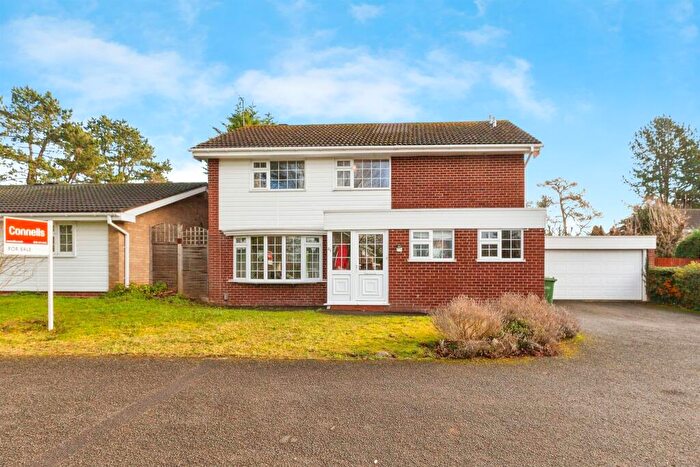
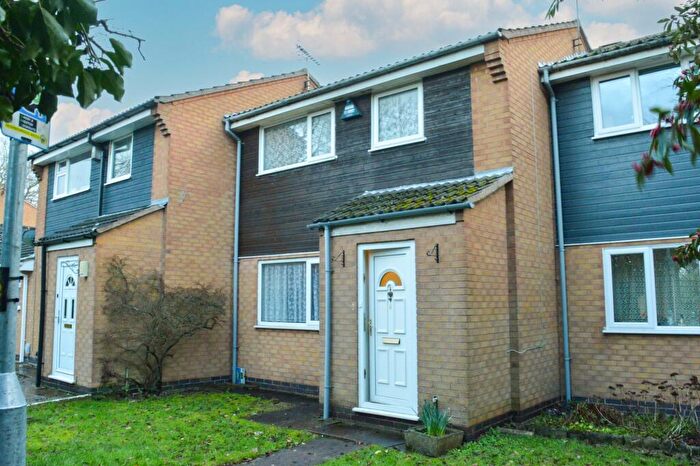
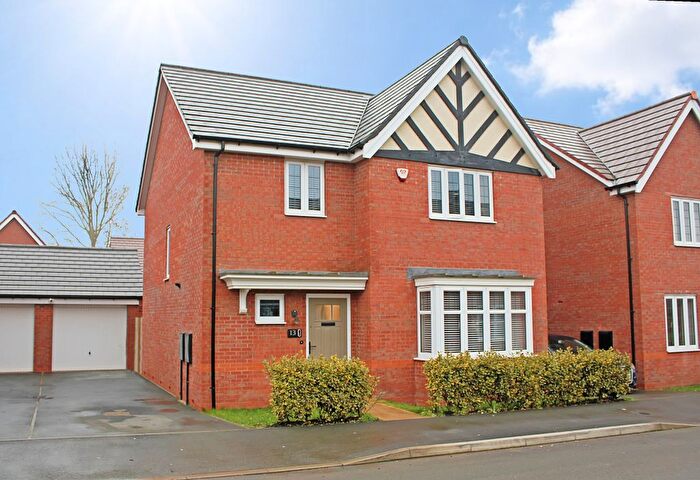
Properties for sale in Oadby Uplands
Roads and Postcodes in Oadby Uplands
Navigate through our locations to find the location of your next house in Oadby Uplands, Leicester for sale or to rent.
| Streets | Postcodes |
|---|---|
| Adlington Road | LE2 4NA |
| Avon Close | LE2 4JD |
| Belleville Drive | LE2 4HA |
| Bollington Road | LE2 4NB LE2 4ND |
| Bourton Crescent | LE2 4PA |
| Brookside Drive | LE2 4PB LE2 4PD |
| Colne Close | LE2 4GA |
| Copse Close | LE2 4FB LE2 4FD |
| Dart Close | LE2 4JA |
| Derwent Walk | LE2 4JB |
| Dove Rise | LE2 4NY |
| Eden Close | LE2 4JQ |
| Eden Road | LE2 4JP |
| Fairfield Road | LE2 4NE LE2 4NF |
| Forest Rise | LE2 4FH |
| Frome Avenue | LE2 4GB |
| Half Moon Crescent | LE2 4HD |
| Hamble Road | LE2 4NX |
| Harborough Road | LE2 4LG LE2 4LH |
| Isis Close | LE2 4GD |
| Kent Drive | LE2 4PN LE2 4PP LE2 4PQ |
| Launde Road | LE2 4HH |
| Malton Drive | LE2 4NG |
| Martin Avenue | LE2 4NH |
| Mosse Way | LE2 4HL |
| Nene Court | LE2 4JF |
| Nene Drive | LE2 4JE |
| Queen Street | LE2 4NJ LE2 4NL |
| Quiney Way | LE2 4HN |
| Ribble Avenue | LE2 4NZ |
| Severn Road | LE2 4FU LE2 4FW LE2 4FY LE2 4FZ |
| Silverton Road | LE2 4NN |
| Somerby Drive | LE2 4PH |
| St Pauls Close | LE2 4LZ |
| Stour Close | LE2 4GE |
| Swale Close | LE2 4GF |
| Tamar Road | LE2 4GN |
| Trent Close | LE2 4GP |
| Tudor Drive | LE2 4NP |
| Uplands Road | LE2 4NQ LE2 4NR LE2 4NS LE2 4NT LE2 4NW |
| Waldron Drive | LE2 4PJ LE2 4PL |
| Waveney Rise | LE2 4GG |
| Wayside Drive | LE2 4NU |
| Windrush Drive | LE2 4GH LE2 4GJ LE2 4GL |
| Woods Close | LE2 4FJ |
Transport near Oadby Uplands
- FAQ
- Price Paid By Year
- Property Type Price
Frequently asked questions about Oadby Uplands
What is the average price for a property for sale in Oadby Uplands?
The average price for a property for sale in Oadby Uplands is £314,787. This amount is 1% higher than the average price in Leicester. There are 1,607 property listings for sale in Oadby Uplands.
What streets have the most expensive properties for sale in Oadby Uplands?
The streets with the most expensive properties for sale in Oadby Uplands are Launde Road at an average of £585,000, Ribble Avenue at an average of £560,000 and Half Moon Crescent at an average of £505,000.
What streets have the most affordable properties for sale in Oadby Uplands?
The streets with the most affordable properties for sale in Oadby Uplands are St Pauls Close at an average of £104,500, Nene Court at an average of £200,000 and Derwent Walk at an average of £209,500.
Which train stations are available in or near Oadby Uplands?
Some of the train stations available in or near Oadby Uplands are South Wigston, Leicester and Narborough.
Property Price Paid in Oadby Uplands by Year
The average sold property price by year was:
| Year | Average Sold Price | Price Change |
Sold Properties
|
|---|---|---|---|
| 2025 | £323,959 | 8% |
44 Properties |
| 2024 | £296,687 | -9% |
36 Properties |
| 2023 | £322,788 | -2% |
31 Properties |
| 2022 | £327,925 | 9% |
40 Properties |
| 2021 | £298,909 | 2% |
80 Properties |
| 2020 | £292,543 | 5% |
55 Properties |
| 2019 | £278,918 | 1% |
46 Properties |
| 2018 | £277,139 | 10% |
62 Properties |
| 2017 | £250,244 | 5% |
56 Properties |
| 2016 | £237,449 | 10% |
53 Properties |
| 2015 | £214,657 | 7% |
61 Properties |
| 2014 | £198,566 | 7% |
54 Properties |
| 2013 | £184,633 | 8% |
48 Properties |
| 2012 | £169,325 | -12% |
46 Properties |
| 2011 | £190,341 | -12% |
48 Properties |
| 2010 | £213,686 | 24% |
36 Properties |
| 2009 | £163,385 | -5% |
41 Properties |
| 2008 | £172,340 | -11% |
33 Properties |
| 2007 | £190,646 | 1% |
64 Properties |
| 2006 | £189,690 | -3% |
70 Properties |
| 2005 | £195,160 | 14% |
55 Properties |
| 2004 | £168,765 | 11% |
73 Properties |
| 2003 | £151,040 | 17% |
89 Properties |
| 2002 | £125,767 | 20% |
91 Properties |
| 2001 | £100,906 | 6% |
82 Properties |
| 2000 | £95,184 | 13% |
60 Properties |
| 1999 | £83,149 | 15% |
78 Properties |
| 1998 | £70,773 | 6% |
76 Properties |
| 1997 | £66,522 | 13% |
72 Properties |
| 1996 | £57,592 | -12% |
82 Properties |
| 1995 | £64,304 | - |
50 Properties |
Property Price per Property Type in Oadby Uplands
Here you can find historic sold price data in order to help with your property search.
The average Property Paid Price for specific property types in the last three years are:
| Property Type | Average Sold Price | Sold Properties |
|---|---|---|
| Semi Detached House | £276,696.00 | 63 Semi Detached Houses |
| Detached House | £431,500.00 | 34 Detached Houses |
| Terraced House | £280,125.00 | 8 Terraced Houses |
| Flat | £99,583.00 | 6 Flats |

