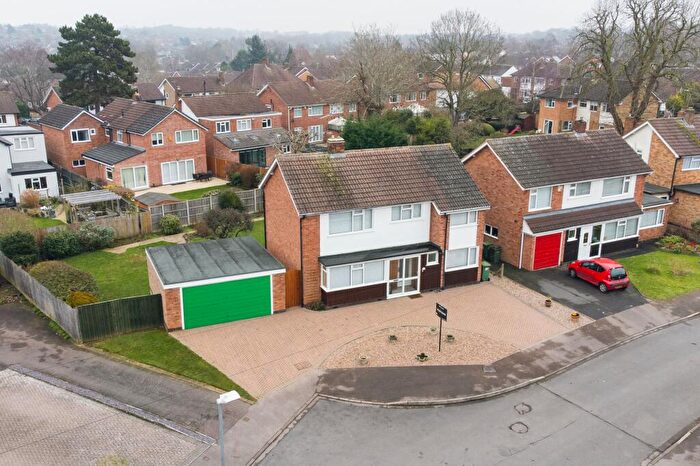
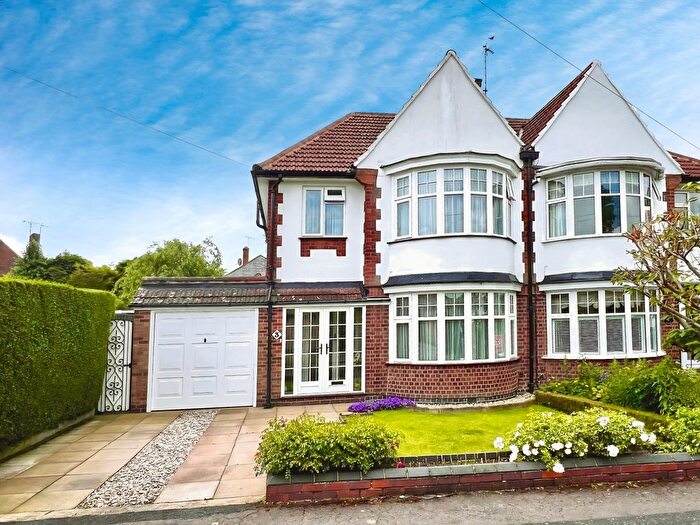
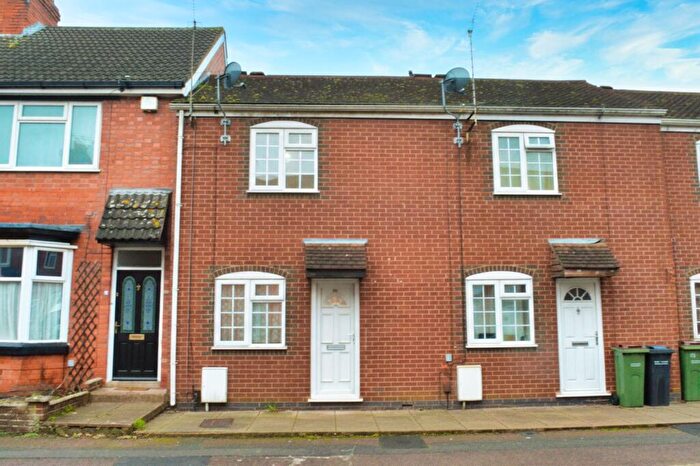
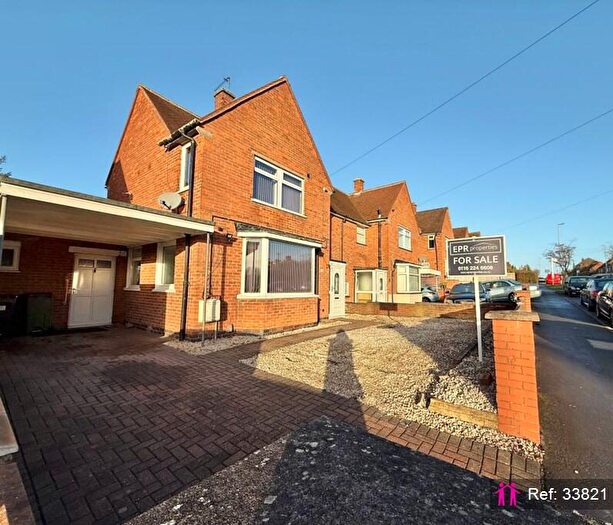
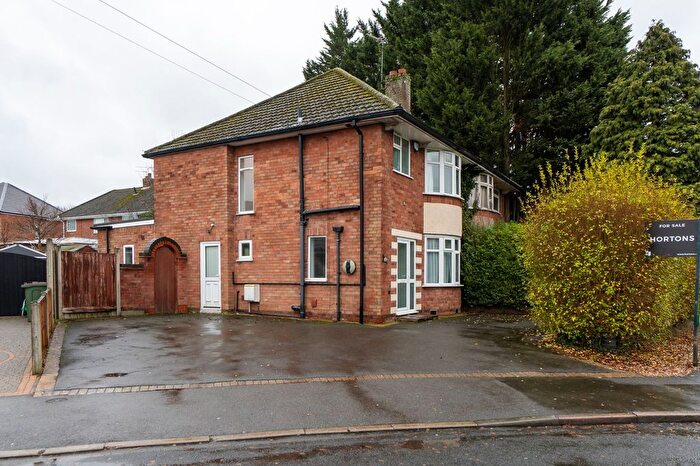
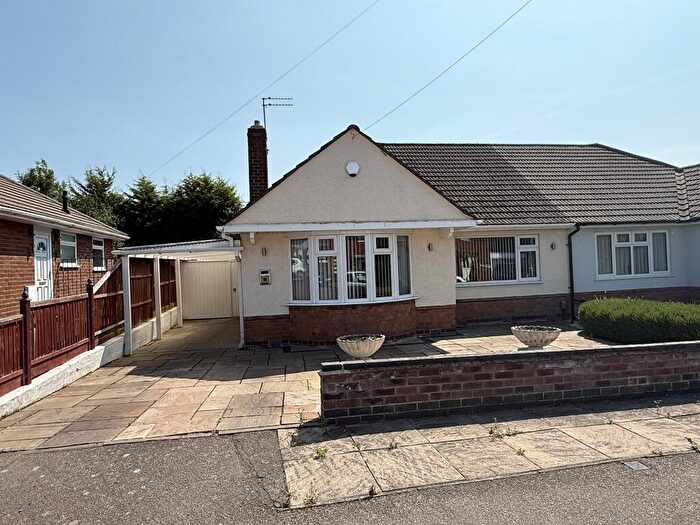
Houses for sale & to rent in Oadby St Peters, Leicester
House Prices in Oadby St Peters
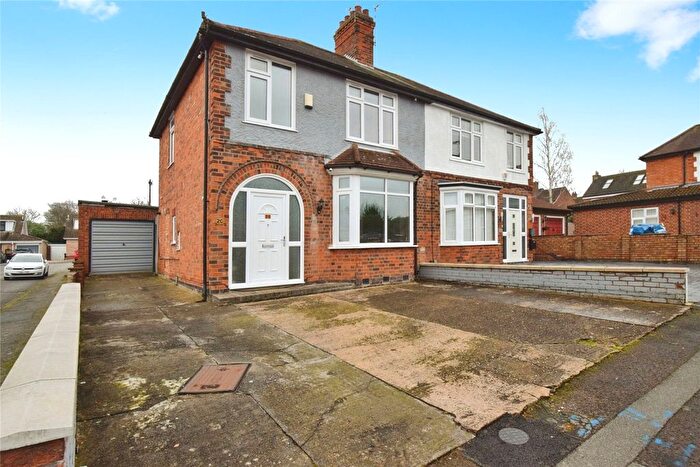
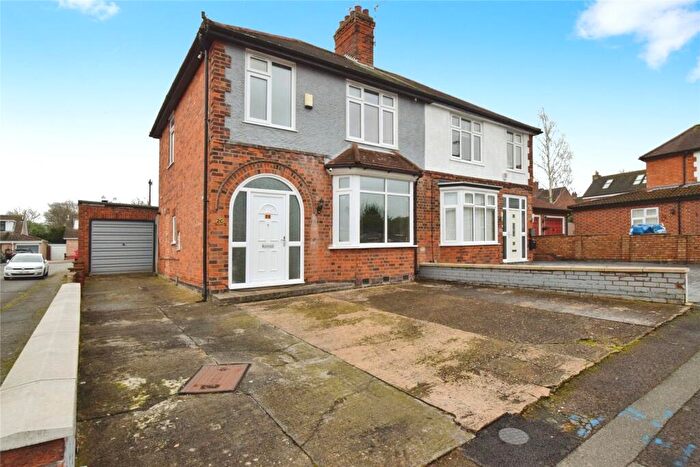
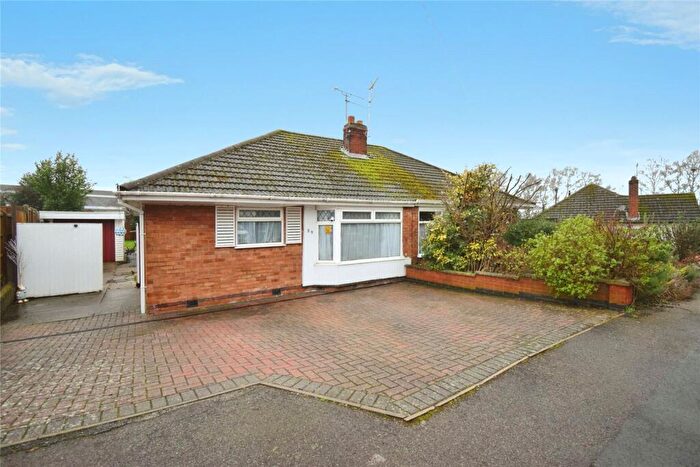
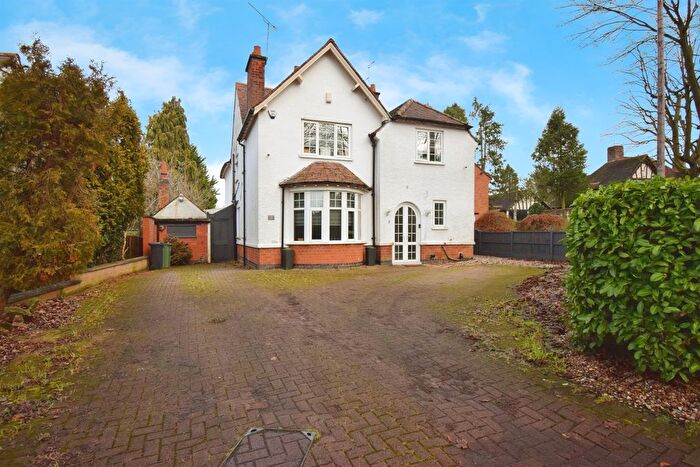
Properties in Oadby St Peters have an average house price of £262,333.28 and had 195 Property Transactions within the last 3 years¹.
Oadby St Peters is an area in Leicester, Leicestershire with 1,861 households², where the most expensive property was sold for £535,000.00.
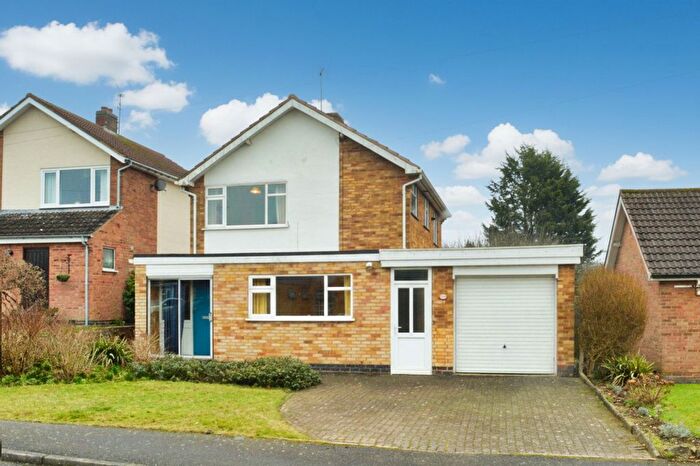
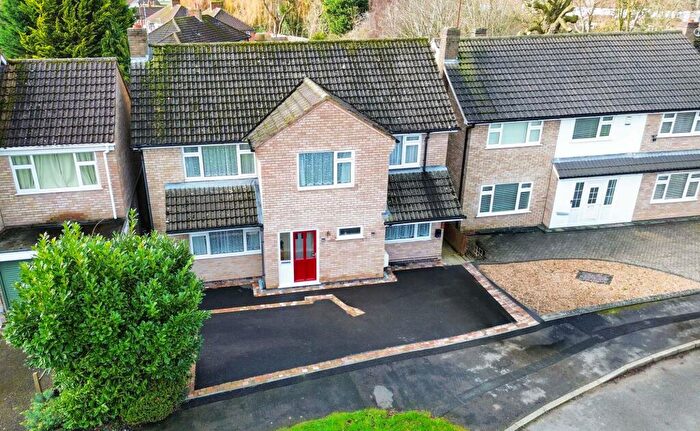
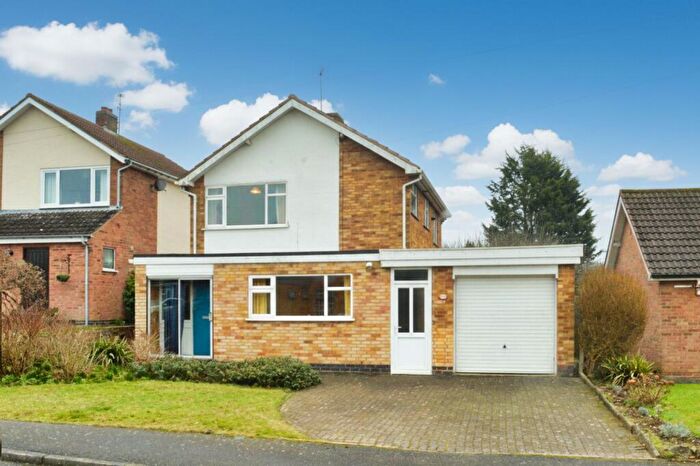
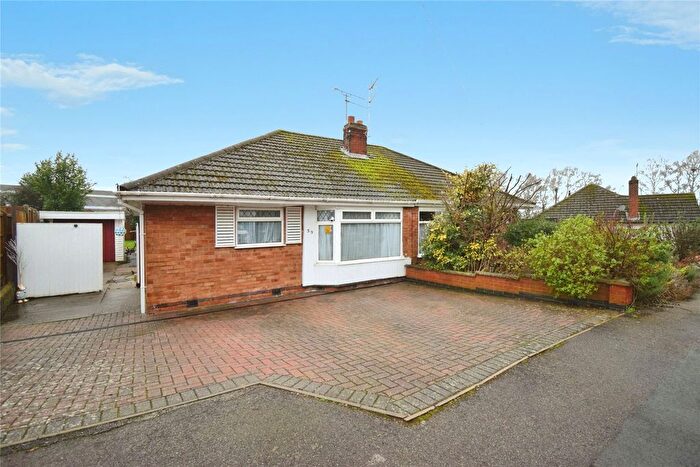
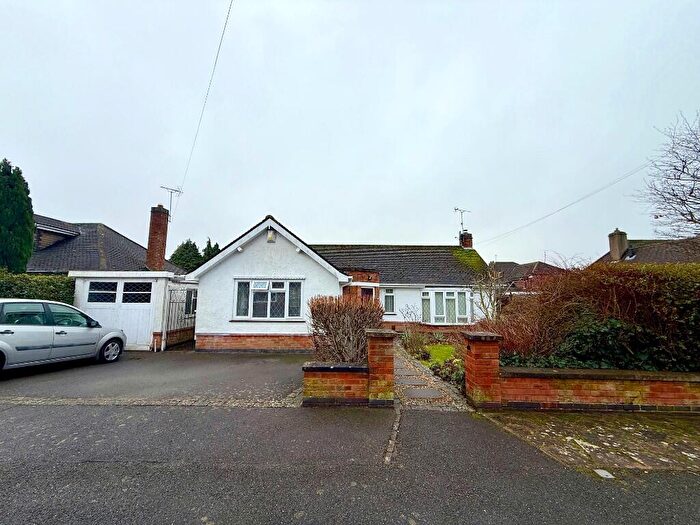
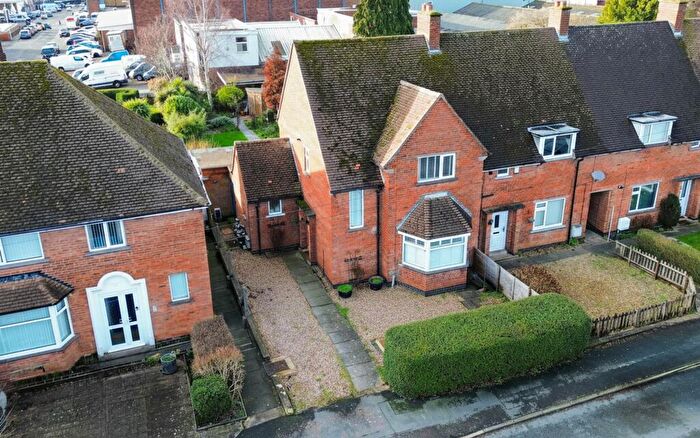
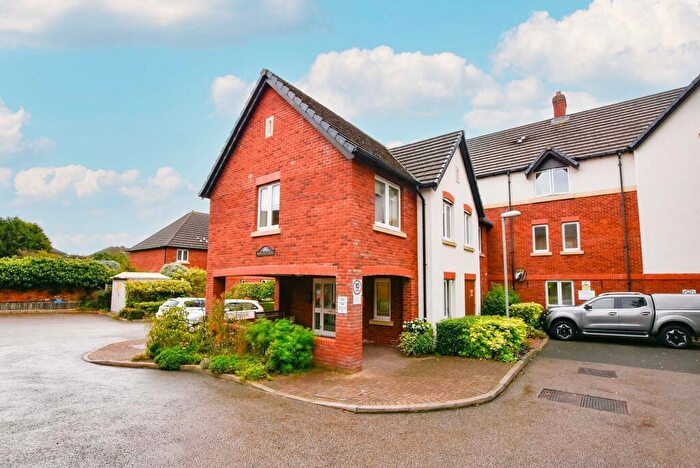
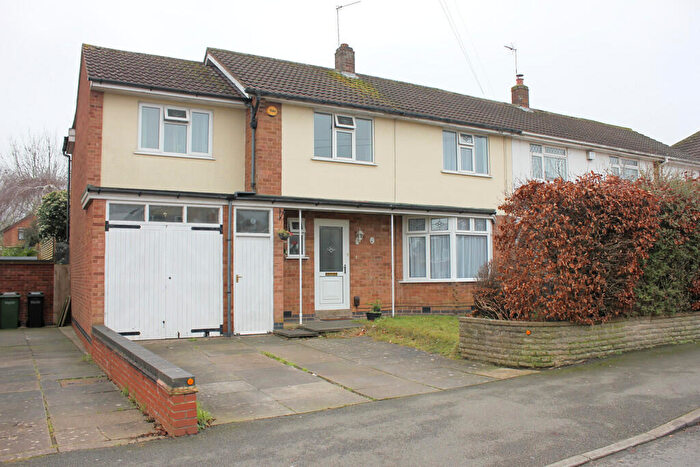
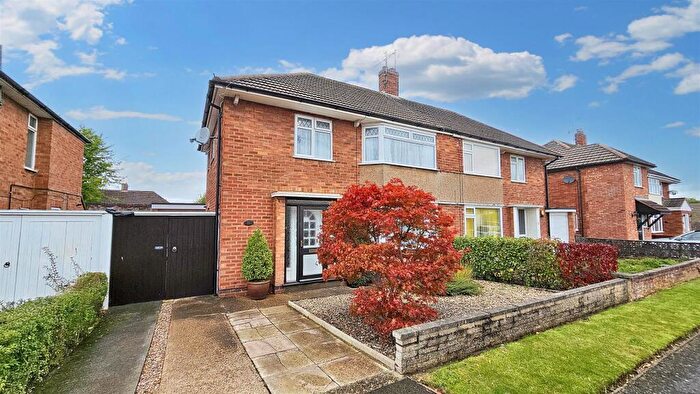
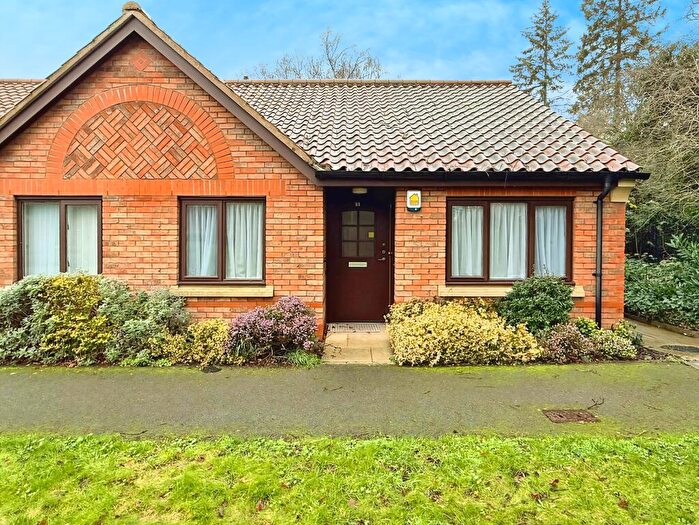
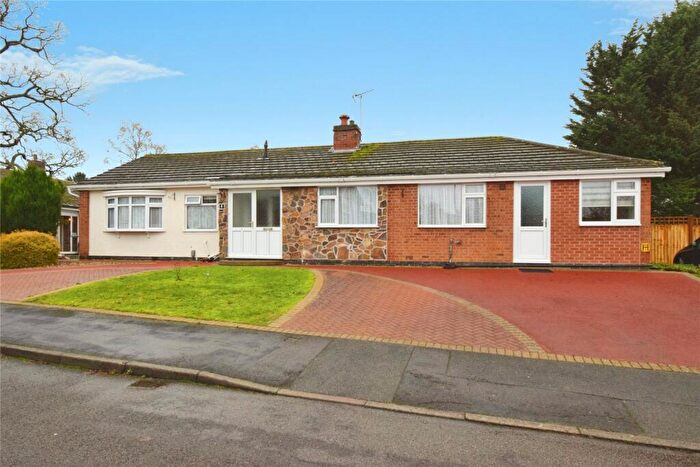
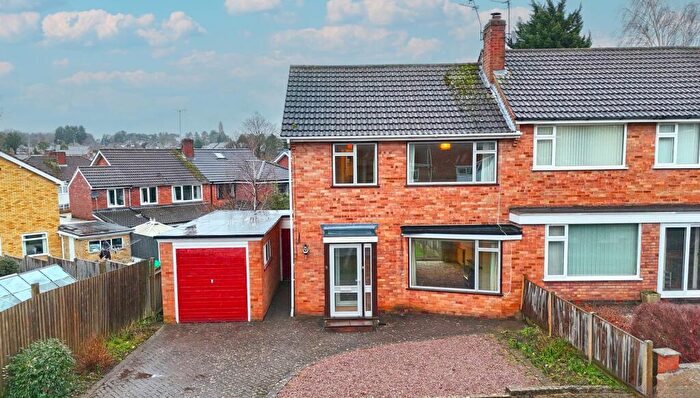
Properties for sale in Oadby St Peters
Roads and Postcodes in Oadby St Peters
Navigate through our locations to find the location of your next house in Oadby St Peters, Leicester for sale or to rent.
| Streets | Postcodes |
|---|---|
| Aintree Crescent | LE2 5GD |
| Albion Street | LE2 5DA |
| Beech Road | LE2 5QL |
| Brabazon Road | LE2 5HB LE2 5HD LE2 5HE LE2 5HF LE2 5HG LE2 5HH |
| Brambling Way | LE2 5PA LE2 5PB |
| Brampton Way | LE2 5FA |
| Brocks Hill Close | LE2 5RB |
| Brocks Hill Drive | LE2 5RD LE2 5RE LE2 5RT |
| Brooksby Close | LE2 5AB LE2 5AG |
| Brooksby Drive | LE2 5AA |
| Bruins Walk | LE2 5HJ |
| Carfax Avenue | LE2 5FB |
| Cartwright Drive | LE2 5HL LE2 5HN |
| Chapel Street | LE2 5AD |
| Chestnut Avenue | LE2 5JG LE2 5JH |
| Church Street | LE2 5DB |
| Churchill Close | LE2 5AJ LE2 5AP LE2 5AL LE2 5AN |
| Davenport Avenue | LE2 5HP LE2 5HQ |
| Drury Lane | LE2 5FD |
| East Street | LE2 5AF |
| Elms Close | LE2 5RG |
| Foxhunter Drive | LE2 5FE LE2 5FF LE2 5FG LE2 5FH |
| Garden Close | LE2 5PD |
| Goddards Close | LE2 5HA |
| Granville Avenue | LE2 5FJ LE2 5FL LE2 5FN |
| Greenbank Drive | LE2 5RP LE2 5RQ |
| Grosvenor Crescent | LE2 5FP |
| Harborough Road | LE2 4LA LE2 4LD |
| Hermitage Close | LE2 5QH |
| High Street | LE2 5DE |
| Honeybourne Close | LE2 5PJ |
| Honeywell Close | LE2 5QP LE2 5QQ |
| Iliffe Avenue | LE2 5HR LE2 5LH LE2 5LS |
| Kendrick Drive | LE2 5RR |
| Kenilworth Drive | LE2 5HS LE2 5LG LE2 5LT |
| Kilburn Avenue | LE2 5FQ |
| King Street | LE2 5DF |
| Lawyers Lane | LE2 5QN |
| Leicester Road | LE2 4AB LE2 4DF LE2 5BA LE2 5BD LE2 5GE LE2 4AL |
| London Road | LE2 5DG LE2 5DH LE2 5DJ LE2 5DL LE2 5DN LE2 5DP LE2 5DQ LE2 5EA |
| Lyndon Drive | LE2 5GA |
| Mandervell Road | LE2 5LQ LE2 5LR |
| Mercia Drive | LE2 5GB |
| Milton Gardens | LE2 5SA |
| New Street | LE2 5EB |
| North Street | LE2 5AH |
| Oadby Hill Drive | LE2 5GF |
| Onderby Mews | LE2 5AU |
| Paddock Close | LE2 5GG |
| Pomeroy Drive | LE2 5NE |
| Primrose Hill | LE2 5JA |
| Quinton Rise | LE2 5PN |
| Rosemead Drive | LE2 5PP LE2 5PQ LE2 5SB LE2 5SD LE2 5SE LE2 5SF |
| Sandhurst Street | LE2 5AR LE2 5AS LE2 5AT |
| Seagrave Drive | LE2 5GH LE2 5GJ |
| Selbury Drive | LE2 5NG |
| Siskin Hill | LE2 5PT |
| Southfields Avenue | LE2 5GL |
| St Pauls Court | LE2 5AW |
| St Peters Path | LE2 5PR |
| The Morwoods | LE2 5ED |
| The Parade | LE2 5BB LE2 5BF |
| Valentine Drive | LE2 5GN |
| Walnut Close | LE2 5QJ |
| Ward's End | LE2 5AQ |
| Wigston Road | LE2 5JD LE2 5QB LE2 5QD LE2 5QF LE2 5QG LE2 5QA LE2 5QE |
Transport near Oadby St Peters
- FAQ
- Price Paid By Year
- Property Type Price
Frequently asked questions about Oadby St Peters
What is the average price for a property for sale in Oadby St Peters?
The average price for a property for sale in Oadby St Peters is £262,333. This amount is 16% lower than the average price in Leicester. There are 1,280 property listings for sale in Oadby St Peters.
What streets have the most expensive properties for sale in Oadby St Peters?
The streets with the most expensive properties for sale in Oadby St Peters are Oadby Hill Drive at an average of £475,000, Quinton Rise at an average of £467,500 and Brocks Hill Close at an average of £400,000.
What streets have the most affordable properties for sale in Oadby St Peters?
The streets with the most affordable properties for sale in Oadby St Peters are THE PARADE at an average of £101,500, Sandhurst Street at an average of £138,868 and Honeywell Close at an average of £166,005.
Which train stations are available in or near Oadby St Peters?
Some of the train stations available in or near Oadby St Peters are South Wigston, Leicester and Narborough.
Property Price Paid in Oadby St Peters by Year
The average sold property price by year was:
| Year | Average Sold Price | Price Change |
Sold Properties
|
|---|---|---|---|
| 2025 | £254,915 | -5% |
46 Properties |
| 2024 | £267,935.15 | 2% |
68 Properties |
| 2023 | £261,843.21 | 7% |
81 Properties |
| 2022 | £243,953 | -3% |
73 Properties |
| 2021 | £251,664.53 | 3% |
86 Properties |
| 2020 | £243,471.3 | 7% |
54 Properties |
| 2019 | £225,219.1 | -2% |
72 Properties |
| 2018 | £230,183.67 | 14% |
64 Properties |
| 2017 | £196,881.15 | -0,4% |
61 Properties |
| 2016 | £197,601.43 | 13% |
90 Properties |
| 2015 | £172,672.6 | -1% |
93 Properties |
| 2014 | £173,990 | 10% |
74 Properties |
| 2013 | £156,643 | -4% |
55 Properties |
| 2012 | £163,281 | -6% |
72 Properties |
| 2011 | £173,361 | 7% |
71 Properties |
| 2010 | £160,621 | 10% |
59 Properties |
| 2009 | £143,927 | -6% |
61 Properties |
| 2008 | £152,162 | -20% |
57 Properties |
| 2007 | £181,853 | 7% |
100 Properties |
| 2006 | £169,068.8 | 2% |
117 Properties |
| 2005 | £165,274 | 4% |
111 Properties |
| 2004 | £159,190 | 18% |
78 Properties |
| 2003 | £130,089 | 16% |
82 Properties |
| 2002 | £109,485.48 | 15% |
93 Properties |
| 2001 | £93,475 | 17% |
83 Properties |
| 2000 | £77,475 | 7% |
75 Properties |
| 1999 | £71,812 | 8% |
88 Properties |
| 1998 | £66,352 | 18% |
69 Properties |
| 1997 | £54,586 | 5% |
74 Properties |
| 1996 | £51,611 | -1% |
74 Properties |
| 1995 | £52,165 | - |
58 Properties |
Property Price per Property Type in Oadby St Peters
Here you can find historic sold price data in order to help with your property search.
The average Property Paid Price for specific property types in the last three years are:
| Property Type | Average Sold Price | Sold Properties |
|---|---|---|
| Semi Detached House | £282,177.00 | 89 Semi Detached Houses |
| Detached House | £387,255.00 | 29 Detached Houses |
| Terraced House | £228,981.00 | 43 Terraced Houses |
| Flat | £146,017.65 | 34 Flats |

