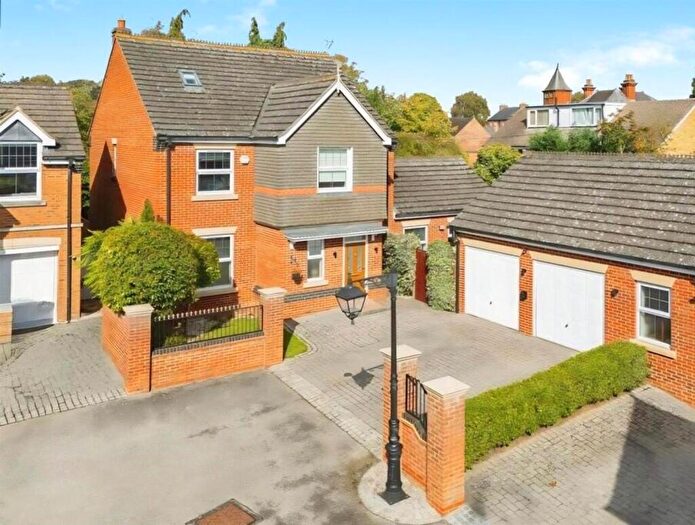
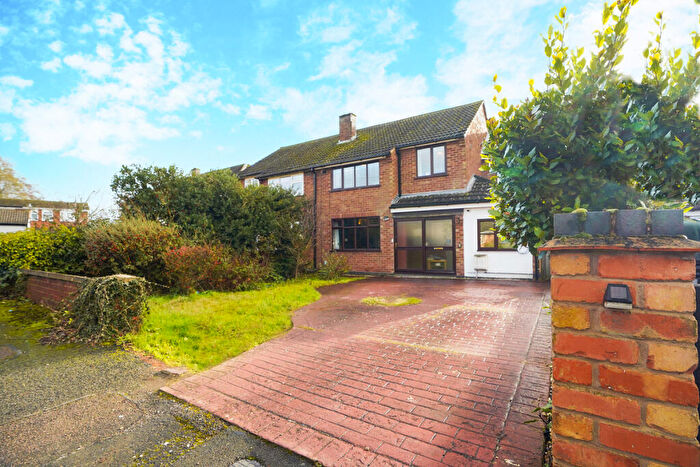
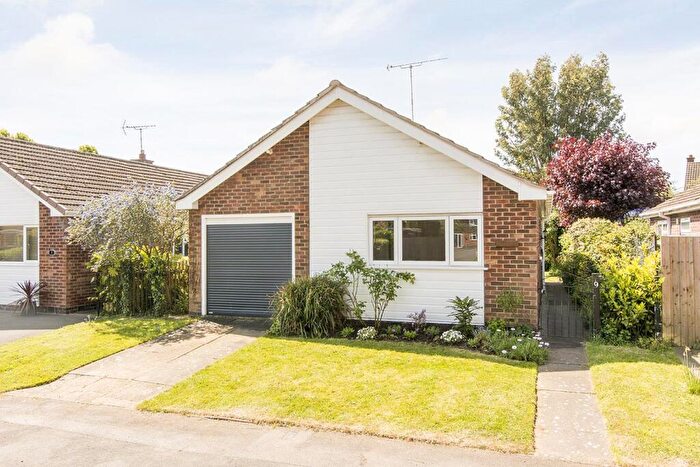
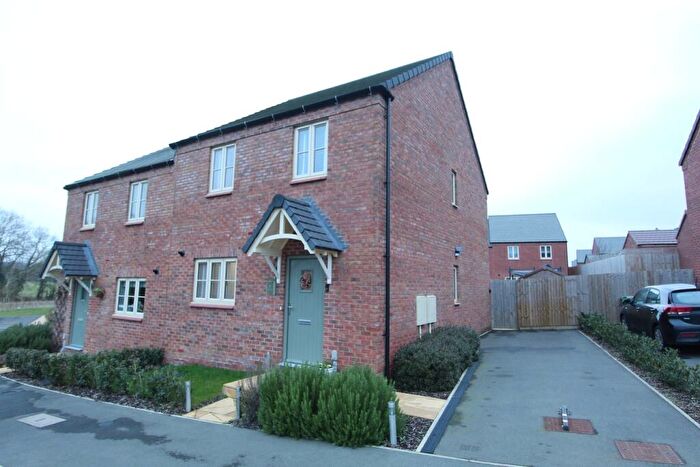
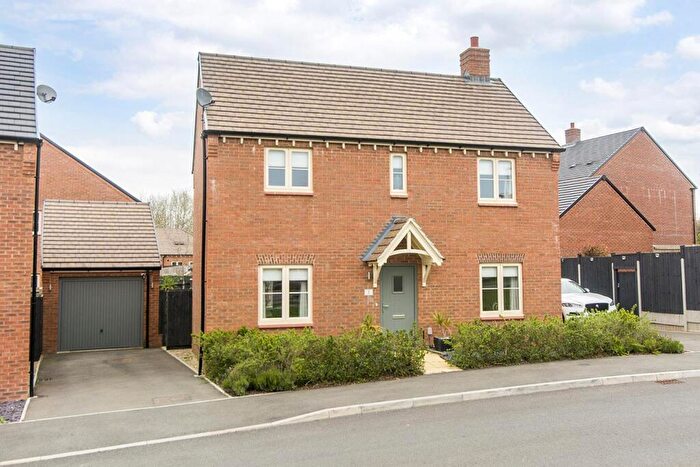
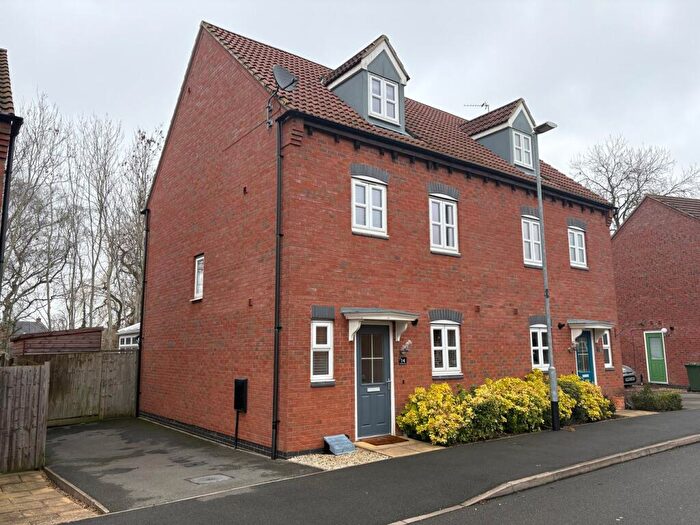
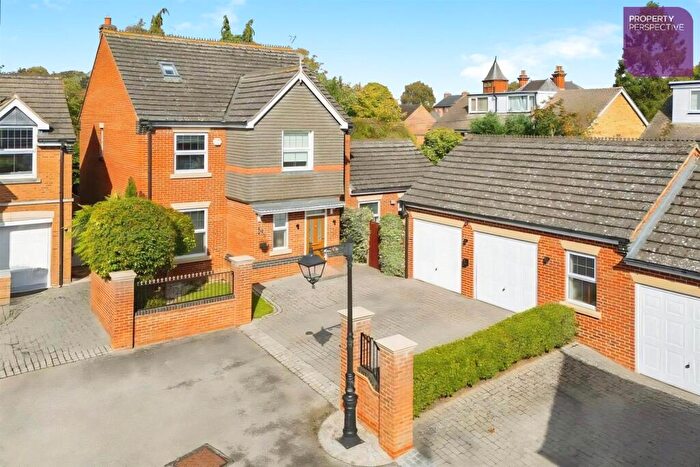
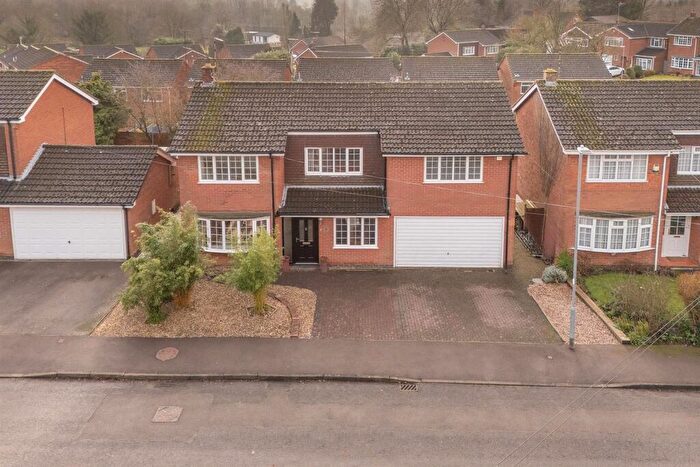
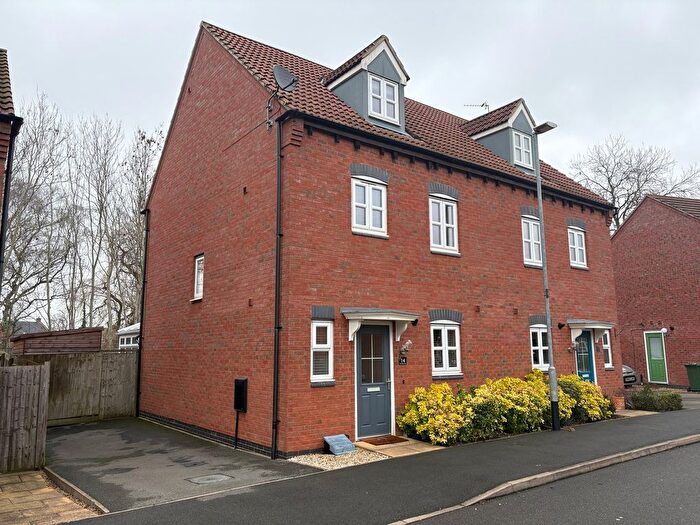
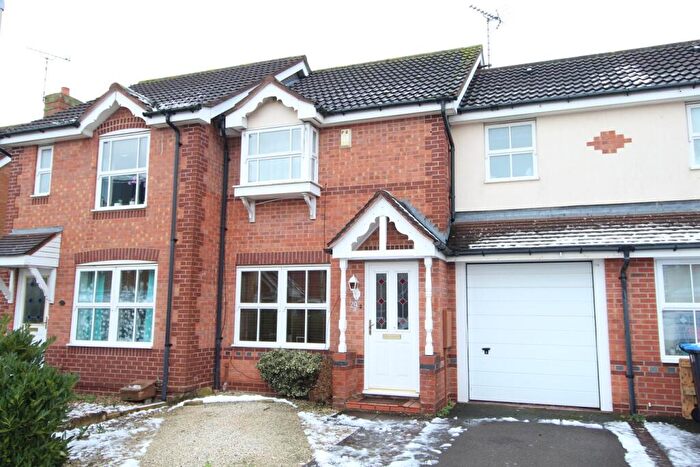
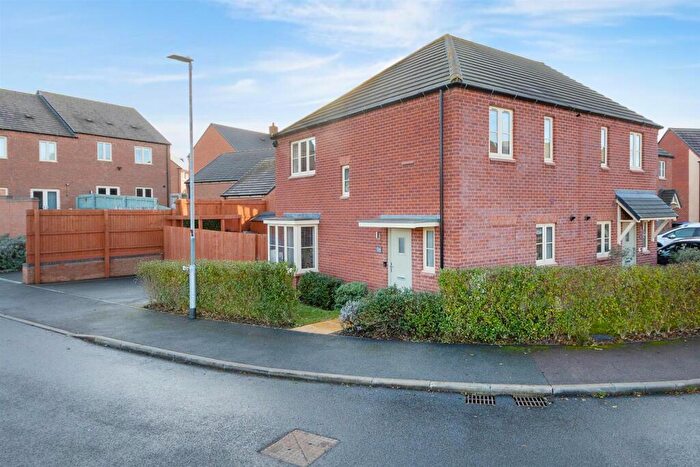
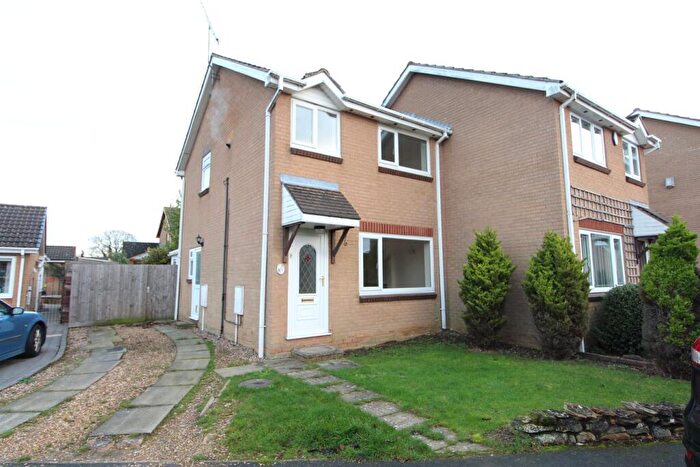
Houses for sale & to rent in Lutterworth Orchard, Lutterworth
House Prices in Lutterworth Orchard
Properties in Lutterworth Orchard have an average house price of £293,633.00 and had 79 Property Transactions within the last 3 years¹.
Lutterworth Orchard is an area in Lutterworth, Leicestershire with 913 households², where the most expensive property was sold for £630,000.00.
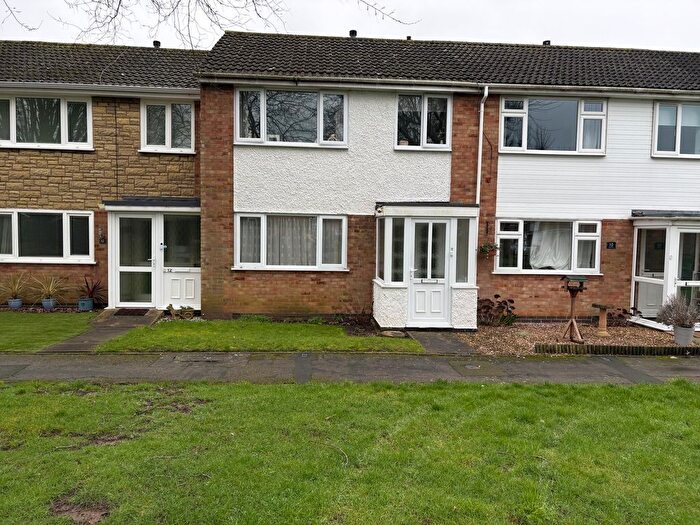
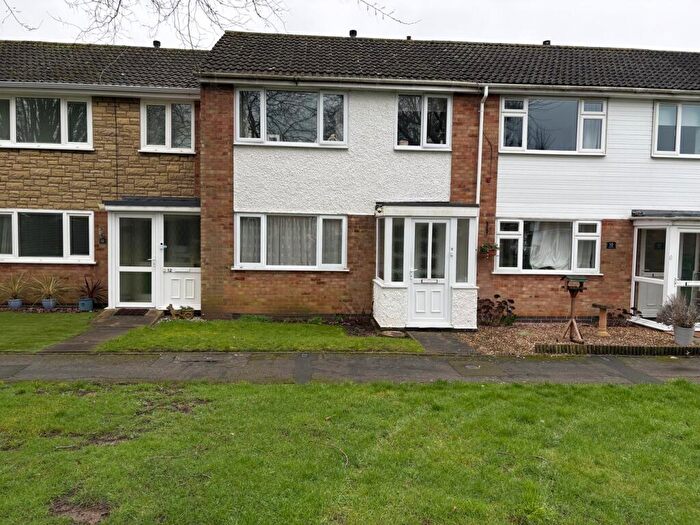
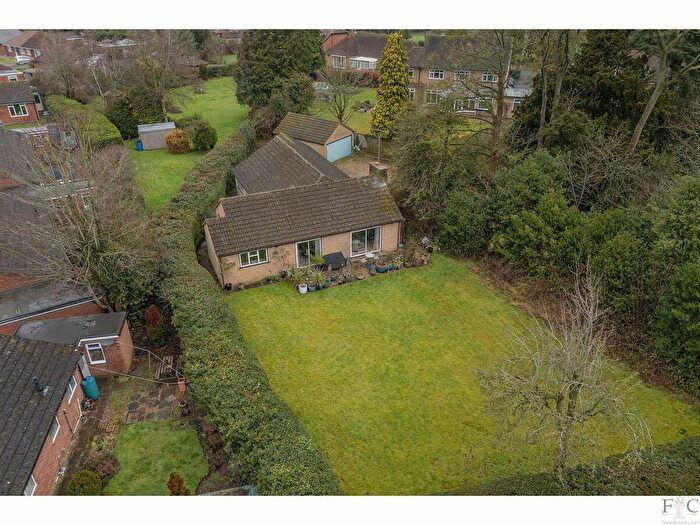
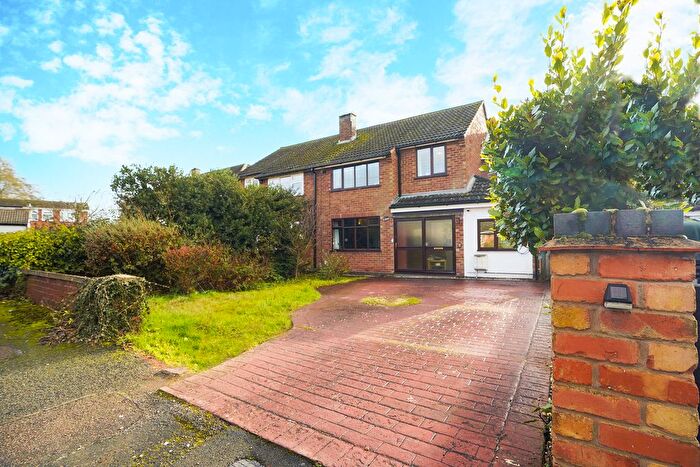
Properties for sale in Lutterworth Orchard
Roads and Postcodes in Lutterworth Orchard
Navigate through our locations to find the location of your next house in Lutterworth Orchard, Lutterworth for sale or to rent.
| Streets | Postcodes |
|---|---|
| Alder Crescent | LE17 4SR |
| Alexander Drive | LE17 4YF |
| Attlee Close | LE17 4YG |
| Avery Close | LE17 4PX |
| Cherrytree Avenue | LE17 4SZ |
| Cheshire Close | LE17 4YE |
| Chestnut Avenue | LE17 4TJ |
| Churchill Close | LE17 4YU |
| Coventry Road | LE17 4PT LE17 4QF LE17 4TA |
| Cunningham Drive | LE17 4YR |
| De Verdon Road | LE17 4QP |
| Elm Avenue | LE17 4SU |
| Elmhirst Road | LE17 4PZ LE17 4QB |
| Fairacre | LE17 4FA |
| Ferrers Road | LE17 4QR |
| Fir Tree Avenue | LE17 4SX |
| Gibson Way | LE17 4YJ |
| Greenacres Drive | LE17 4TE LE17 4TF |
| Holly Drive | LE17 4RG |
| Holmfield Close | LE17 4TB |
| Hunters Drive | LE17 4PU |
| Kingsway | LE17 4QA |
| Linden Drive | LE17 4SY |
| Maino Crescent | LE17 4QW |
| Meriton Road | LE17 4QD LE17 4QE |
| Montgomery Close | LE17 4YP |
| Moorbarns Lane | LE17 4JD |
| Mountbatten Way | LE17 4YD |
| Oakfield Avenue | LE17 4ST |
| Orchard Road | LE17 4DA |
| Poplar Avenue | LE17 4TH |
| Rowan Drive | LE17 4SP |
| Ryderway | LE17 4QL |
| St Johns Close | LE17 4QN |
| St Marys Road | LE17 4PS |
| Tedder Close | LE17 4YT |
| Watling Street | LE17 4HU |
| Wheeler Close | LE17 4DQ |
| Whittle Road | LE17 4PY |
| Willow Tree Crescent | LE17 4TD |
| Woodmarket | LE17 4BY LE17 4BZ LE17 4DB |
| Woodway Road | LE17 4QG LE17 4QQ |
Transport near Lutterworth Orchard
- FAQ
- Price Paid By Year
- Property Type Price
Frequently asked questions about Lutterworth Orchard
What is the average price for a property for sale in Lutterworth Orchard?
The average price for a property for sale in Lutterworth Orchard is £293,633. This amount is 24% lower than the average price in Lutterworth. There are 623 property listings for sale in Lutterworth Orchard.
What streets have the most expensive properties for sale in Lutterworth Orchard?
The streets with the most expensive properties for sale in Lutterworth Orchard are St Marys Road at an average of £563,166, Coventry Road at an average of £430,000 and Cunningham Drive at an average of £353,750.
What streets have the most affordable properties for sale in Lutterworth Orchard?
The streets with the most affordable properties for sale in Lutterworth Orchard are Orchard Road at an average of £206,583, St Johns Close at an average of £220,000 and Attlee Close at an average of £222,000.
Which train stations are available in or near Lutterworth Orchard?
Some of the train stations available in or near Lutterworth Orchard are Rugby, Narborough and Hinckley.
Property Price Paid in Lutterworth Orchard by Year
The average sold property price by year was:
| Year | Average Sold Price | Price Change |
Sold Properties
|
|---|---|---|---|
| 2025 | £290,266 | 3% |
24 Properties |
| 2024 | £281,720 | -8% |
24 Properties |
| 2023 | £305,462 | -1% |
31 Properties |
| 2022 | £307,041 | 15% |
24 Properties |
| 2021 | £259,612 | -2% |
43 Properties |
| 2020 | £264,808 | 15% |
24 Properties |
| 2019 | £223,951 | -19% |
34 Properties |
| 2018 | £266,102 | 15% |
40 Properties |
| 2017 | £225,002 | 4% |
37 Properties |
| 2016 | £216,476 | -6% |
26 Properties |
| 2015 | £229,598 | 18% |
46 Properties |
| 2014 | £188,151 | 11% |
32 Properties |
| 2013 | £166,525 | -13% |
32 Properties |
| 2012 | £187,922 | 4% |
24 Properties |
| 2011 | £180,610 | 10% |
25 Properties |
| 2010 | £161,657 | -12% |
21 Properties |
| 2009 | £180,284 | 10% |
20 Properties |
| 2008 | £162,507 | -5% |
28 Properties |
| 2007 | £169,950 | -7% |
36 Properties |
| 2006 | £182,541 | 5% |
54 Properties |
| 2005 | £173,148 | 14% |
48 Properties |
| 2004 | £149,464 | 16% |
33 Properties |
| 2003 | £125,882 | 11% |
41 Properties |
| 2002 | £112,461 | 14% |
44 Properties |
| 2001 | £96,509 | 18% |
60 Properties |
| 2000 | £79,114 | 1% |
47 Properties |
| 1999 | £78,532 | 5% |
59 Properties |
| 1998 | £74,618 | 15% |
48 Properties |
| 1997 | £63,576 | 2% |
58 Properties |
| 1996 | £62,073 | 3% |
62 Properties |
| 1995 | £60,475 | - |
70 Properties |
Property Price per Property Type in Lutterworth Orchard
Here you can find historic sold price data in order to help with your property search.
The average Property Paid Price for specific property types in the last three years are:
| Property Type | Average Sold Price | Sold Properties |
|---|---|---|
| Semi Detached House | £266,618.00 | 41 Semi Detached Houses |
| Detached House | £350,686.00 | 29 Detached Houses |
| Terraced House | £232,866.00 | 9 Terraced Houses |

