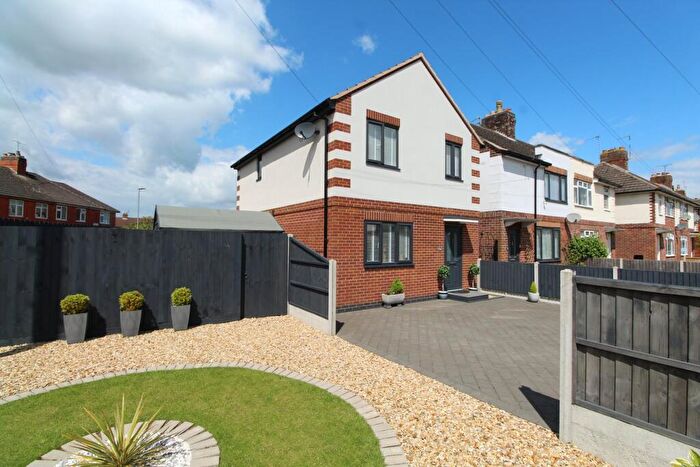
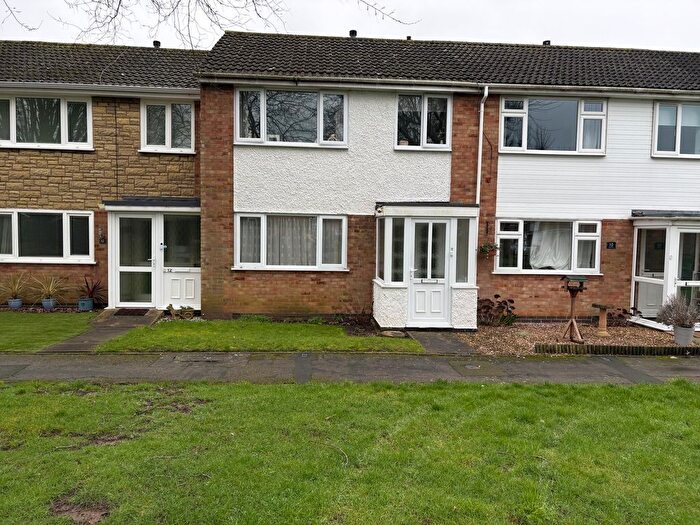
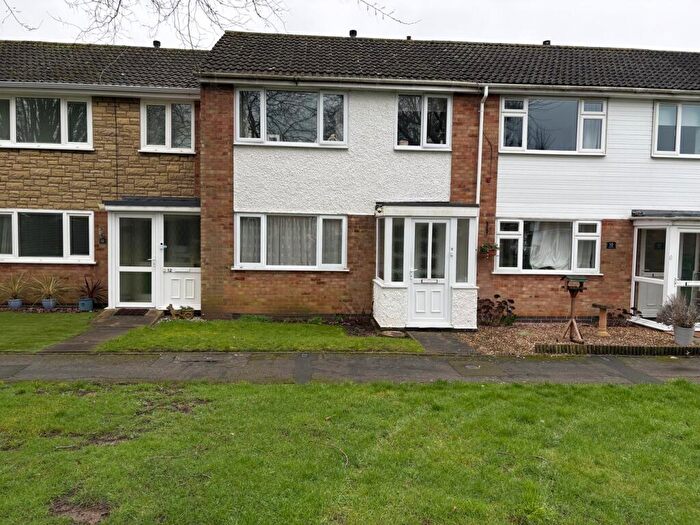
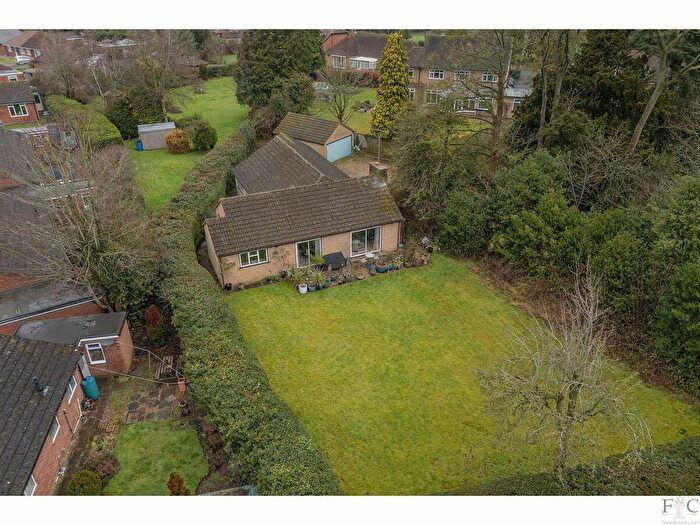
Houses for sale & to rent in Lutterworth Springs, Lutterworth
House Prices in Lutterworth Springs
Properties in Lutterworth Springs have an average house price of £280,443.00 and had 90 Property Transactions within the last 3 years¹.
Lutterworth Springs is an area in Lutterworth, Leicestershire with 918 households², where the most expensive property was sold for £675,000.00.
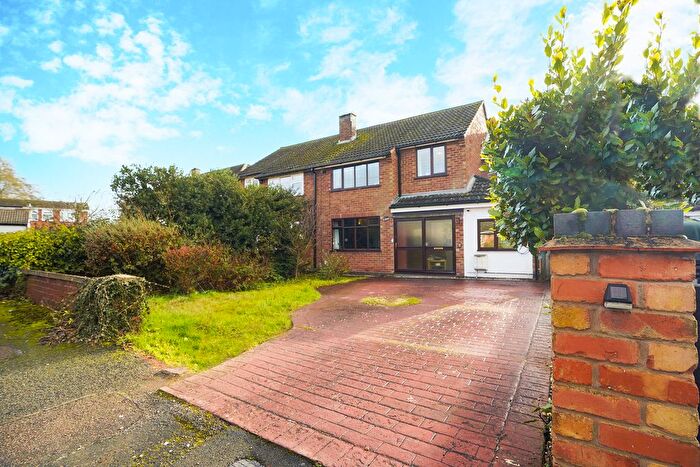
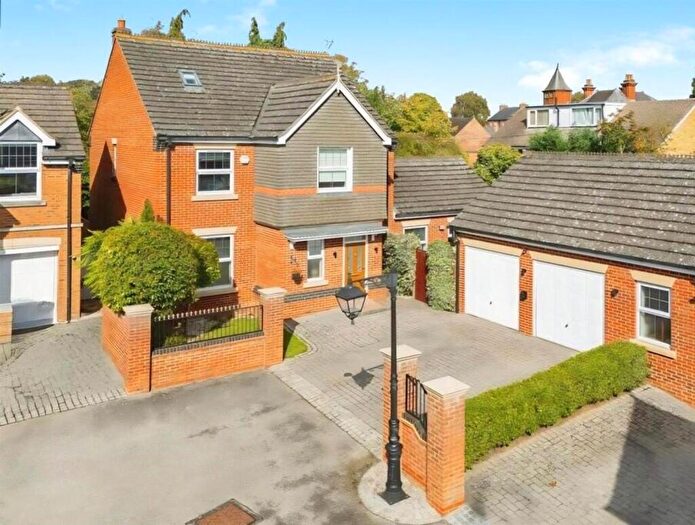
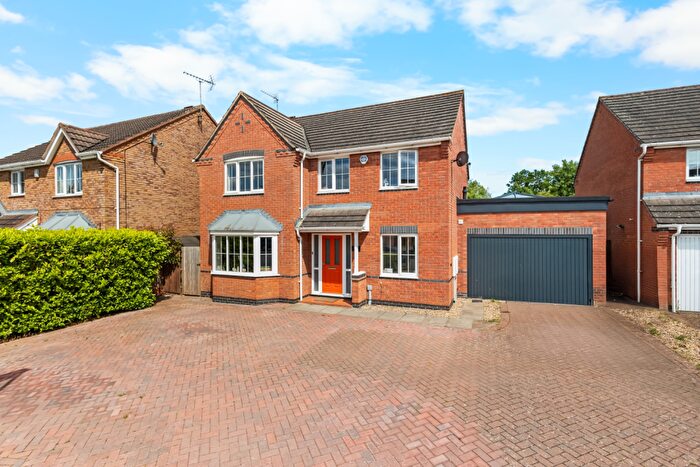
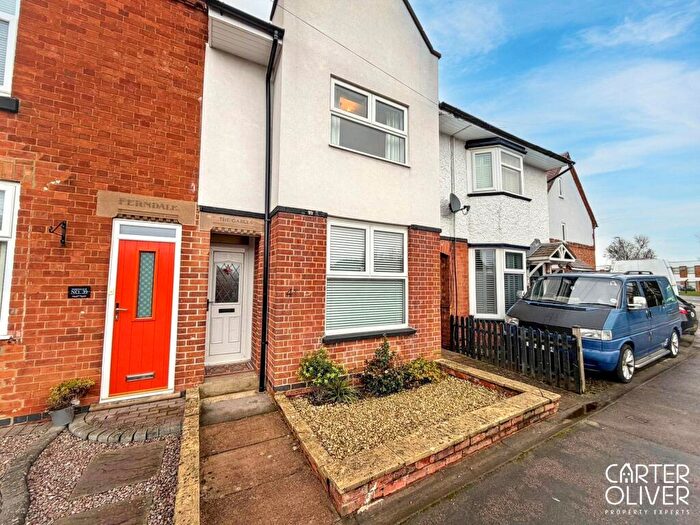
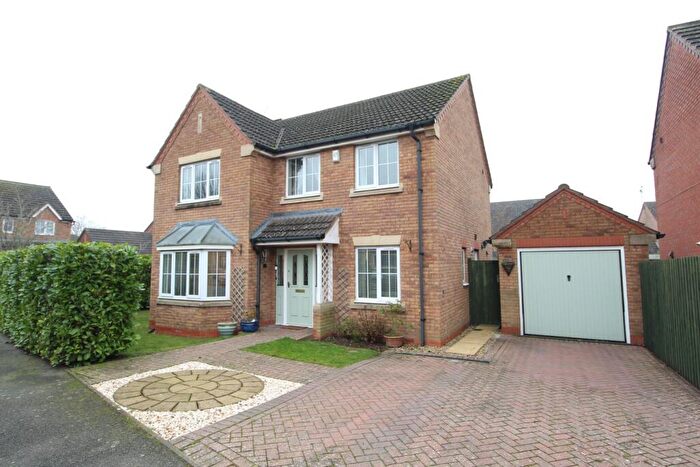
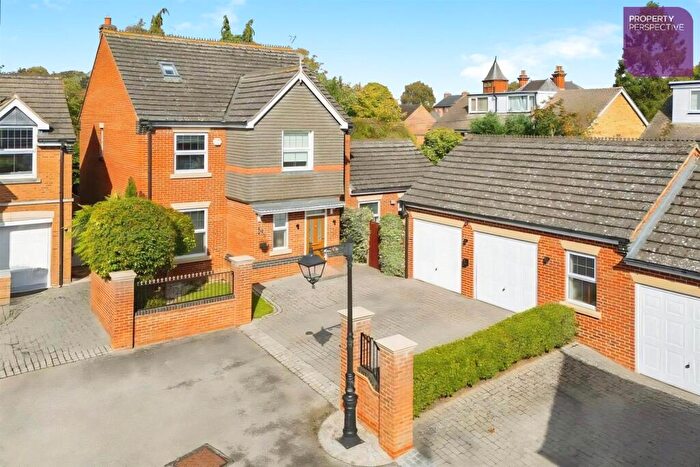
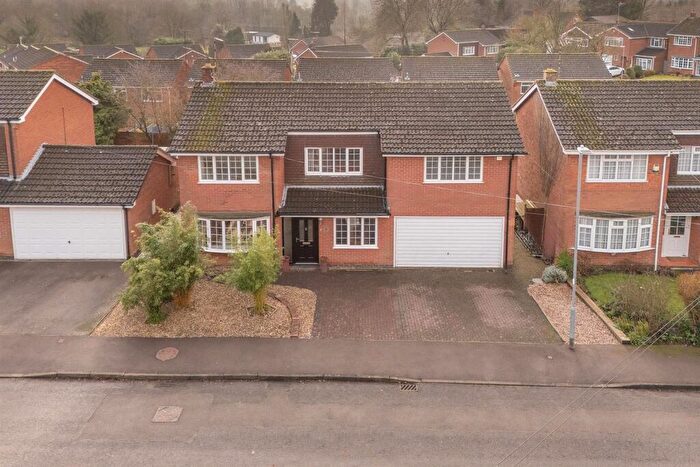
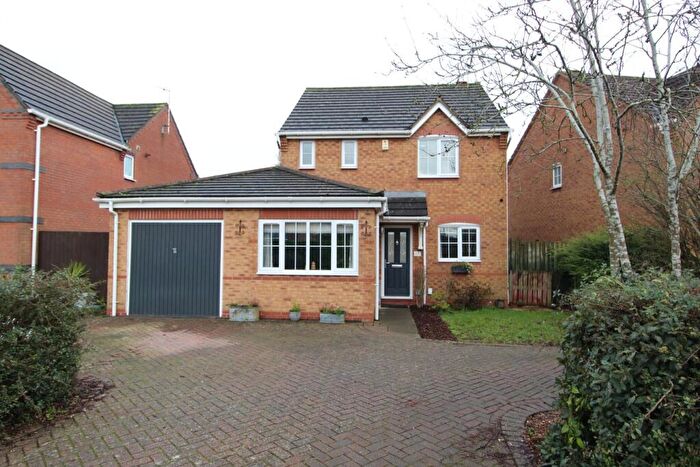
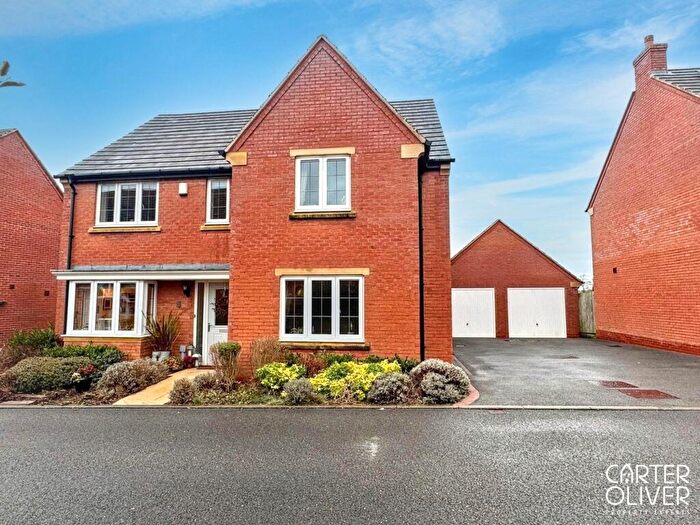
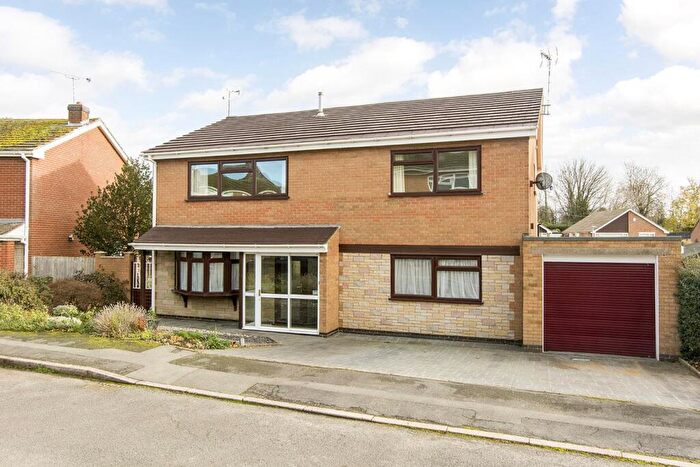
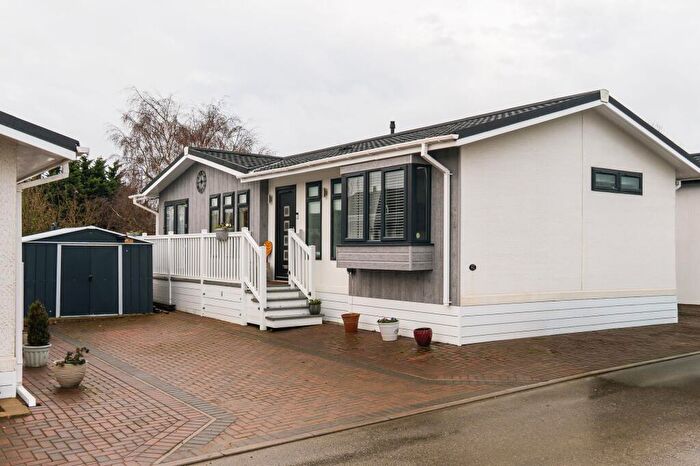
Properties for sale in Lutterworth Springs
Roads and Postcodes in Lutterworth Springs
Navigate through our locations to find the location of your next house in Lutterworth Springs, Lutterworth for sale or to rent.
| Streets | Postcodes |
|---|---|
| Baker Street | LE17 4BG |
| Bank Street | LE17 4AG |
| Bitteswell Road | LE17 4EL LE17 4EN LE17 4EX LE17 4EY LE17 4EZ |
| Boundary Road | LE17 4DS |
| Burton Close | LE17 4FJ |
| Carlson Gardens | LE17 4DP LE17 4DR |
| Carlson Terrace | LE17 4DT |
| Chapel Street | LE17 4EU |
| Church Gate | LE17 4AN |
| Church Street | LE17 4AL LE17 4AW |
| Council Street | LE17 4PF |
| Coventry Road | LE17 4RB LE17 4RE LE17 4RF |
| Faringdon Avenue | LE17 4DJ |
| Foxfield Close | LE17 4FT |
| George Street | LE17 4ED LE17 4EF LE17 4EG LE17 4EQ |
| Gilmorton Road | LE17 4DY LE17 4DZ |
| Gladstone Street | LE17 4EA |
| Goscote Drive | LE17 4ES |
| Guthlaxton Avenue | LE17 4ET |
| High Street | LE17 4AY LE17 4AZ |
| Leyton Close | LE17 4AR |
| Lower Leicester Road | LE17 4NF LE17 4NG |
| Market Street | LE17 4EH |
| Marlborough Place | LE17 4DE |
| Marylebone Drive | LE17 4DL |
| Mill Grove | LE17 4BS |
| Misterton Way | LE17 4AB |
| New Street | LE17 4PJ LE17 4PQ |
| Newall Close | LE17 4FG |
| Orange Hill | LE17 4BT |
| Regent Street | LE17 4BB LE17 4BD |
| Riverside Road | LE17 4BP |
| Rugby Road | LE17 4BN LE17 4BW LE17 4HN |
| Rye Hill Avenue | LE17 4AS |
| Spencer Road | LE17 4PG |
| Spring Close | LE17 4DD |
| Station Road | LE17 4AP |
| The Cutchel | LE17 4DH |
| The Hill Drive | LE17 4BJ |
| The Hollow | LE17 4BL |
| Walker Manor Court | LE17 4ER |
| Woodmarket | LE17 4BX |
| Wycliffe Terrace | LE17 4DX |
Transport near Lutterworth Springs
- FAQ
- Price Paid By Year
- Property Type Price
Frequently asked questions about Lutterworth Springs
What is the average price for a property for sale in Lutterworth Springs?
The average price for a property for sale in Lutterworth Springs is £280,443. This amount is 27% lower than the average price in Lutterworth. There are 658 property listings for sale in Lutterworth Springs.
What streets have the most expensive properties for sale in Lutterworth Springs?
The streets with the most expensive properties for sale in Lutterworth Springs are Coventry Road at an average of £542,500, Bitteswell Road at an average of £524,166 and Foxfield Close at an average of £450,000.
What streets have the most affordable properties for sale in Lutterworth Springs?
The streets with the most affordable properties for sale in Lutterworth Springs are Wycliffe Terrace at an average of £163,000, Guthlaxton Avenue at an average of £165,000 and Carlson Terrace at an average of £180,000.
Which train stations are available in or near Lutterworth Springs?
Some of the train stations available in or near Lutterworth Springs are Rugby, Narborough and Hinckley.
Property Price Paid in Lutterworth Springs by Year
The average sold property price by year was:
| Year | Average Sold Price | Price Change |
Sold Properties
|
|---|---|---|---|
| 2025 | £307,214 | 11% |
28 Properties |
| 2024 | £273,081 | 4% |
36 Properties |
| 2023 | £261,807 | -12% |
26 Properties |
| 2022 | £294,004 | -13% |
46 Properties |
| 2021 | £332,877 | 15% |
37 Properties |
| 2020 | £282,410 | 20% |
33 Properties |
| 2019 | £224,940 | -2% |
30 Properties |
| 2018 | £230,382 | -2% |
35 Properties |
| 2017 | £235,996 | 9% |
39 Properties |
| 2016 | £214,876 | 10% |
39 Properties |
| 2015 | £192,624 | 2% |
32 Properties |
| 2014 | £188,610 | 4% |
37 Properties |
| 2013 | £180,707 | -4% |
42 Properties |
| 2012 | £187,516 | 1% |
30 Properties |
| 2011 | £185,645 | -15% |
27 Properties |
| 2010 | £213,450 | 17% |
20 Properties |
| 2009 | £177,733 | 5% |
21 Properties |
| 2008 | £169,236 | -14% |
30 Properties |
| 2007 | £192,338 | 7% |
41 Properties |
| 2006 | £178,379 | -3% |
56 Properties |
| 2005 | £183,319 | 10% |
43 Properties |
| 2004 | £164,794 | 10% |
49 Properties |
| 2003 | £148,743 | 21% |
56 Properties |
| 2002 | £117,618 | 14% |
61 Properties |
| 2001 | £101,713 | 3% |
69 Properties |
| 2000 | £98,677 | 28% |
38 Properties |
| 1999 | £71,051 | -21% |
62 Properties |
| 1998 | £86,279 | 19% |
44 Properties |
| 1997 | £69,560 | 17% |
41 Properties |
| 1996 | £57,538 | 2% |
47 Properties |
| 1995 | £56,443 | - |
31 Properties |
Property Price per Property Type in Lutterworth Springs
Here you can find historic sold price data in order to help with your property search.
The average Property Paid Price for specific property types in the last three years are:
| Property Type | Average Sold Price | Sold Properties |
|---|---|---|
| Semi Detached House | £236,500.00 | 27 Semi Detached Houses |
| Detached House | £359,444.00 | 36 Detached Houses |
| Terraced House | £223,171.00 | 26 Terraced Houses |
| Flat | £112,000.00 | 1 Flat |

