
Houses for sale in Misterton, Lutterworth
House Prices in Misterton
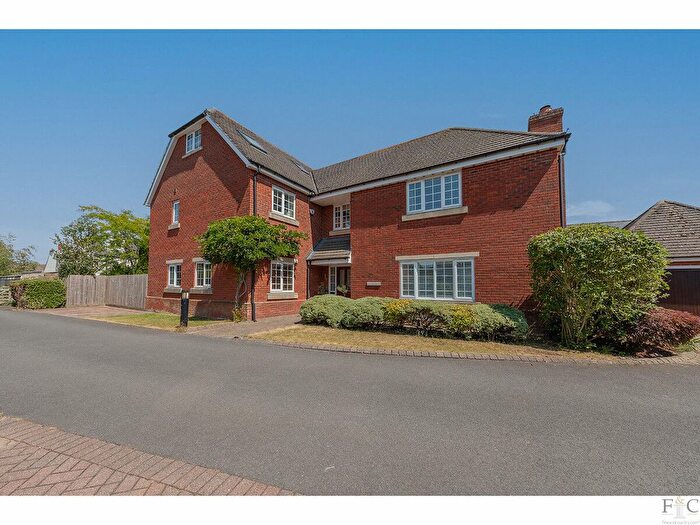
Properties in Misterton have an average house price of £480k and had 88 Property Transactions within the last 3 years¹.
Misterton is an area in Lutterworth, Leicestershire with 1,191 households², where the most expensive property was sold for £1.35M.
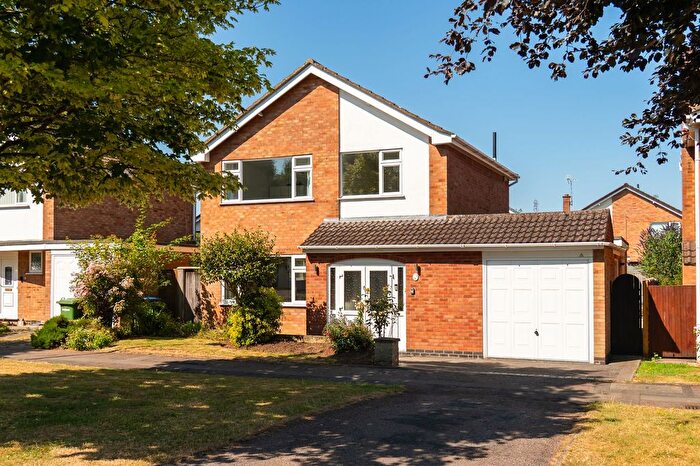
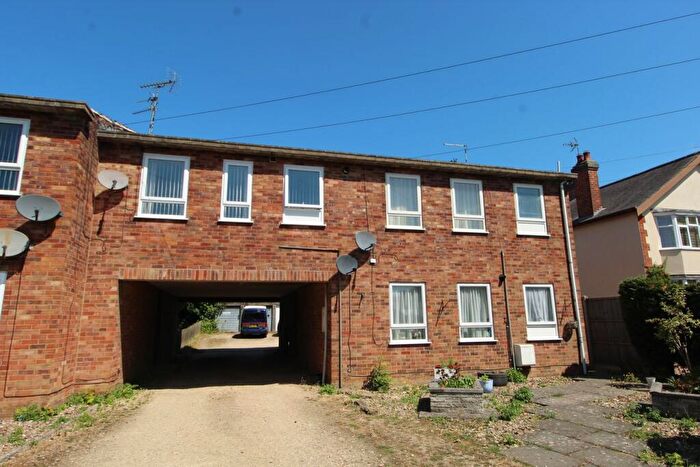
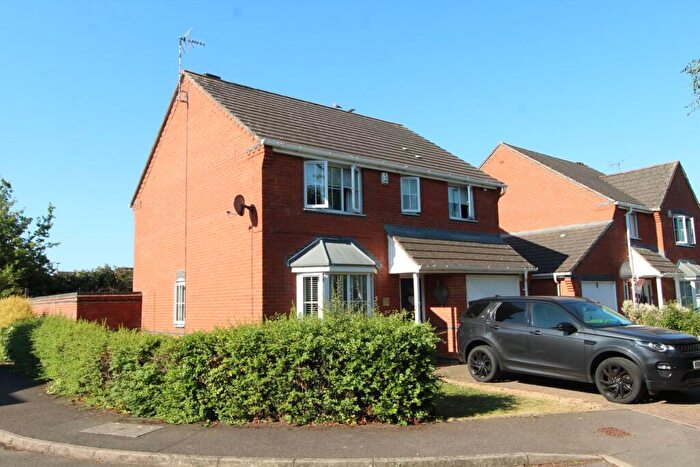
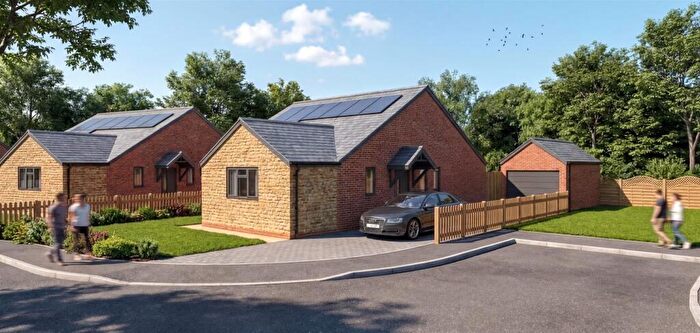
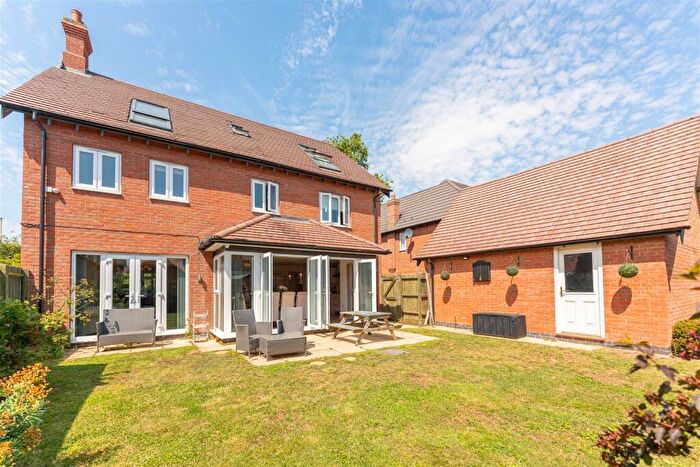
Properties for sale in Misterton
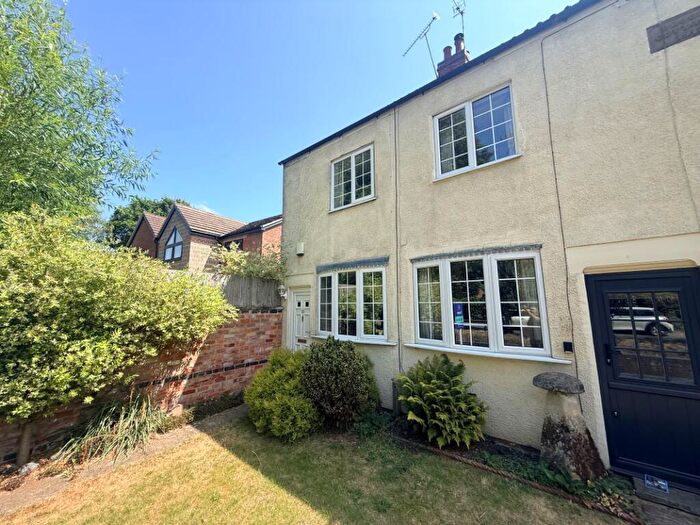

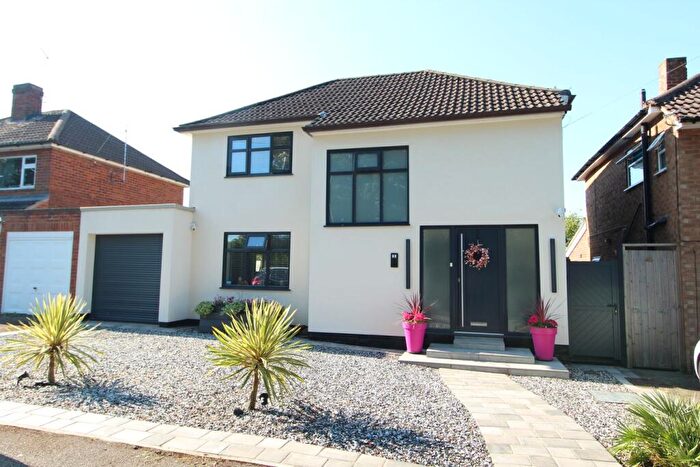
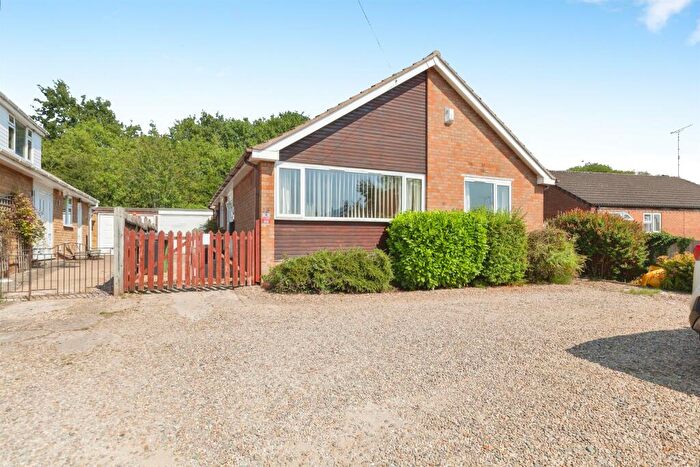
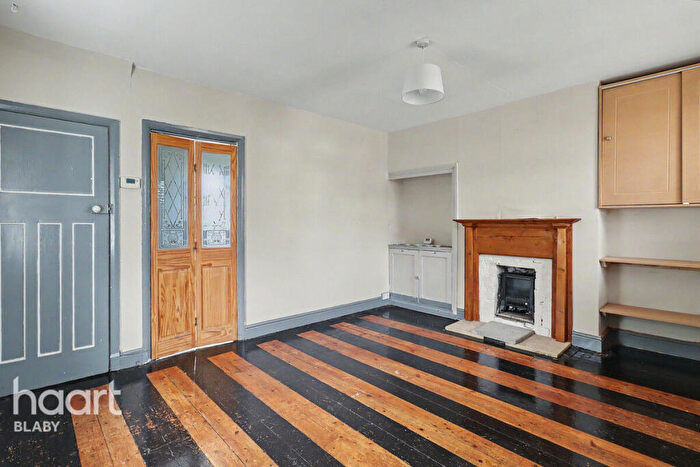
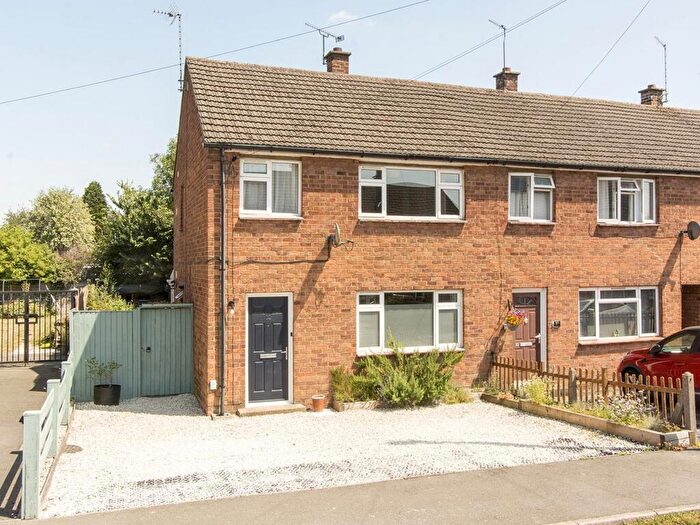
![]()
If you are looking to sell your house, let it out, or receive a property valuation, an expert can help you.
Click the button below to get started.

Roads and Postcodes in Misterton
Navigate through our locations to find the location of your next house in Misterton, Lutterworth for sale or to rent.
| Streets | Postcodes |
|---|---|
| Albert Close | LE17 5FX |
| Bonehams Lane | LE17 5FA LE17 5SB |
| Brook Street | LE17 4JR |
| Burdett Close | LE17 5NU |
| Catthorpe Lane | LE17 6AW |
| Catthorpe Road | LE17 6AN LE17 6AQ |
| Chandler Drive | LE17 5FS |
| Chapel Fields | LE17 6BS |
| Chapel Lane | LE17 4JS |
| Chapel Street | LE17 6AZ |
| Chestnut Drive | LE17 5FU |
| Church Drive | LE17 5LR LE17 5PF |
| Church Lane | LE17 5LU LE17 6AL |
| Church Walk | LE17 6AY |
| Clay Drive | LE17 5SL |
| Council Houses | LE17 5LY |
| Cromwell Close | LE17 4JJ |
| Elm Lane | LE17 6DD |
| Fir Tree Lane | LE17 6BH |
| Foxglove Drive | LE17 6EN |
| Franks Road | LE17 4JX |
| Gibbet Lane | LE17 6AA LE17 6AB LE17 6AJ |
| Gilden Drive | LE17 5FW |
| Gilmorton Road | LE17 4LD LE17 4LE LE17 5RY |
| Glenview Close | LE17 6EB |
| Grange Close | LE17 5SG |
| Hermitage Close | LE17 6EJ |
| High Street | LE17 6BL |
| Hilly Hollow | LE17 5SN |
| Home Farm Close | LE17 5LP |
| Kilworth Road | LE17 6BQ |
| Kimcote Road | LE17 5SP LE17 5PL |
| Lilbourne Lane | LE17 6DE LE17 6EH |
| Lilbourne Road | LE17 6DF |
| Lutterworth Road | LE17 4JN LE17 4JU LE17 4JW LE17 5NY LE17 5NZ LE17 5PH LE17 5PN LE17 5PW LE17 6AE LE17 6AF LE17 6AH LE17 6AU LE17 6BA LE17 6BB LE17 6JF |
| Lynmouth Drive | LE17 5PG |
| Lynton Close | LE17 5PQ |
| Mackaness Close | LE17 5PP |
| Main Street | LE17 4HX LE17 4HZ LE17 5LS LE17 5LT LE17 5LX LE17 5NX LE17 5PA LE17 6AG LE17 6DB |
| Manor Farm Drive | LE17 6DJ |
| Mill Lane | LE17 5PB |
| Nether Farm Close | LE17 5QD |
| North Street | LE17 6BE |
| Orchard Close | LE17 5PS |
| Porlock Drive | LE17 5PE |
| Rectory Close | LE17 6BR |
| Rugby Road | LE17 4HS LE17 6BN LE17 6BP LE17 6BW LE17 6DA |
| School Lane | LE17 6BG |
| Shambles Close | LE17 4LB |
| Shawell Lane | LE17 6FN LE17 4HR |
| Shawell Road | LE17 6AX |
| Simons Close | LE17 6BU |
| Skylark Close | LE17 6BY |
| South Kilworth Road | LE17 4LA |
| Spinney Close | LE17 5PR |
| Stanford Road | LE17 6FR LE17 6BJ |
| Swinford Road | LE17 4HP LE17 4JY LE17 4JZ LE17 6AD LE17 6AP LE17 6DG LE17 6DQ |
| Tealby Close | LE17 5PT |
| The Close | LE17 6BD |
| The Nook | LE17 4LJ |
| The Orchard | LE17 6BX |
| The Precinct | LE17 4HY |
| The Springs | LE17 6HP |
| Three Pots Lane | LE17 5SH |
| Turville Road | LE17 5LZ |
| Ullesthorpe Road | LE17 5PD |
| Walcote Road | LE17 5PJ |
| Wellington Drive | LE17 5SJ |
| Whitethorns Close | LE17 6BF |
| Woodcock Close | LE17 5SE |
| LE17 4HT LE17 4JP LE17 4JT LE17 4LF LE17 4LQ LE17 4LY LE17 6DH |
Property price trends in Misterton
According to the latest Land Registry data, the average home in Misterton sold for £537,500 in 2026. That figure comes from 1,413 sales logged over the past 31 years.
Prices have continued to climb over the last three years. Compared with 2023, when the typical sale came in around £430,966, that's a rise of roughly 24.7%.
Looking back five years, average prices are up about 28.5% since 2021, a gain of around £119,266 in cash terms.
Zoom out to the past decade for the fuller picture. Back in 2016, homes here averaged £355,103, so the typical sold price has climbed about 51.4% since then, roughly 4.2% a year. Stretch the view to fifteen years and that annual pace edges up closer to 4.8%.
Frequently asked questions about Misterton
What is the average price for a property for sale in Misterton?
The average price for a property for sale in Misterton is £480,000. This amount is 24% higher than the average price in Lutterworth. There are 1,287 property listings for sale in Misterton.
What streets have the most expensive properties for sale in Misterton?
The streets with the most expensive properties for sale in Misterton are Lynmouth Drive at an average of £801,000, Three Pots Lane at an average of £750,000 and Stanford Road at an average of £732,500.
What streets have the most affordable properties for sale in Misterton?
The streets with the most affordable properties for sale in Misterton are Orchard Close at an average of £196,000, Cromwell Close at an average of £215,000 and Home Farm Close at an average of £252,500.
Which train stations are available in or near Misterton?
Some of the train stations available in or near Misterton are Rugby, Narborough and South Wigston.
Property Price Paid in Misterton by Year
The average sold property price by year was:
| Year | Average Sold Price | Price Change |
Sold Properties
|
|---|---|---|---|
| 2026 | £537,500 | -2% |
4 Properties |
| 2025 | £548,387 | 19% |
31 Properties |
| 2024 | £441,782 | 2% |
23 Properties |
| 2023 | £430,966 | -3% |
30 Properties |
| 2022 | £445,511 | 6% |
38 Properties |
| 2021 | £418,234 | 6% |
92 Properties |
| 2020 | £391,238 | 6% |
67 Properties |
| 2019 | £367,677 | -16% |
38 Properties |
| 2018 | £428,005 | 20% |
48 Properties |
| 2017 | £343,188 | -3% |
42 Properties |
Property Price per Property Type in Misterton
Here you can find historic sold price data in order to help with your property search.
The average Property Paid Price for specific property types in the last three years are:
| Property Type | Average Sold Price | Sold Properties |
|---|---|---|
| Semi Detached House | £346,979.00 | 24 Semi Detached Houses |
| Detached House | £580,528.00 | 52 Detached Houses |
| Terraced House | £310,416.00 | 12 Terraced Houses |
