
Houses for sale & to rent in SE9 4PP, Charlesfield, Grove Park, London
House Prices in SE9 4PP, Charlesfield, Grove Park
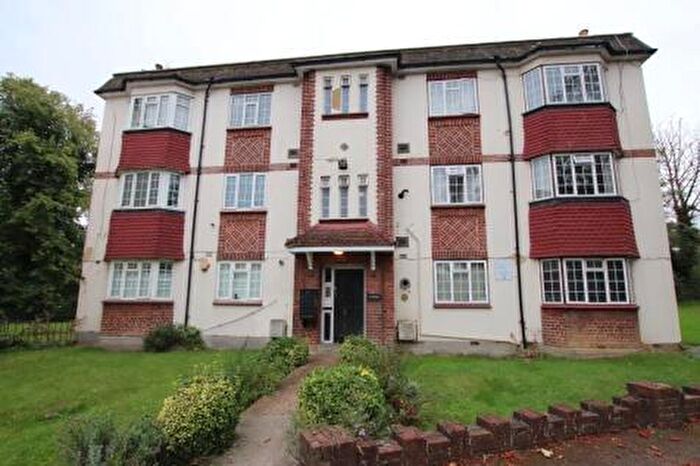
Properties in SE9 4PP have no sales history available within the last 3 years. SE9 4PP is a postcode in Charlesfield located in Grove Park, an area in London, Lewisham London Borough, with 19 households².
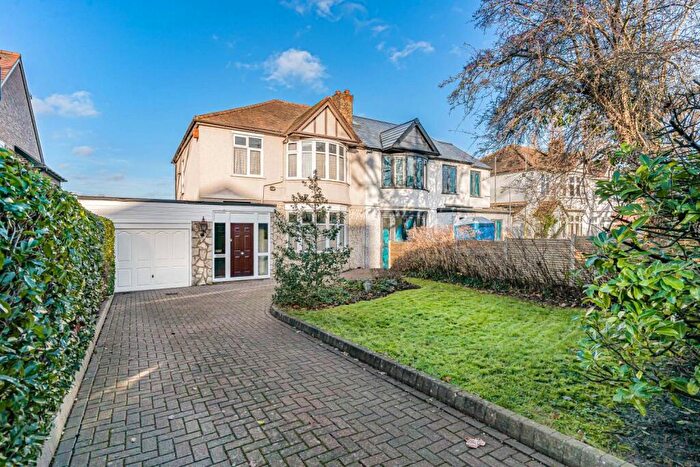
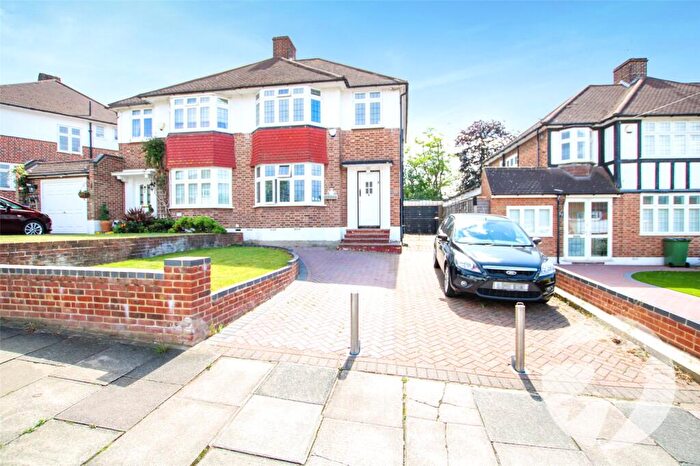
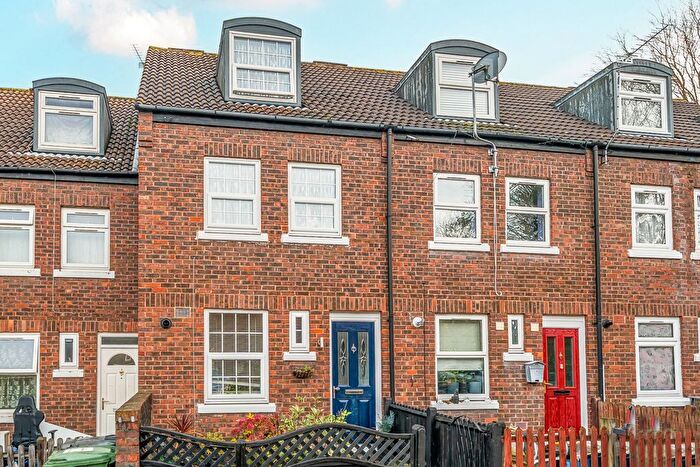
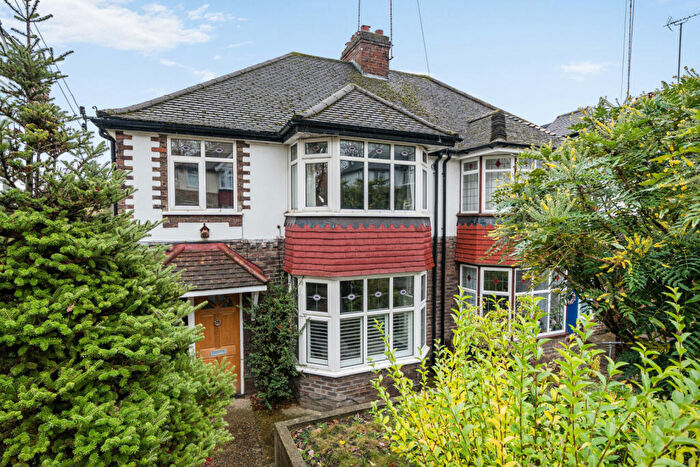
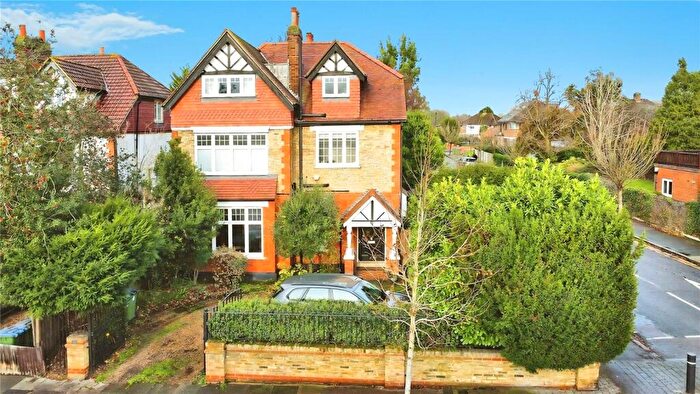
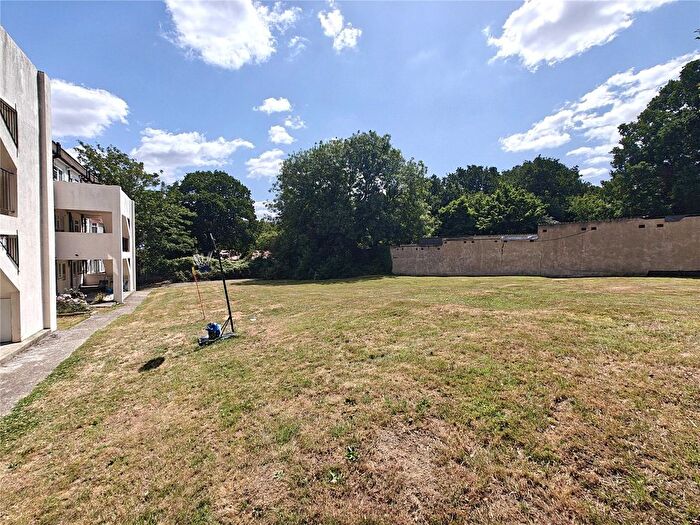
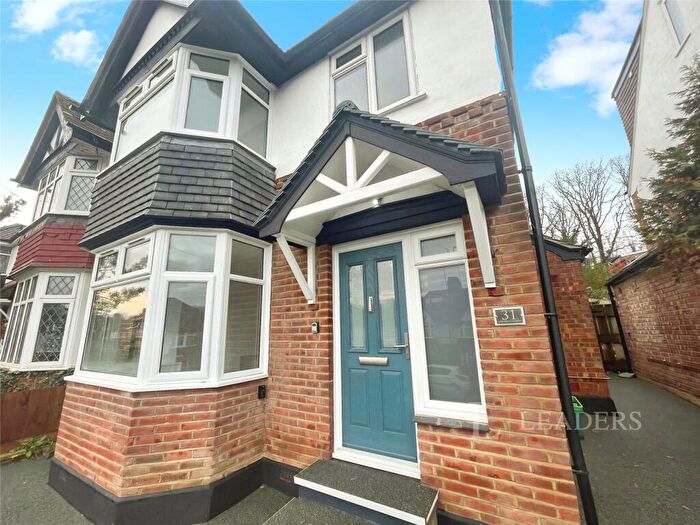
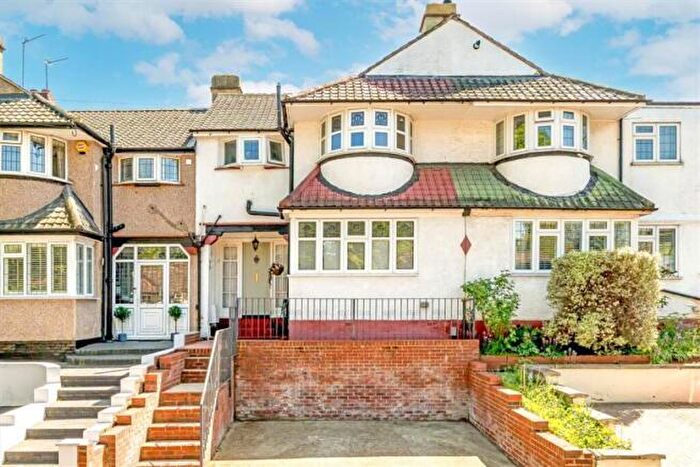
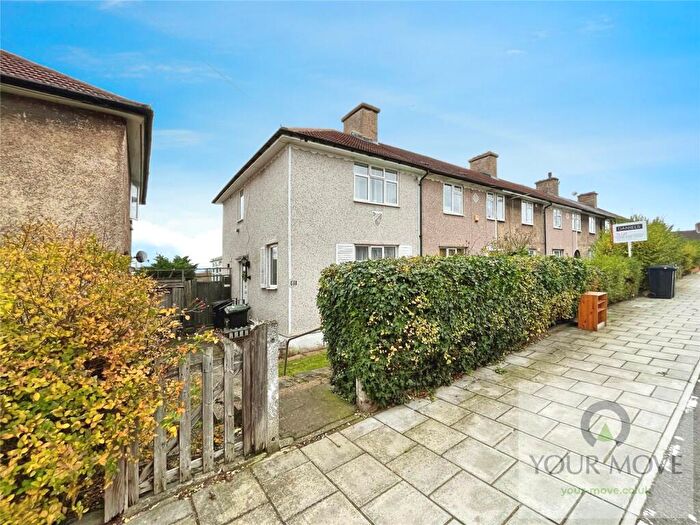
Properties for sale near SE9 4PP, Charlesfield

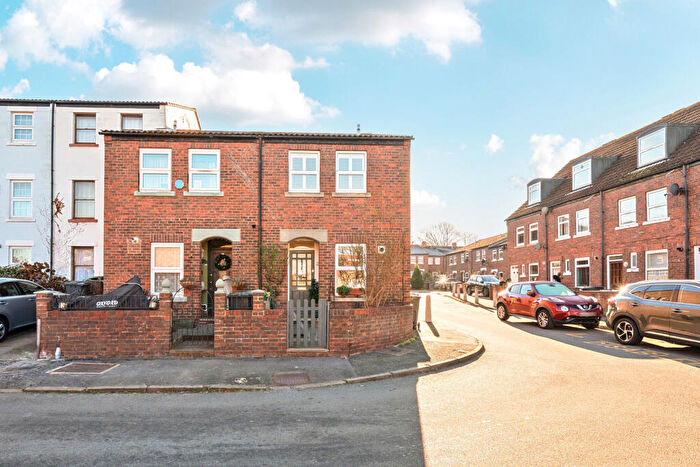
![]()
If you are looking to sell your house, let it out, or receive a property valuation, an expert can help you.
Click the button below to get started.


Price Paid in Charlesfield, SE9 4PP, Grove Park
BUSHEY HOUSE FLAT 16 Charlesfield, SE9 4PP, Grove Park London
Property BUSHEY HOUSE FLAT 16 has been sold 3 times. The last time it was sold was in 17/03/2021 and the sold price was £220,000.00.
This is a Flat which was sold as a leasehold in 17/03/2021
| Date | Price | Property Type | Tenure | Classification |
|---|---|---|---|---|
| 17/03/2021 | £220,000.00 | Flat | leasehold | Established Building |
| 14/07/2017 | £200,000.00 | Flat | leasehold | Established Building |
| 17/04/2003 | £92,000.00 | Flat | leasehold | Established Building |
BUSHEY HOUSE FLAT 10 Charlesfield, SE9 4PP, Grove Park London
Property BUSHEY HOUSE FLAT 10 has been sold 1 time. The last time it was sold was in 06/09/2006 and the sold price was £115,000.00.
This is a Flat which was sold as a leasehold in 06/09/2006
| Date | Price | Property Type | Tenure | Classification |
|---|---|---|---|---|
| 06/09/2006 | £115,000.00 | Flat | leasehold | Established Building |
Postcodes in Charlesfield, Grove Park
Navigate through other locations in Charlesfield, Grove Park, London to see more property listings for sale or to rent.
Transport near SE9 4PP, Charlesfield
-
 Grove Park Station
 -
Mottingham Station
-
Elmstead Woods Station
-
Sundridge Park Station
-
Lee Station
-
New Eltham Station
-
Bromley North Station
-
Eltham Station
-
Chislehurst Station
-
Hither Green Station
House price paid reports for SE9 4PP, Charlesfield
Click on the buttons below to see price paid reports by year or property price:
- Price Paid By Year
Property Price Paid in SE9 4PP, Charlesfield by Year
The average sold property price by year was:
| Year | Average Sold Price | Price Change |
Sold Properties
|
|---|---|---|---|
| 2021 | £220,000 | 9% |
1 Property |
| 2017 | £200,000 | 43% |
1 Property |
| 2006 | £115,000 | 20% |
1 Property |
| 2003 | £92,000 | - |
1 Property |