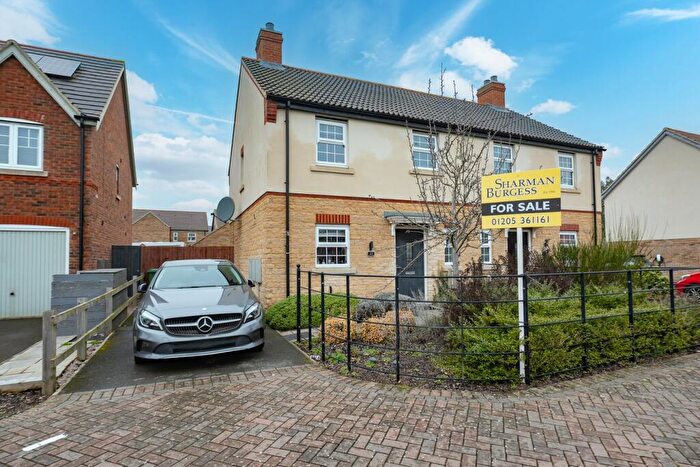
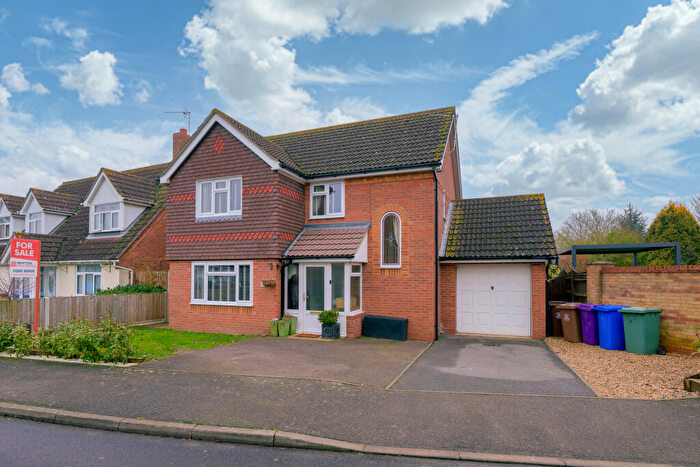
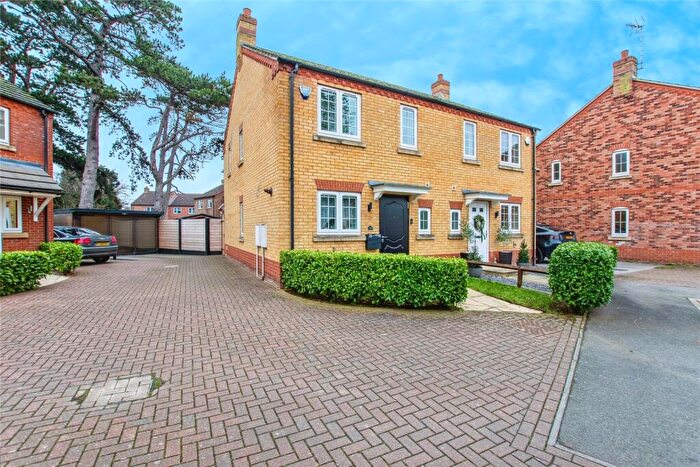
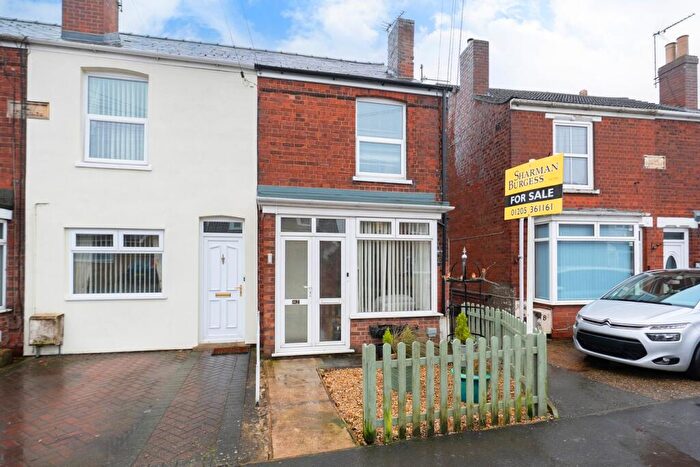
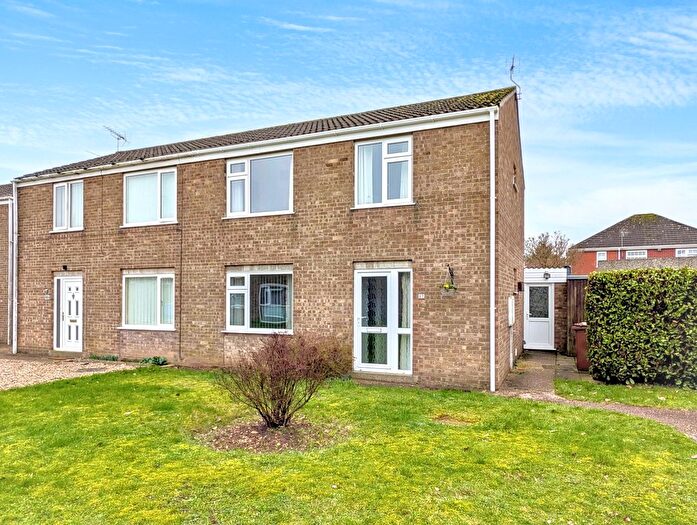
Houses for sale & to rent in South, Boston
House Prices in South
Properties in South have an average house price of £206,739.00 and had 103 Property Transactions within the last 3 years¹.
South is an area in Boston, Lincolnshire with 943 households², where the most expensive property was sold for £1,400,000.00.
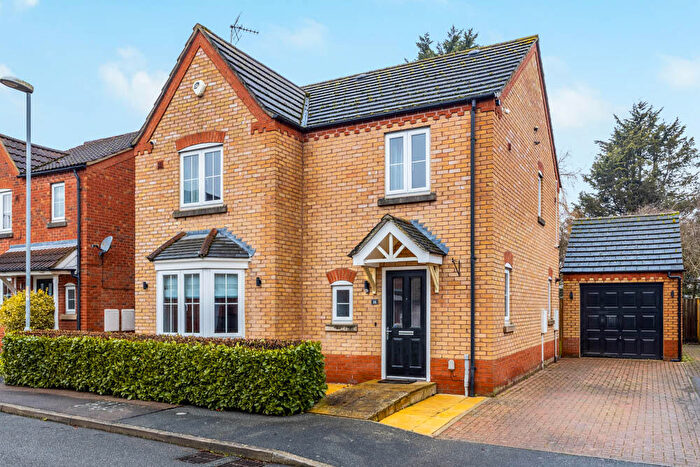
Properties for sale in South
Roads and Postcodes in South
Navigate through our locations to find the location of your next house in South, Boston for sale or to rent.
| Streets | Postcodes |
|---|---|
| Bayswood Avenue | PE21 7RT |
| Bell Court | PE21 7SR |
| Carmel Green | PE21 7JR |
| Castle Square | PE21 7JQ |
| Cater Way | PE21 7LA |
| Davidson Drive | PE21 7LN |
| Edison Way | PE21 7SP |
| Elmwood Avenue | PE21 7RU |
| Farthing Close | PE21 7LY |
| Fleming Court | PE21 7SS |
| Florin Drive | PE21 7LU |
| Gardeners Walk | PE21 7LB |
| Garfits Lane | PE21 7ES PE21 7EX |
| Greenacres Drive | PE21 7LJ |
| Greenbank Close | PE21 7LD |
| Half Crown Court | PE21 7LW |
| Half Penny Court | PE21 7LX |
| Heron Way | PE21 7SH |
| London Road | PE21 7EN PE21 7EQ PE21 7EW PE21 7EZ PE21 7HB PE21 7HF |
| Marsh Avenue | PE21 7RL |
| Marsh Lane | PE21 7RS PE21 7SJ |
| Oldman Close | PE21 7GD |
| Park Road | PE21 7JP PE21 7JW |
| Poplar Close | PE21 7JX |
| Sir Isaac Newton Drive | PE21 7SG |
| St Thomas Drive | PE21 7EP |
| Stephenson Close | PE21 7SY |
| Sterling Court | PE21 7ET |
| The Old Dairy | PE21 7TB |
| Threepenny Way | PE21 7LZ |
| Wellingtonia Park | PE21 7ND |
| Westfield Court | PE21 7GQ |
| White Bridges | PE21 7GE |
| Whittle Close | PE21 7SD |
| Wyberton Low Road | PE21 7RH PE21 7RZ PE21 7SA PE21 7SE PE21 7SX |
| Wyberton West Road | PE21 7JN PE21 7JS PE21 7JU PE21 7JY PE21 7LQ |
Transport near South
- FAQ
- Price Paid By Year
- Property Type Price
Frequently asked questions about South
What is the average price for a property for sale in South?
The average price for a property for sale in South is £206,739. This amount is 5% lower than the average price in Boston. There are 943 property listings for sale in South.
What streets have the most expensive properties for sale in South?
The streets with the most expensive properties for sale in South are London Road at an average of £439,222, Gardeners Walk at an average of £307,475 and Greenacres Drive at an average of £306,500.
What streets have the most affordable properties for sale in South?
The streets with the most affordable properties for sale in South are Castle Square at an average of £75,916, Bell Court at an average of £114,000 and Carmel Green at an average of £120,000.
Which train stations are available in or near South?
Some of the train stations available in or near South are Boston, Hubberts Bridge and Swineshead.
Property Price Paid in South by Year
The average sold property price by year was:
| Year | Average Sold Price | Price Change |
Sold Properties
|
|---|---|---|---|
| 2025 | £205,901 | -13% |
27 Properties |
| 2024 | £233,355 | 23% |
38 Properties |
| 2023 | £180,719 | -6% |
38 Properties |
| 2022 | £192,363 | -7% |
54 Properties |
| 2021 | £206,281 | 22% |
77 Properties |
| 2020 | £160,741 | -1% |
35 Properties |
| 2019 | £161,650 | -0,4% |
35 Properties |
| 2018 | £162,264 | -4% |
58 Properties |
| 2017 | £168,929 | 1% |
50 Properties |
| 2016 | £167,132 | 21% |
72 Properties |
| 2015 | £132,753 | -2% |
69 Properties |
| 2014 | £134,871 | -4% |
53 Properties |
| 2013 | £140,582 | 16% |
51 Properties |
| 2012 | £118,226 | -23% |
44 Properties |
| 2011 | £145,581 | 12% |
46 Properties |
| 2010 | £128,110 | -4% |
63 Properties |
| 2009 | £132,651 | 3% |
52 Properties |
| 2008 | £128,572 | -9% |
84 Properties |
| 2007 | £140,163 | 10% |
107 Properties |
| 2006 | £126,218 | -6% |
59 Properties |
| 2005 | £133,870 | 15% |
49 Properties |
| 2004 | £113,227 | -2% |
71 Properties |
| 2003 | £115,078 | 15% |
94 Properties |
| 2002 | £98,232 | 21% |
89 Properties |
| 2001 | £77,599 | 26% |
94 Properties |
| 2000 | £57,247 | 9% |
65 Properties |
| 1999 | £52,065 | 6% |
65 Properties |
| 1998 | £48,957 | -4% |
46 Properties |
| 1997 | £50,717 | 13% |
51 Properties |
| 1996 | £44,184 | 2% |
49 Properties |
| 1995 | £43,221 | - |
23 Properties |
Property Price per Property Type in South
Here you can find historic sold price data in order to help with your property search.
The average Property Paid Price for specific property types in the last three years are:
| Property Type | Average Sold Price | Sold Properties |
|---|---|---|
| Semi Detached House | £164,334.00 | 25 Semi Detached Houses |
| Detached House | £281,811.00 | 48 Detached Houses |
| Terraced House | £139,804.00 | 21 Terraced Houses |
| Flat | £80,333.00 | 9 Flats |

