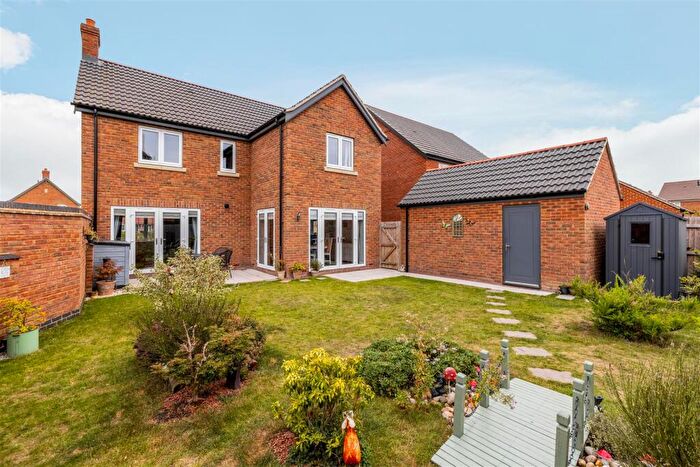
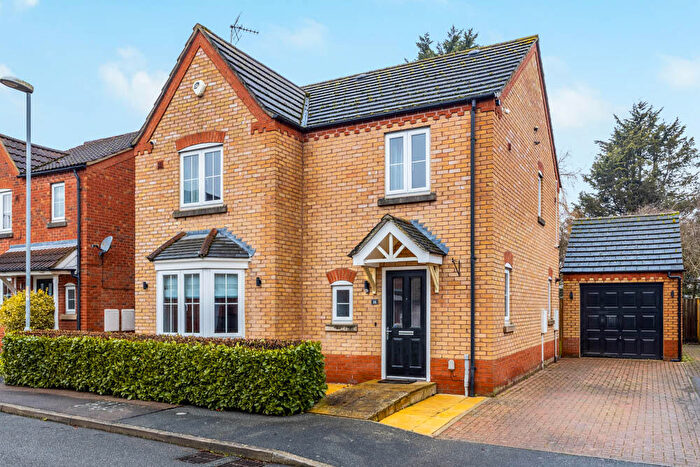
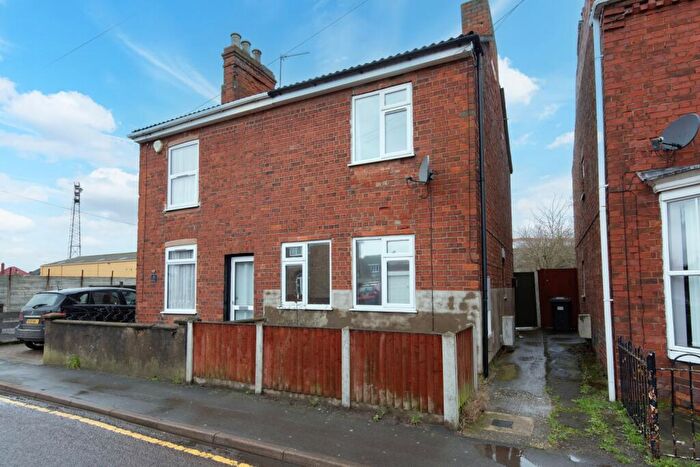
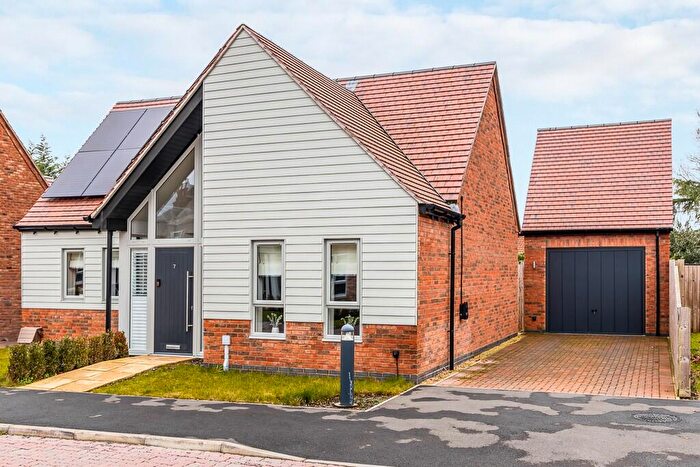
Houses for sale & to rent in Wyberton, Boston
House Prices in Wyberton
Properties in Wyberton have an average house price of £227,600.00 and had 121 Property Transactions within the last 3 years¹.
Wyberton is an area in Boston, Lincolnshire with 1,622 households², where the most expensive property was sold for £475,000.00.
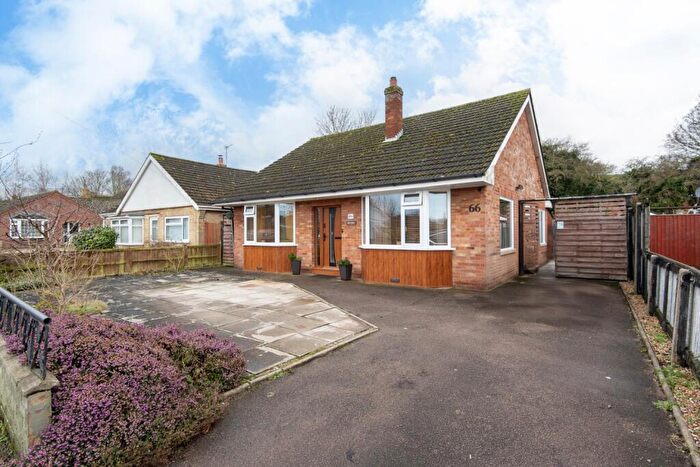
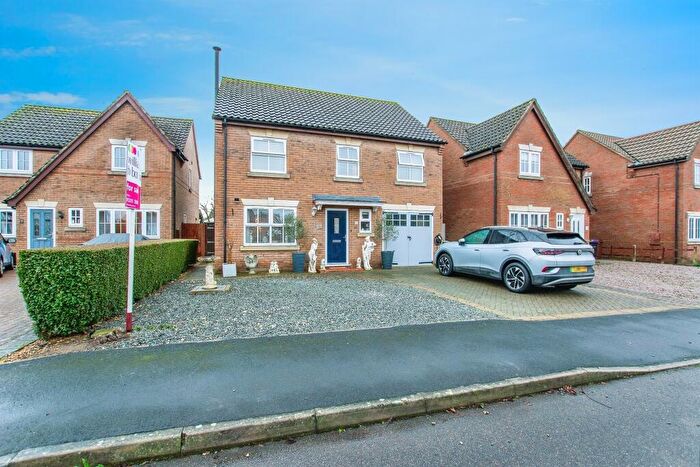
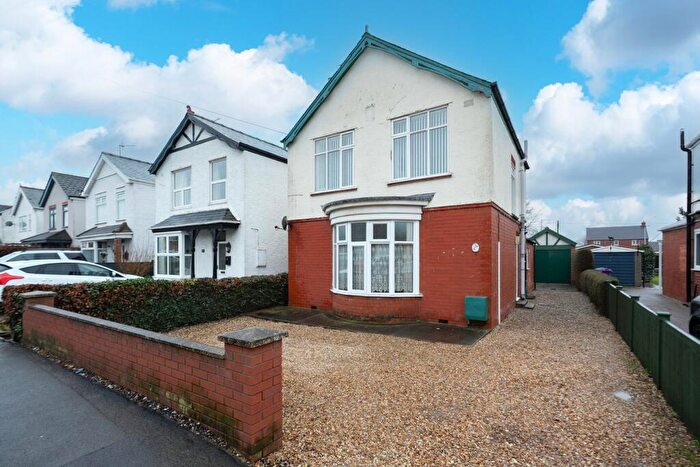
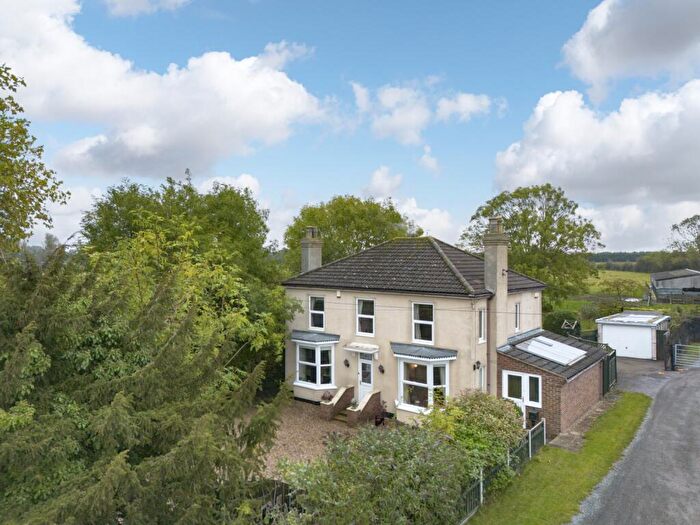
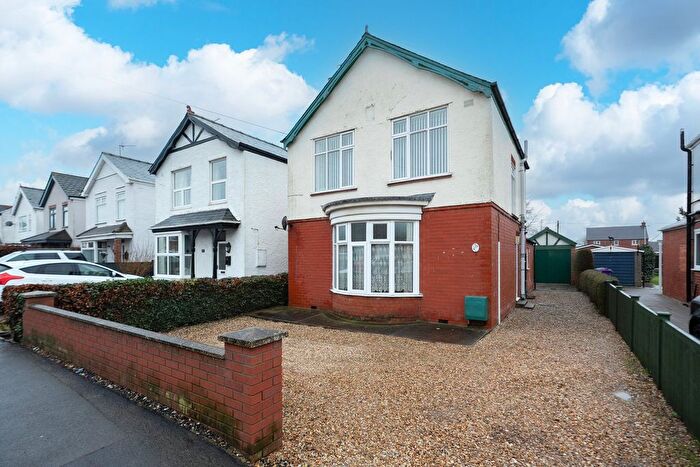
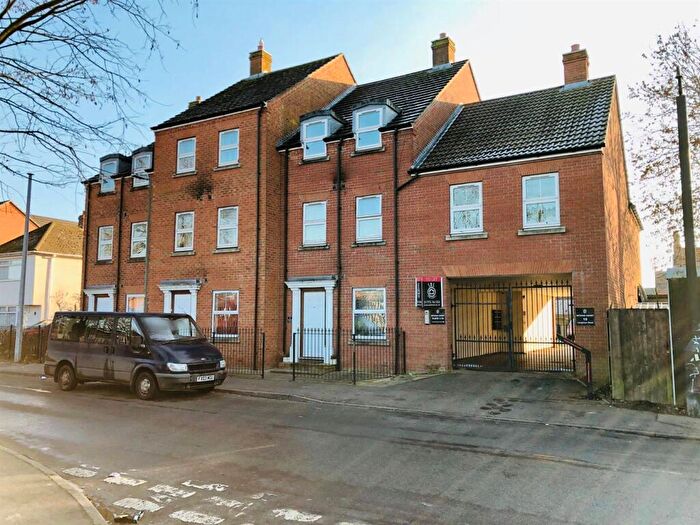
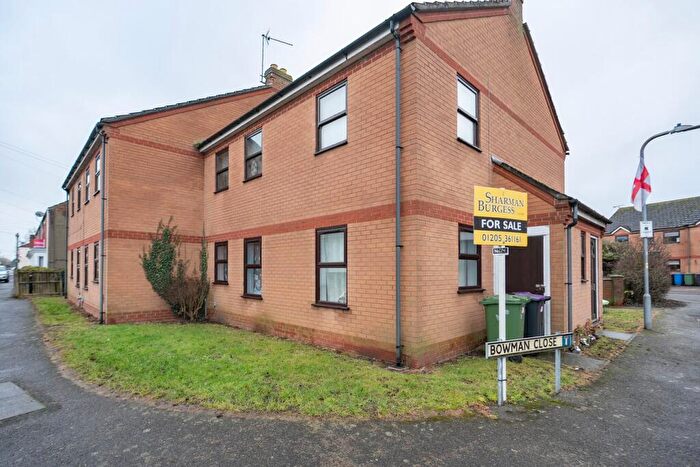
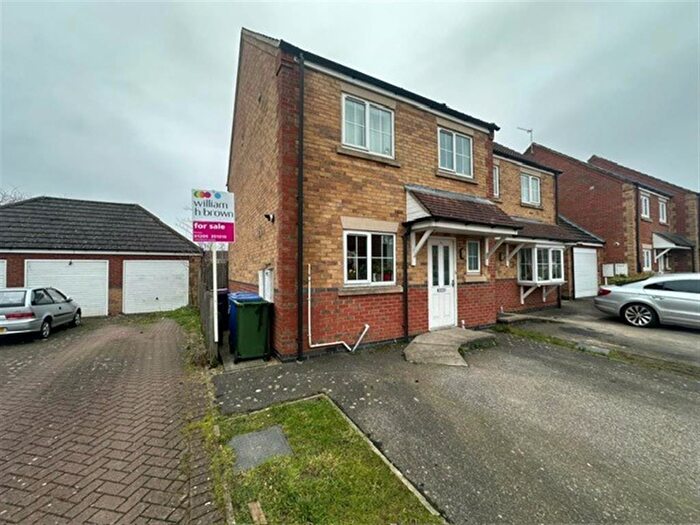
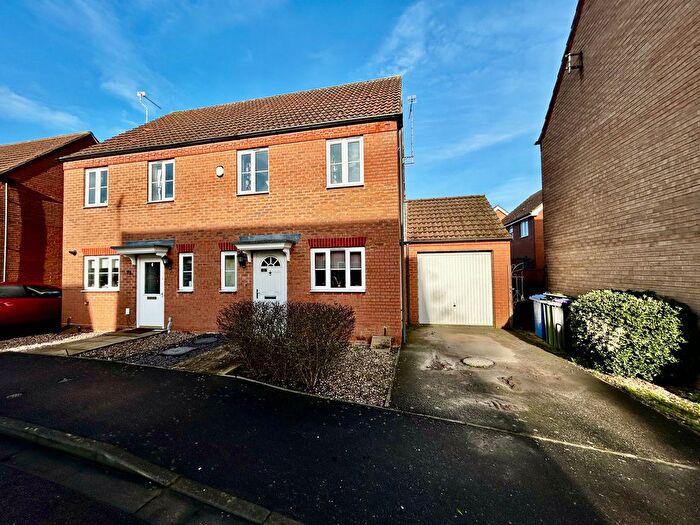
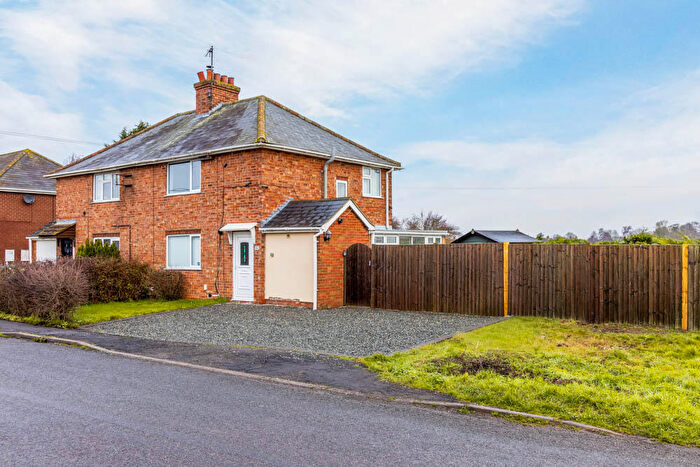
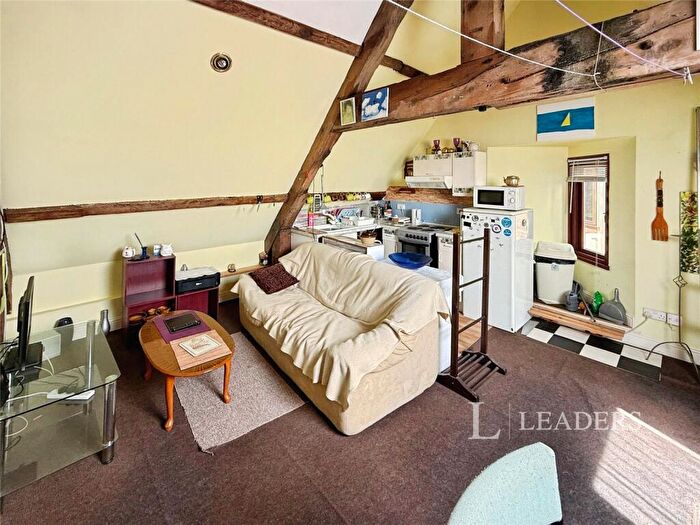
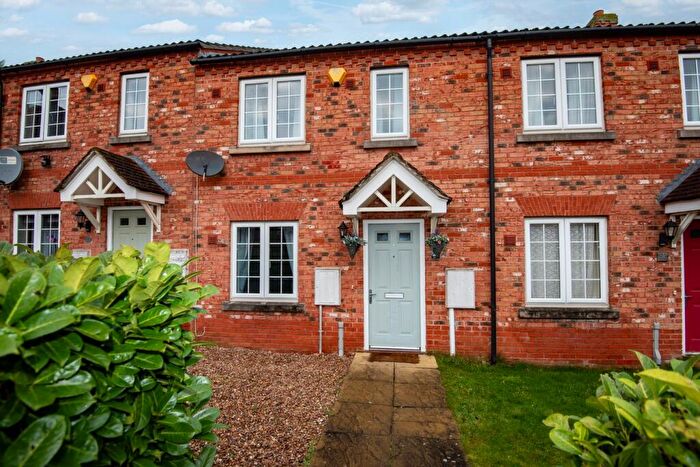
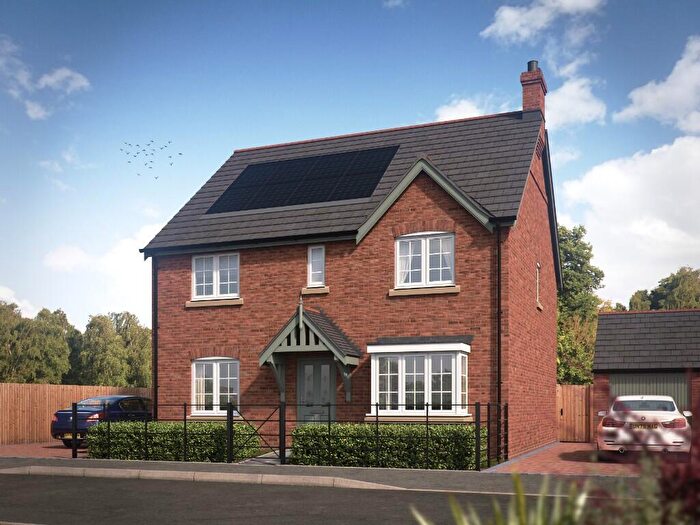
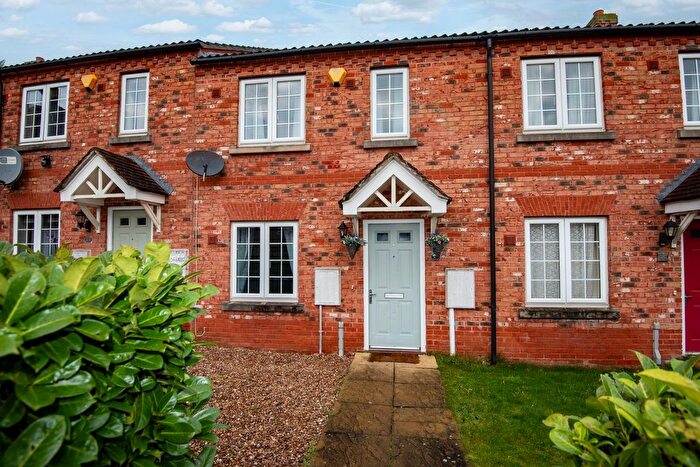
Properties for sale in Wyberton
Roads and Postcodes in Wyberton
Navigate through our locations to find the location of your next house in Wyberton, Boston for sale or to rent.
| Streets | Postcodes |
|---|---|
| Alban Retail Park | PE21 7NN |
| Allerton Court | PE21 7AN |
| Ashton Hall Drive | PE21 7TF |
| Bankside | PE21 7HY |
| Birch Close | PE21 7AL |
| Boardsides | PE21 7NY PE21 7NU |
| Bunkers Hill | PE21 7AE PE21 7AD |
| Causeway | PE21 7AR PE21 7BS |
| Cavendish Drive | PE21 7BN PE21 7BP PE21 7BW |
| Chain Bridge Road | PE21 7LE |
| Church Lane | PE21 7AF |
| Clarke Court | PE21 7EE PE21 7EF |
| Closshill Lane | PE21 7AB |
| Collingwood Crescent | PE21 7BH |
| Deldale Road | PE21 7BE PE21 7BG PE21 7BT |
| Delfield Road | PE21 7BB PE21 7EB PE21 7ED |
| Dunlin Close | PE21 7FJ |
| Egret Place | PE21 7FH |
| Enterprise Way | PE21 7TW |
| Field Drive | PE21 7NG |
| Five House Lane | PE21 7NA PE21 7JA |
| Gilbert Drive | PE21 7TQ PE21 7TR |
| Grantham Road | PE21 7NL |
| Granville Avenue | PE21 7BY |
| Great Fen Road | PE21 7PB |
| Healey Close | PE21 7NS |
| London Road | PE21 7AU PE21 7AY PE21 7AZ PE21 7BA PE21 7DE PE21 7EA PE21 7HG PE21 7HQ PE21 7DD PE21 7HJ |
| Loveday Lane | PE21 7AJ |
| Low Road | PE21 7AP PE21 7AS |
| Mercer Lane | PE21 7NR |
| New Hammond Beck Road | PE21 7JD |
| Old Hammond Beck Road | PE21 7JB |
| Parker Close | PE21 7FW |
| Parkes Lane | PE21 7NT |
| Parthian Avenue | PE21 7DF PE21 7DG PE21 7DH PE21 7DL PE21 7DP PE21 7DQ PE21 7DS PE21 7DY PE21 7DJ PE21 7DT PE21 7DW PE21 7DZ |
| Phoenix Road | PE21 7JZ |
| Picketts Way | PE21 7JH |
| Pilgrim Way | PE21 7NE |
| Ralphs Lane | PE21 7AX |
| Resolution Close | PE21 7TT |
| Rowdyke | PE21 7AQ |
| Saundergate Lane | PE21 7BX PE21 7BZ PE21 7DB |
| Saundergate Lane East | PE21 7AT |
| Saundergate Park | PE21 7BU |
| Scott Drive | PE21 7NH |
| Silt Pit Lane | PE21 7AG |
| Slippery Gowt Lane | PE21 7AA PE21 7SQ |
| Solhem Avenue | PE21 7DA |
| Solway Avenue | PE21 7HR |
| Spice Avenue | PE21 7BQ |
| St Leodegars Close | PE21 7DU PE21 7DX PE21 7DR |
| Streetway | PE21 7AH PE20 1BE |
| Swineshead Road | PE21 7JE PE21 7JG |
| Tytton Close | PE21 7BL |
| Tytton Lane East | PE21 7HP PE21 7HT PE21 7HW PE21 7TD |
| Tytton Lane West | PE21 7HL PE21 7HN PE21 7HU |
| Vine Crescent | PE21 7BD |
| Webster Walk | PE21 7NP |
| Wells Place | PE21 7NJ |
| West End Road | PE21 7LL PE21 7LP PE21 7LR PE21 7LS PE21 7NQ PE21 7NB |
| Winter Way | PE21 7DN |
| Woodside | PE21 7HE |
| Wortleys Lane | PE21 7JF |
| Wybert Crescent | PE21 7BJ |
| Wyberton Low Road | PE21 7SF |
| Wyberton Roads | PE20 1BA PE20 1BB PE20 1BD |
| Yarborough Road | PE21 7HS |
Transport near Wyberton
- FAQ
- Price Paid By Year
- Property Type Price
Frequently asked questions about Wyberton
What is the average price for a property for sale in Wyberton?
The average price for a property for sale in Wyberton is £227,600. This amount is 5% higher than the average price in Boston. There are 3,911 property listings for sale in Wyberton.
What streets have the most expensive properties for sale in Wyberton?
The streets with the most expensive properties for sale in Wyberton are Low Road at an average of £368,333, Silt Pit Lane at an average of £365,000 and Streetway at an average of £310,000.
What streets have the most affordable properties for sale in Wyberton?
The streets with the most affordable properties for sale in Wyberton are St Leodegars Close at an average of £135,000, Clarke Court at an average of £140,833 and Granville Avenue at an average of £149,000.
Which train stations are available in or near Wyberton?
Some of the train stations available in or near Wyberton are Boston, Hubberts Bridge and Swineshead.
Property Price Paid in Wyberton by Year
The average sold property price by year was:
| Year | Average Sold Price | Price Change |
Sold Properties
|
|---|---|---|---|
| 2025 | £231,735 | 7% |
39 Properties |
| 2024 | £215,206 | -10% |
44 Properties |
| 2023 | £237,705 | 5% |
38 Properties |
| 2022 | £225,155 | 6% |
63 Properties |
| 2021 | £210,747 | 17% |
110 Properties |
| 2020 | £174,810 | -14% |
69 Properties |
| 2019 | £198,801 | 8% |
62 Properties |
| 2018 | £182,189 | 10% |
75 Properties |
| 2017 | £164,796 | 6% |
64 Properties |
| 2016 | £154,261 | -3% |
63 Properties |
| 2015 | £158,196 | -13% |
68 Properties |
| 2014 | £179,396 | 28% |
51 Properties |
| 2013 | £129,283 | -16% |
47 Properties |
| 2012 | £149,804 | 13% |
31 Properties |
| 2011 | £130,824 | 1% |
32 Properties |
| 2010 | £130,101 | 1% |
37 Properties |
| 2009 | £128,869 | -10% |
38 Properties |
| 2008 | £142,164 | -6% |
28 Properties |
| 2007 | £150,702 | 6% |
83 Properties |
| 2006 | £142,331 | 15% |
64 Properties |
| 2005 | £120,940 | -5% |
64 Properties |
| 2004 | £126,784 | 8% |
73 Properties |
| 2003 | £116,522 | 26% |
54 Properties |
| 2002 | £85,746 | 26% |
93 Properties |
| 2001 | £63,360 | 8% |
63 Properties |
| 2000 | £58,497 | 4% |
66 Properties |
| 1999 | £56,199 | 7% |
98 Properties |
| 1998 | £52,323 | 6% |
71 Properties |
| 1997 | £49,219 | 17% |
62 Properties |
| 1996 | £40,787 | -10% |
54 Properties |
| 1995 | £44,667 | - |
39 Properties |
Property Price per Property Type in Wyberton
Here you can find historic sold price data in order to help with your property search.
The average Property Paid Price for specific property types in the last three years are:
| Property Type | Average Sold Price | Sold Properties |
|---|---|---|
| Semi Detached House | £167,980.00 | 34 Semi Detached Houses |
| Detached House | £262,838.00 | 79 Detached Houses |
| Terraced House | £147,750.00 | 6 Terraced Houses |
| Flat | £88,750.00 | 2 Flats |

